An in-depth kinetics study of chemically modified human serum albumin aggregation and fibrillation†
Q. Q. Yanga,
J. Q. Zhanga,
Z. Q. Xuab,
J. C. Jina,
L. Yuana,
P. Donga,
F. L. Jianga and
Y. Liu*a
aState Key Laboratory of Virology, Key Laboratory of Analytical Chemistry for Biology and Medicine (MOE), College of Chemistry and Molecular Sciences, Wuhan University, Wuhan 430072, P. R. China. E-mail: yiliuchem@whu.edu.cn
bHubei Collaborative Innovation Center for Advanced Organic Chemical Materials, Key Laboratory for the Green Preparation and Application of Functional Materials (MOE), Hubei Province Key Laboratory of Industrial Biotechnology, Faculty of Materials Science & Engineering, Hubei University, Wuhan 430062, P. R. China
First published on 19th October 2016
Abstract
It has been firmly established that amyloid aggregates formed by protein misfolding are the main cause of many neurodegenerative diseases. Human serum albumin (HSA) has been studied for a long time as a model for protein aggregation, and it has been shown to have no nucleation step. Herein, chemically modified HSAs with different surface charges are used to study the process of protein fibrillation and the inhibition mechanism of quantum dots (QDs) in aqueous solutions in vitro. This study shows that HSAs with different surface charges have a similar secondary structure, but they show very different thermal stabilities and fibrillation rates. For the first time, using kinetic methods from CD results, we propose that there exists an inflection point which divides the fibrillation process into two stages, an aggregation stage and a fibril formation stage. It is interesting that the inhibitory effect of CdTe QDs mainly affects the first stage of fibrillation rather than the final stage. When incubated with more cationic HSA (cHSA), the cHSA stays in the small cluster stage longer than compared with cHSA without CdTe QDs. Although the HSAs with different surface charge distributions formed fibrils at different rates, they exhibit the same kinetic process. This can give some insights into the design of better inhibitory materials for protein fibrillation, and give us a better understanding about the mechanism of the protein fibrillation process from a physical chemistry perspective.
Introduction
Protein amyloidosis is associated with many neurodegenerative diseases such as Alzheimer’s and Parkinson’s diseases, as well as type II diabetes.1–4 The generally considered cause of these diseases is abnormal protein folding which results in aggregation of the protein, indicating that the soluble protein structure has changed to insoluble fibrils with a large content of cross β-sheet structures5,6 that are deposited into brain tissues or some other tissues, producing cellular toxicity as well as causing damage to these tissues.7,8 HSA is the most abundant in plasma proteins, playing a crucial role in the transportation of molecules, and it is usually chosen as a model to study the process of amyloid protein fibrillation, which involves the partial destabilization of HSA molecules to form amyloid-like fibrils.9,10 It has been taken into consideration by scientists that when nanomaterials (NMs) encounter biological systems, they are firstly surrounded by serum albumin.11 Recent studies have found that modification of serum albumin can affect the interaction between NMs and proteins, resulting in a difference in nanoparticle (NP) uptake by cells.12,13 The Xie group also used acidulated serum albumin to inhibit Aβ fibrillation.14 However, the aggregation inclination of modified serum proteins has not been studied in vivo or in vitro.A wide variety of different NMs have been synthesized, ranging from bare inorganic surfaces over organic coatings to intricate polymeric structures in recent studies. NMs have emerged as candidates for a variety of practical applications, especially in biomedical applications.15–18 Various materials have different effects on protein fibrillation, for example copolymer particles, cerium oxide particles, QDs, and carbon nanotubes can significantly enhance the rate of the formation of fibrils.19 Understanding the denaturation and fibrillation process of a protein is a critical issue to allow their medical use. Although proteins are considered as flexible biomolecules that suffer from structure fluctuations when they interact with some types of NMs,20 the detailed mechanisms of protein aggregation and fibril formation, influenced by NMs, have not been made clear enough.21 Numerous efforts have been made to design specific NMs that can achieve therapeutic effects in the field of neuropathology. Li et al. have reported that amyloid fibrillation can be inhibited by quenching the nucleation and elongation processes in the presence of a small amount of N-acetyl-L-cysteine capped QDs (NAC-QDs).22 Many other studies have focused on NM properties such as hydrophobicity, zeta potential, particle size and surface properties to help to explain the reason for the inhibition results.23–26
Considering the feasible synthesis route for QDs,27,28 herein, we chose NAC capped CdTe QDs, which have a relatively low cytotoxicity compared with MPA and TGA ligands,29 to explore the inhibition mechanisms for small size QDs in protein fibrillation. Herein, we introduced chemical methods to modify the HSA surface charge,30–33 and studied the aggregation and fibrillation pathways. We found that changes in the HSA surface charge distribution may result in HSA thermal stability variations, causing a difference in the force of the protein–QD interactions as well. The aggregation and fibrillation rate of the protein could be influenced by those factors, so the secondary structure of the proteins would be affected and possibly change over time.34 To the best of our knowledge, this is the first study of the kinetic processes of modified serum protein aggregation and fibrillation, which also provides new clues to enable the design of novel materials, and provides a better understanding of the mechanisms of fibril formation.
Materials and methods
Materials
All of the chemicals used were of analytical grade, purchased from commercial sources and used without further purification. Human serum albumin (HSA) was purchased from Sigma Chemical (USA) and Thioflavin T (ThT), sodium chloride (NaCl), potassium chloride (KCl), sodium hydrogen phosphate (Na2HPO4) and potassium dihydrogen phosphate (KH2PO4) were purchased from Sinopharm Chemical Reagent Company (China). All of the reagents were used as received and aqueous solutions were prepared with ultra pure water (18.2 MΩ cm−1, Millipore).Synthesis of NAC-capped CdTe QDs
The synthesis of high quality water soluble NAC-capped CdTe QDs was performed using methods reported by our group previously.27 The synthetic procedure is described in the ESI† in detail.Modification for different surface charged HSAs
According to the published methods above, HSA proteins modified with different charges were obtained by carboxylate and amination reactions. Succinylation of serum albumin (aHSA) was carried out using succinic acid anhydride (purity: 99%, Aldrich). Succinic acid anhydride was dissolved at a concentration of 0.8 M in 1,4-dioxane (purity: 99%, Aldrich) and added in small portions to 5.3 mL of a 150 μM HSA solution in PBS buffer over a period of 15 min to reach a total volume of 120 μL, so that an 8-fold molar excess of HSA was reached. Amination of HSA (cHSA) was performed by adding 20 mg of 1-ethyl-3-(3-dimethylamino-propyl)-carbodiimide (EDC, Sigma Aldrich) to a mixture of 5 mL of HSA (10 mg mL−1) and 5 mL of ethylenediamine (1 M, Aldrich) in PBS. The solution was stirred for 2 h at room temperature. The reaction schemes for the protein surface charge modifications are shown in Scheme 1. The two charged proteins were obtained with partial modifications and the products were purified by ultra-filtration and washed with PBS (pH = 7.4) three times.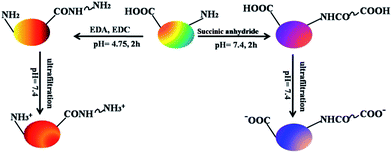 | ||
| Scheme 1 Chemical modification of HSA and the synthesis route to cHSA and aHSA. The red and blue colors in the spheres correspond to the positive and negatively charged proteins, respectively. | ||
The fibrillation process of HSA incubated in the presence or absence of QDs detected by ThT
A stock solution of HSA was prepared by dissolving HSA in PBS (pH = 7.4), and its concentration was determined by measuring the absorbance at 280 nm using a molar extinction coefficient of 35![[thin space (1/6-em)]](https://www.rsc.org/images/entities/char_2009.gif) 219 M−1 cm−1.38 NAC-CdTe QDs (30–300 nM) were added to explore the effects of electrostatic interactions on different surface charge protein fibrillations. HSA fibrillation was studied by incubating the samples at a constant temperature of 60 °C. The protein monomer has a relatively slow aggregation rate, which helps them to avoid irregular coagulation at this temperature.39 The total incubation time was 96 h, and 100 μL aliquots were withdrawn at certain intervals. These aliquots were stored at −20 °C before the measurements were taken, melted and then diluted 40-fold (the final concentration of the protein solution was 3.75 μM) into a ThT solution with a final concentration of 50 μM in order to record the fluorescence intensity. Fluorescence was measured using an LS-55 Fluorophotometer (Perkin-Elmer, USA) in ratio mode. The samples were scanned in a quartz cell with a 1 cm path length at an excitation wavelength of 450 nm, with an emission wavelength ranging from 460 to 650 nm. Slit widths for both excitation and emission were kept at 5 nm. Each group experiment has been repeated at least three times to get te mean value of the final ThT FL intensity.
219 M−1 cm−1.38 NAC-CdTe QDs (30–300 nM) were added to explore the effects of electrostatic interactions on different surface charge protein fibrillations. HSA fibrillation was studied by incubating the samples at a constant temperature of 60 °C. The protein monomer has a relatively slow aggregation rate, which helps them to avoid irregular coagulation at this temperature.39 The total incubation time was 96 h, and 100 μL aliquots were withdrawn at certain intervals. These aliquots were stored at −20 °C before the measurements were taken, melted and then diluted 40-fold (the final concentration of the protein solution was 3.75 μM) into a ThT solution with a final concentration of 50 μM in order to record the fluorescence intensity. Fluorescence was measured using an LS-55 Fluorophotometer (Perkin-Elmer, USA) in ratio mode. The samples were scanned in a quartz cell with a 1 cm path length at an excitation wavelength of 450 nm, with an emission wavelength ranging from 460 to 650 nm. Slit widths for both excitation and emission were kept at 5 nm. Each group experiment has been repeated at least three times to get te mean value of the final ThT FL intensity.
Secondary structure study
Far-UV CD spectra were recorded to detect any changes in the protein secondary structure using an automatic recording spectrophotometer (Applied Photophysics (UK)) at 25 °C using a quartz cuvette with a 0.1 cm path length, and the scan range was between 200 and 260 nm. The final concentration of protein for each sample was kept at 3.75 μM. The final result of the protein secondary structure content was determined using the online CONTINLL server. Using CD, changes in the fraction of folded HSA in the absence or presence of QDs could be determined as αs. θs is the observed mdeg value at 208 nm for HSA (in the presence or absence of QDs) aggregation solutions, θf is the mdeg value at 208 nm for the HSA fibrillar solution and θn is the mdeg value at 208 nm for the native HSA solution.40We used αs to determine the fibrillation rate using quantitative analysis.
Transmission electron microscopy (TEM) analysis
TEM was used to observe the presence of fibrils. Aliquots were negatively stained using 2% phosphotungstic acid. The liquid samples were prepared by ultra-filtration at 9000 rpm, and washed with Milli-Q water three times to remove as much salt as possible. Then a dilution was performed to get the same final concentration and 10 μL 10-fold diluted (3.75 μM) aliquots were dropped on a carbon coated TEM grid. After a while, 3 μL of staining solution was placed on the grid and left for 3 min. The droplet around the grid was removed, and the grid was left to air dry.Results and discussion
Characterization of HSA after being modified
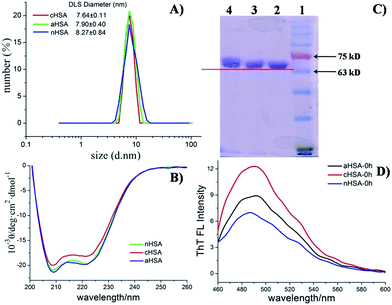
The physical chemical properties of the proteins before and after modification have been characterized thoroughly, ensuring that the chemical reaction was completely finished and the initial structures of the modified proteins remained in a normal state. Zeta potential measurements revealed a more negative effective charge for aHSA (−11.8 ± 0.6 mV) and a more positive one for cHSA (−5.7 ± 0.4 mV) with respect to nHSA (−8.84 ± 1.2 mV) in PBS at a concentration of 2 μM. We also measured the hydrodynamic diameters in PBS (pH 7.4) by dynamic light scattering (DLS). Fig. 1A shows the size distributions of the three kinds of proteins at 0 h, which were nearly the same, indicating no aggregation of the proteins after chemical modification. An SDS-PAGE experiment (Fig. 1C) was also carried out to confirm the modification results. All of these results were repeated more than three times. CD (Fig. 1B) and ThT fluorescence spectroscopy (Fig. 1D) indicated that the chemical modification procedures may not have induced any major perturbations of the protein fold or even complete unfolding. The fluorescence spectra and the UV spectra showed the optical properties of NAC-QDs in 50 mM phosphate buffered saline (PBS, pH 7.4) (Fig. S1†). The concentration of the QD stock solution was calculated using the empirical formula.35Aggregation process study of three modified proteins
Morphology detection
Circular dichroism (CD) study of changes in the secondary structures of modified proteins among fibrillation pathways
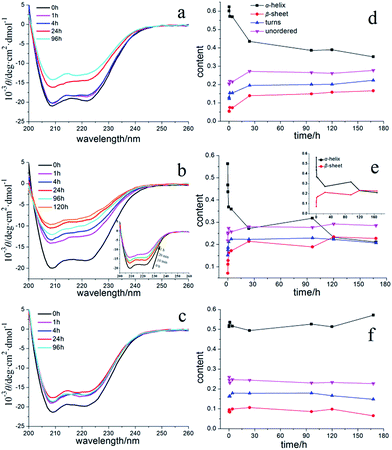
CD spectroscopy is widely used to characterize secondary conformational changes in proteins. At the beginning, nHSA alone (3.75 μM, 40-fold dilution) had two negative bands at 208 and 222 nm, characteristic of the natively α-helical abundant protein (shown in Fig. 4a). Both bands shrink to some extent after a 4 h incubation period, which is then followed by a larger decrease after 12 h. As shown in Fig. 4b, cHSA displayed a faster rate of decline in α-helix content from 0 h to 4 h and reached its kinetic equilibrium after 24 h of incubation. From the results of the CD spectrum in Fig. 4c, we could further confirm that aHSA had no secondary structure changes under the conditions mentioned previously, meaning that aHSA remained in its monomer state without aggregating. This inspired us to do more to try to better explain the characteristics of the fibrillation process. A qualitative method was used here to study whether there were some similar principles in the protein fibrillation process. As deduced from Fig. S4,† a reduction in the fraction of folded HSA (αs) showed that the proportion of normal protein decreases with time and that they are logarithmically related. Furthermore, the logarithm of αs (ln(αs)) showed a good linear relationship that declined with time, and the values of k represented the aggregation rate constants for nHSA and cHSA (insert Fig. S4†). Among this aggregation process, only sphere aggregates were formed and no fibrils had yet been produced. Moreover, the results in Fig. S4† showed that some characteristics conformed to certain kinetic laws.In addition, the increments or decrements in the content of the four kinds of secondary structure were calculated, as listed in Table 1 (for a quantitative estimation of the secondary structures, the online CONTINLL server was used). Among these four kinds of structures, the β-turn and random coil content increased during the first several hours and had no significant changes later, which may have some implications for how the fibrillation process happened and show some probable mechanisms for the fibril formation. All of these CD results demonstrate that these three different surface modifications of the protein have distinct fibrillation results, obtained from FL spectroscopy.
| Content (%) | α-Helix | β-Sheet | Turn | Unordered | ||||
|---|---|---|---|---|---|---|---|---|
| 0 h to 96 h | Change | 0 h to 96 h | Change | 0 h to 96 h | Change | 0 h to 96 h | Change | |
| nHSA | 60 to 35 | −25 | 6 to 17 | +11 | 13 to 22 | +9 | 20 to 28 | +8 |
| cHSA | 56 to 21 | −35 | 7 to 23 | +16 | 15 to 21 | +6 | 22 to 29 | +7 |
| aHSA | No significant change | |||||||
![[thin space (1/6-em)]](https://www.rsc.org/images/entities/char_2009.gif) :
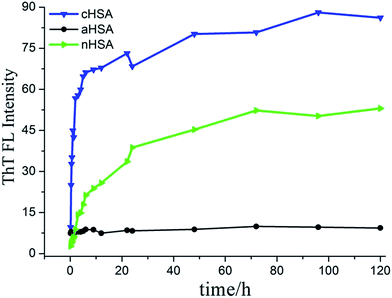
:![[thin space (1/6-em)]](https://www.rsc.org/images/entities/char_2009.gif) 2500), indicating that the NAC-CdTe QDs would be more effective in preventing the fibril formation of cHSA. Our later studies regarding the QD inhibitory effect were mainly based on cHSA, because the highest fibril formation occurs for cHSA compared to the other two proteins when under the same conditions, as mentioned above. Considering that several intermediates coexist during the protein fibrillation process, we tried to study the mechanism of the QD inhibitory effect on cHSA. Fig. 7 and 8a gave us some information about the fibrillation mechanisms of cHSA itself and how the QDs can inhibit the cHSA fibril formation. Firstly, cHSA formed oligomers and the size distribution of the oligomers became larger as the incubation time increased from 0 h to 4 h. An explanation for this could be that the fibrillation solution system was heterogeneous so, along with the monomers, self assembled into large oligomers and the oligomers then assembled into protofibrils.37 Secondly, we could see bead-like spheres and some short amorphous curved fibrils next to the spheres of the cHSA-QDs solution at 12 h, as shown in Fig. 7c. Apparently, with the addition of the QDs, the oligomer stage was prolonged, with no mature fibrils being formed after 12 h compared with cHSA without QDs, as shown in Fig. 7a. This shows that the cHSA-QDs stay in the oligomer stage for a longer amount of time, eventually forming fibrils at 96 h (Fig. 7d). Thirdly, accompanied by the kinetic study results shown in Fig. 8b, we could see that with the aggregation of cHSA without a QD solution within the first 4 h of the incubation time, the rate constant (k) of ln(αs) decreased over time by 0.161, which was more than two times that of the cHSA-QDs system (k = 0.075), meaning that the QDs could protect the protein from becoming unfolded and aggregated to some extent.
2500), indicating that the NAC-CdTe QDs would be more effective in preventing the fibril formation of cHSA. Our later studies regarding the QD inhibitory effect were mainly based on cHSA, because the highest fibril formation occurs for cHSA compared to the other two proteins when under the same conditions, as mentioned above. Considering that several intermediates coexist during the protein fibrillation process, we tried to study the mechanism of the QD inhibitory effect on cHSA. Fig. 7 and 8a gave us some information about the fibrillation mechanisms of cHSA itself and how the QDs can inhibit the cHSA fibril formation. Firstly, cHSA formed oligomers and the size distribution of the oligomers became larger as the incubation time increased from 0 h to 4 h. An explanation for this could be that the fibrillation solution system was heterogeneous so, along with the monomers, self assembled into large oligomers and the oligomers then assembled into protofibrils.37 Secondly, we could see bead-like spheres and some short amorphous curved fibrils next to the spheres of the cHSA-QDs solution at 12 h, as shown in Fig. 7c. Apparently, with the addition of the QDs, the oligomer stage was prolonged, with no mature fibrils being formed after 12 h compared with cHSA without QDs, as shown in Fig. 7a. This shows that the cHSA-QDs stay in the oligomer stage for a longer amount of time, eventually forming fibrils at 96 h (Fig. 7d). Thirdly, accompanied by the kinetic study results shown in Fig. 8b, we could see that with the aggregation of cHSA without a QD solution within the first 4 h of the incubation time, the rate constant (k) of ln(αs) decreased over time by 0.161, which was more than two times that of the cHSA-QDs system (k = 0.075), meaning that the QDs could protect the protein from becoming unfolded and aggregated to some extent.
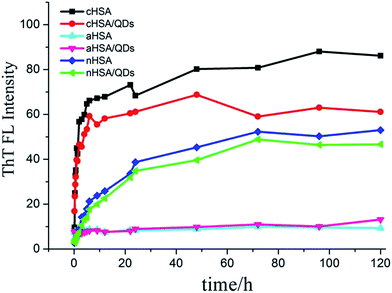 | ||
Fig. 6 Changes in the ThT fluorescence intensity after binding with unfolded HSA variants (10 mg mL−1), incubated in the absence and presence of QDs (2500![[thin space (1/6-em)]](https://www.rsc.org/images/entities/char_2009.gif) : :![[thin space (1/6-em)]](https://www.rsc.org/images/entities/char_2009.gif) 1) at 60 °C after 120 h. 1) at 60 °C after 120 h. | ||
Additionally, to exclude the possibility that the inhibition effect is brought about by excess NAC in the solvent, the effect of NAC alone on the fibrillation of the nHSA solution has also been investigated using ThT fluorescence. NAC was added to 3 mL of the HSA solution, to reach a final molar concentration ratio of NAC/HSA of 15![[thin space (1/6-em)]](https://www.rsc.org/images/entities/char_2009.gif) :
:![[thin space (1/6-em)]](https://www.rsc.org/images/entities/char_2009.gif) 1000 (excess NAC compared with NAC-capped QDs). There exists no consistent regulation of inhibition or acceleration for HSA fibrillation when the molar ratio of NAC/HSA is 3
1000 (excess NAC compared with NAC-capped QDs). There exists no consistent regulation of inhibition or acceleration for HSA fibrillation when the molar ratio of NAC/HSA is 3![[thin space (1/6-em)]](https://www.rsc.org/images/entities/char_2009.gif) :
:![[thin space (1/6-em)]](https://www.rsc.org/images/entities/char_2009.gif) 1000 or 6
1000 or 6![[thin space (1/6-em)]](https://www.rsc.org/images/entities/char_2009.gif) :
:![[thin space (1/6-em)]](https://www.rsc.org/images/entities/char_2009.gif) 1000, as seen from Fig. S5.† Therefore the influence of NAC without QDs on the formation of HSA fibrils is insignificant. No matter if the concentration of NAC is too low or high, it shows adverse laws compared with the QDs/HSA system. This observation indicates that the formation of HSA fibrils is inhibited by the presence of QDs instead of the ligand.
1000, as seen from Fig. S5.† Therefore the influence of NAC without QDs on the formation of HSA fibrils is insignificant. No matter if the concentration of NAC is too low or high, it shows adverse laws compared with the QDs/HSA system. This observation indicates that the formation of HSA fibrils is inhibited by the presence of QDs instead of the ligand.
Conclusions
We carried out a series of studies regarding HSA fibrillation properties after chemical modification. In view of HSA being a carrier of many substances in the blood system, the aggregation and fibrillation inclinations of the different surface charged HSAs have been studied. It shows that the aggregation and fibrillation rates of cHSA are faster than that of nHSA and aHSA. The surface charge of the protein is the decisive factor for protein aggregation itself, and can make a big difference in the interactions between QDs and the protein. This work does not only make it concrete regarding the inhibitory ability of NAC-capped CdTe QDs,22 but has also demonstrated the inhibition effect which happens during the initial aggregation stage, making it difficult to gap the energy barrier for fibril formation. After chemical modification, there is a difference in the extent of fibrillation and the rate of the fibril formation, which can better exemplify the role of the net charge of the protein monomers in protein fibrillation. A heterogeneous system with different diameters in several equilibrium systems among its fibrillation pathway can help us to discriminate that the inhibitory effect of the QDs mainly affects the monomers to make the oligomers form slowly. Several studies may investigate the more explicit mechanism of protein fibrillation in the future (such as the main section of proteins or peptides on proteins, functional groups of proteins and materials, which can better inhibit protein fibrillation from a bio-chemical perspective). These results can also provide us with some more interesting insights when thinking about the stability of nano-carriers after serum proteins have had their surface charges modified.Acknowledgements
The authors gratefully acknowledge the financial support from the National Science Fund for Distinguished Young Scholars of China (Grant No. 21225313), National Natural Science Foundation of China (Grant No. 21473125, 21673166), Hubei Natural Science Foundation of China (No. 3014CFA003) and Wuhan Yellow Crane Talents of Science and Technology Plan, Bagui Scholar Program of Guangxi.Notes and references
- F. Chiti and C. M. Dobson, Annu. Rev. Biochem., 2006, 75, 333–366 CrossRef CAS PubMed.
- J. Hardy and D. J. Selkoe, Science, 2002, 297, 353–356 CrossRef CAS PubMed.
- H. Wilms, L. Zecca, P. Rosenstiel, J. Sievers, G. Deuschl and R. Lucius, Curr. Pharm. Des., 2007, 13, 1925–1928 CrossRef CAS PubMed.
- M. R. Cookson, Annu. Rev. Biochem., 2005, 74, 29–52 CrossRef CAS PubMed.
- C. A. Ross and M. A. Poirier, Nature, 2004, 10, S10–S17 Search PubMed.
- B. Shivu, S. Seshadri, J. Li, K. A. Oberg, V. N. Uversky and A. L. Fink, Biochemistry, 2013, 52, 5176–5183 CrossRef CAS PubMed.
- C. G. Glabe, Neurobiol. Aging, 2006, 27, 570–575 CrossRef CAS PubMed.
- H. Akiyama, S. Barger and S. Barnum, Neurobiol. Aging, 2000, 21, 383–421 CrossRef CAS PubMed.
- R. Wetzel, M. Becker, J. Behlke, H. Billwitz, S. Böhm, B. Ebert and G. Lassmann, Eur. J. Biochem., 1980, 104, 469–478 CrossRef CAS PubMed.
- M. Rezaei-Tavirani, S. H. Moghaddamnia, B. Ranjbar, M. Amani and S. A. Marashi, BMB Rep., 2006, 39, 530–536 CrossRef CAS.
- C. H. Vannoy and R. M. Leblanc, J. Phys. Chem. B, 2010, 114, 10881–10888 CrossRef CAS PubMed.
- M. Roser, D. Fischer and T. Kissel, Eur. J. Pharm. Biopharm., 1998, 46(3), 255–263 CrossRef CAS PubMed.
- L. Treuel, S. Brandholt, P. Maffre, S. Wiegele, L. Shang and G. U. Nienhaus, ACS Nano, 2014, 8(1), 503–513 CrossRef CAS PubMed.
- B. Xie, X. Li, X. Y. Dong and Y. Sun, Langmuir, 2014, 30(32), 9789–9796 CrossRef CAS PubMed.
- S. E. Lohse and C. J. Murphy, J. Am. Chem. Soc., 2012, 134, 15607–15620 CrossRef CAS PubMed.
- Y. Bai, I. Mora-Sero, F. De Angelis, J. Bisquert and P. Wang, Chem. Rev., 2014, 114, 10095–10130 CrossRef CAS PubMed.
- N. Xiong, X. Y. Dong, J. Zheng, F. F. Liu and Y. Sun, ACS Appl. Mater. Interfaces, 2015, 7, 5650–5662 CAS.
- M. Moros, B. Hernáez, E. Garet, J. T. Dias, B. Sáez, V. Grazú, F. A. González, C. Alonso and J. M. Fuente, ACS Nano, 2012, 6, 1565–1577 CrossRef CAS PubMed.
- S. Linse, C. Cabaleiro-Lago, W. F. Xue, I. Lynch, S. Lindman, E. Thulin, S. E. Radford and K. A. Dawson, Proc. Natl. Acad. Sci. U. S. A., 2007, 104, 8691–8696 CrossRef CAS PubMed.
- P. Bernadó, E. Mylonas, M. V. Petoukhov, M. Blackledge and D. I. Svergun, J. Am. Chem. Soc., 2007, 129, 5656–5664 CrossRef PubMed.
- M. Mahmoudi, H. R. Kalhor, S. Laurent and I. Lynch, Nanoscale, 2013, 5, 2570–2588 RSC.
- L. Xiao, D. Zhao, W. H. Chan, M. M. Choi and H. W. Li, Biomaterials, 2010, 31, 91–98 CrossRef CAS PubMed.
- S. Goy-López, J. Juárez and M. Alatorre-Meda, Langmuir, 2012, 28, 9113–9126 CrossRef PubMed.
- R. Sarkar, S. S. Narayanan, L. O. Pålsson, F. Dias, A. Monkman and S. K. Pal, J. Phys. Chem. B, 2007, 111, 12294–12298 CrossRef CAS PubMed.
- L. Fei and S. Perrett, Science, 2009, 10, 646–655 CAS.
- M. Mahmoudi, F. Quinlan-Pluck, M. P. Monopoli, S. Sheibani, H. Vali, K. A. Dawson and I. Lynch, ACS Chem. Neurosci., 2014, 4, 475–485 CrossRef PubMed.
- L. Lai, C. Lin, Z. Q. Xu, X. L. Han, F. F. Tian, P. Mei, D. W. Li, Y. S. Ge, F. L. Jiang, Y. Z. Zhang and Y. Liu, Spectrochim. Acta, Part A, 2012, 97, 366–376 CrossRef CAS PubMed.
- A. L. Rogach, T. Franzl, T. A. Klar, J. Feldmann, N. Gaponik, V. Lesnyak, A. Shavel, A. Eychmüller, Y. P. Rakovich and J. F. Donegan, J. Phys. Chem. C, 2007, 111, 14628–14637 CAS.
- J. Lovrić, H. S. Bazzi, Y. Cuie, G. R. A. Fortin, F. M. Winnik and D. Maysinger, J. Mol. Med., 2005, 83, 377–385 CrossRef PubMed.
- D. Walczyk, F. B. Bombelli, M. P. Monopoli, I. Lynch and K. A. Dawson, J. Am. Chem. Soc., 2010, 132, 5761–5768 CrossRef CAS PubMed.
- L. Treuel, S. Brandholt, P. Maffre, S. Wiegele, L. Shang and G. U. Nienhaus, ACS Nano, 2014, 8, 503–513 CrossRef CAS PubMed.
- L. Shang, L. Yang, J. Seiter, M. Heinle, G. Brenner-Weiss, D. Gerthsen and G. U. Nienhaus, Adv. Mater. Interfaces, 2014, 1 DOI:10.1002/admi.201300079.
- V. N. Uversky, G. Yamin, L. A. Munishkina, M. A. Karymov, I. Millett, S. Doniach, Y. L. Yubchenko and A. L. Fink, Mol. Brain Res., 2005, 134, 84–102 CrossRef CAS PubMed.
- A. Habeeb, J. Immunol., 1967, 99, 1264–1276 CAS.
- W. W. Yu, L. Qu, W. Guo and X. Peng, Chem. Mater., 2003, 15, 2854–2860 CrossRef CAS.
- H. LeVine, Amyloid, 1995, 2, 1–6 CrossRef CAS.
- J. L. Jiménez, E. J. Nettleton, M. Bouchard, C. V. Robinson, C. M. Dobson and H. R. Saibil, Proc. Natl. Acad. Sci. U. S. A., 2002, 99(14), 9196–9201 CrossRef PubMed.
- C. N. Pace, F. Vajdos, L. Fee, G. Grimsley and T. Gray, Protein Sci., 1995, 4, 2411 CrossRef CAS PubMed.
- M. Rezaei-Tavirani, S. H. Moghaddamnia, B. Ranjbar, M. Amani and S. A. Marashi, BMB Rep., 2006, 39, 530–536 CrossRef CAS.
- N. J. Greenfield, Nat. Protoc., 2006, 1, 2527–2535 CrossRef CAS PubMed.
Footnote |
| † Electronic supplementary information (ESI) available: Experimental details for the synthesis of NAC-CdTe QDs and the spectral characterization of NAC-capped CdTe QDs, and some other information for the HSA fibrillation process. See DOI: 10.1039/c6ra20303e |
| This journal is © The Royal Society of Chemistry 2016 |


