Adsorptive desulfurization of dibenzothiophene over lignin-derived biochar by one-step modification with potassium hydrogen phthalate†
Jing-jing Lia,
Hao Zhangab,
Xiao-dong Tang*ab and
Hai Luab
aCollege of Chemistry and Chemical Engineering, Southwest Petroleum University, Chengdu, 610500, P. R. China. E-mail: txda429@163.com; Fax: +86-28-83033079; Tel: +86-28-83033079
bState Key Laboratory of Oil and Gas Reservoir Geology and Exploitation, Southwest Petroleum University, Chengdu, 610500, P. R. China
First published on 3rd October 2016
Abstract
A novel and efficient porous biochar was produced from alkali lignin via a synchronous carbonization/activation process and applied for the adsorption desulfurization of dibenzothiophene (DBT) at ambient temperature. Potassium hydrogen phthalate (KHP) was used as the activator for the first time, with the advantages of the autocatalytic activity of K+ for pore-creation, natural acidity for acid-catalyzed decomposition and surface oxidative modification of the lignin-derived biochar. The highest adsorption efficiency and adsorption capacity of DBT achieved were 98.8% and 33.8 mg S g−1, respectively, with the char yield up to 40 wt%. Analytical techniques such as BET, SEM, FTIR, TG/DTG and Boehm titration were employed and demonstrated that KHP was a promising activator for the highly porous structure and rich surface acidity of biochar. The isotherm data could be well described by the Langmuir model. Finally, the biochar could be regenerated 5 times with over 90% char yield and retain a high adsorption capacity of 29.2 mg S g−1.
1. Introduction
Lignin, which exists as a naturally cross-linked macromolecule and is among the main components of plants, is a versatile and renewable biological resource consisting of phenol hydroxyl groups and phenylpropane units of various types in its molecular structure, and is the second most abundant biological resource in the world next to cellulose.1 However, the pulp and paper industries typically convert only 1% of lignin into valuable industrial products.2 As a result, most of the rest is directly discharged into the environment along with sewage, or burned off after being concentrated, which results in not only a huge waste of valuable resources, but also an appreciably negative effect on the ecological environment. Because of this, the productive utilization of lignin is an important research topic.The use of biochar, derived from lignin, as an adsorbent is a topic of current interest. As is known, solid adsorbents, which rely on π-complexation, have a great application potential in biological waste treatment and contaminant removal.3 These adsorbents include zeolite,4 silicon dioxide,5 mesoporous alumina,6 metal–organic frameworks (MOFs)7 etc. Among these, activated carbons (ACs)8 are an effective and promising adsorbent owing to their convenient preparation, renewable sources, and lack of heavy-metal pollution. The materials most commonly applied for the preparation of ACs include biological or industrial waste, such as sawdust, coconut husk, asphalt, petroleum coke etc.9 However, the high ash content and difficulties in collection as well as post-processing will limit the full utilization of these carbon precursors. As an alternative to biomass of complex composition, lignin, as the main component of biomass, is an ideal precursor for preparing ACs, which shows the evident competitive advantages of a high carbon content, regularly cross-linked structure and stable chemo-catalytic transformation.10
To convert lignin to biochar, it needs to undergo pyrolysis carbonization and chemical activation stages. For chemical activation, raw biochar is firstly impregnated with activators, such as KOH, H3PO4 and ZnCl2, followed by direct pyrolysis to produce original biochar, which lacks acidic groups on the surface. Then, post-oxidation with strong oxidation reagents such as HNO3 and H2O2 is commonly included as the second step in the complete preparation process of ACs. Taking KOH, one of the most widely used activating agents, as an example, the primary activation mechanism can be summarized as follows: K-containing compounds make contact with carbon to release volatiles to form the pore structure and enlarge the surface area, in which the metal K is considered to undergo autocatalysis.11 Typically, KOH activation of biochar results in greatly increased pore volume and surface area, which are beneficial to adsorption capacity, but the surface activity and adsorption forces are limited because acidic groups are disfavored in an alkaline environment. Unfortunately, the two-step production, with its strong corrosive effect, single-function limitations, low-yield production and complicated operation, makes it hard to satisfy the production requirements.
Additionally, lignin-derived biochar has been reported for the removal of heavy metals such as Cr2+ or Cu2+ from wastewater or high-performance supercapacitors,12–14 while a few studies have reported its application for the removal of sulfur-containing compounds in transportation fuels, which has a huge development potential. Although the hydrodesulfurization (HDS) method is widely used in refineries, heterocyclic sulfur compounds such as dibenzothiophene (DBT), which exist in heavier fractions of petroleum and make up about 50–60% of the total sulfur content in diesel, remain difficult to remove. Since the stringent environmental regulations legally require that the maximum sulfur content in vehicle fuel should be no higher than 10 μg g−1 from the year 2009 in Europe and 2018 in China,15 HDS treatment is not an efficient option due to the huge operating cost and the steric hindrance effect inhibiting DBT adsorption;16 besides, it can result in the saturation of olefins and reduction of octane number. Thus, various technologies such as oxidation,17 extraction,18 biodegradation,19 and adsorption desulfurization20 have been proposed as auxiliary desulfurization methods. For example, Long et al.21 reported the oxidative desulfurization (ODS) of DBT by tungsten supported on resin D152 catalysts with oil-soluble cyclohexanone peroxide (CYHPO) as oxidant. Qiu et al.22 chose cheaper and readily available molybdenum supported on medicinal stone catalysts, and the sulfur removal rate reached up to 98%. Nevertheless, ODS required at least two steps of oxidation and extraction separation, so the complex operation inevitably needed toxic reagents and affected the oil yield. Zhao et al.23 mixed three polar solvents, DMAC, DMF and TMS, for extractive desulfurization (EDS) with 5 extraction stages to remove 99% of DBT. However, EDS has thus far failed to avoid the heavy use of chemical reagents. Among the alternatives, adsorption desulfurization (ADS) is an economical and effective technology due to its modest influence on octane number, lack of further chemical requirements, and quality index of the resulting oil, with high yield, high reproducibility, low pollution, low operating cost etc.
With these considerations in mind, lignin-derived biochar was prepared by a one-step carbonization/activation process and used for DBT adsorption. Potassium hydrogen phthalate (KHP) was used for the first time as a chemical activator for the catalytic preparation of a carbon adsorbent with excellent stability and a unique structure containing carboxyl groups, aromatic units and metallic potassium, facilitating the acid-catalytic pyrolysis process, meanwhile introducing a large amount of acidic functional groups via the one-step preparation. The effects of the structural characteristics and the optimal conditions for DBT removal in a batch adsorption system were systematically discussed. Furthermore, isothermal adsorption analysis, regeneration performance and desulfurization tests of real oil were studied. We expect this research to provide a new path to shed light on the role of the unique properties of KHP and its significance in fully utilizing biological resources with high efficiency.
2. Materials and methods
2.1 Chemical materials
Alkali lignin in brown powder form was obtained from Xinyi Fei Huang Chemical Co., Ltd. Dibenzothiophene (DBT, >99%) was bought from Shaoyuan Science & Technology Co. Ltd. Potassium hydrogen phthalate (KHP, AR, 99%), n-heptane (AR, 97%), HCl (AR, 37 wt%) and absolute alcohol (AR, 99.7%) were purchased from Chengdu Kelong Chemical Co., Ltd. Real FCC gasoline (density: 715.8 kg m−3, sulfur content: 91.3 μg g−1) and diesel (density: 810.2 kg m−3, sulfur content: 600.9 μg g−1) were supplied by PetroChina Sichuan Petrochemical Company and Shengma Petrochemical Company, respectively. The water used for washing samples of biochar was ultrapure water from a water purification system. Model diesel fuel for the ADS process was prepared by dissolving DBT in n-heptane with an initial sulfur content of 500 μg g−1. All the chemicals were used without further purification.2.2 Preparation of lignin-derived biochar
In a typical preparation process, the raw lignin was oven-dried overnight at 110 °C before being used. Then, the creation of different types of biochar involved pretreatment by physically mixing KHP with dried lignin at mass ratios of 1![[thin space (1/6-em)]](https://www.rsc.org/images/entities/char_2009.gif) :
:![[thin space (1/6-em)]](https://www.rsc.org/images/entities/char_2009.gif) 1, 2
1, 2![[thin space (1/6-em)]](https://www.rsc.org/images/entities/char_2009.gif) :
:![[thin space (1/6-em)]](https://www.rsc.org/images/entities/char_2009.gif) 1 and 3
1 and 3![[thin space (1/6-em)]](https://www.rsc.org/images/entities/char_2009.gif) :
:![[thin space (1/6-em)]](https://www.rsc.org/images/entities/char_2009.gif) 1 via the wet impregnation method, standing for 12 h and transferring the condensed samples into a muffle furnace.
1 via the wet impregnation method, standing for 12 h and transferring the condensed samples into a muffle furnace.
The reactor was heated at 5 °C min−1 up to the setting temperature (500–900 °C) and the pretreated samples underwent a synchronous carbonization/activation process for 1 h under a nitrogen atmosphere. After being immersed into HCl and vacuum filtered to remove inorganic K-species from the carbon pores, the solid biochars were repeatedly washed with distilled water to neutral pH and finally oven-dried overnight at 110 °C. In this paper, the lignin-derived biochars obtained at 700, 800, 900 °C with the impregnation ratios of 1![[thin space (1/6-em)]](https://www.rsc.org/images/entities/char_2009.gif) :
:![[thin space (1/6-em)]](https://www.rsc.org/images/entities/char_2009.gif) 1, 2
1, 2![[thin space (1/6-em)]](https://www.rsc.org/images/entities/char_2009.gif) :
:![[thin space (1/6-em)]](https://www.rsc.org/images/entities/char_2009.gif) 1, 3
1, 3![[thin space (1/6-em)]](https://www.rsc.org/images/entities/char_2009.gif) :
:![[thin space (1/6-em)]](https://www.rsc.org/images/entities/char_2009.gif) 1 are denoted as LC-1/2/3-700/800/900, respectively, and the mass ratio of KHP to lignin is represented as K/L.
1 are denoted as LC-1/2/3-700/800/900, respectively, and the mass ratio of KHP to lignin is represented as K/L.
2.3 Adsorption desulfurization experiments
The adsorptive desulfurization performance of the lignin-derived biochar was tested by conventional batch experiments. In a typical operation, the model oil was prepared by dissolving DBT in n-heptane (S0 = 500 μg g−1). Then, 0.1 g of biochar was added to the model fuel (10 mL) with magnetic stirring in a 150 mL beaker flask for a desired time under ambient temperature. After that, the adsorbent was filtered to separate it from the desulfurized model oil for the following regeneration experiment. The total sulfur concentrations of DBT before and after desulfurization were analyzed by a WKL-3000 sulfur-chlorine analyzer (Taizhou Guochang Analytical Instruments Co., Ltd.).Additionally, the total sulfur removal (desulfurization efficiency) (D) of the model fuel was calculated following eqn (1):
 | (1) |
The sulfur capacity of the adsorbent (qt) of the model fuel was calculated following eqn (2):
 | (2) |
2.4 Lignin-derived biochar characterization
The surface characteristics of the biochars were recorded with a WQF-520 Fourier transform infrared (FT-IR) spectroscopy instrument (Beijing Beifen-Ruili Analytical Instruments Co., Ltd.) in the 4000–400 cm−1 region using KBr as a reference material to examine the changes of the functional groups on the AC surface. The surface morphological changes and internal pore-structure of raw lignin and the resultant biochars were investigated by a scanning electron microscope (SEM) (Carl Zeiss Co., Ltd.). Transmission electron microscopy (TEM) micrographs were taken with a Libra 2000 (Carl Zeiss, Germany) operating at 200 kV. The specific surface area and micropore distributions of the biochars (LC-1/2/3) were determined by the N2 adsorption–desorption isotherms (BET) at 77 K (US Quantachrome Instruments) with the nonlocal density functional theory (NLDFT) model. Thermogravimetric (TG) and derivative thermogravimetric (DTG) analyses were performed using a TGA/SDTA85 (Mettler Toledo, Switzerland) to provide insight into the intricate thermal-decomposition behavior of the feedstock and biochars.3. Results and discussion
3.1 Characterization of the biochars
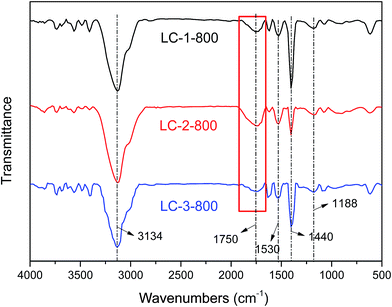
![[double bond, length as m-dash]](https://www.rsc.org/images/entities/char_e001.gif) O and –COOH (1750 cm−1), aromatic C
O and –COOH (1750 cm−1), aromatic C![[double bond, length as m-dash]](https://www.rsc.org/images/entities/char_e001.gif) C (1530 cm−1), –O–CH3 (1440 cm−1) and C–O–C (1188 cm−1), which all existed in the raw lignin, even after high temperature treatment.24 For the modified biochars, the relative intensity at 1750 cm−1 was important for the adsorption performance due to the electron-withdrawing effect of C
C (1530 cm−1), –O–CH3 (1440 cm−1) and C–O–C (1188 cm−1), which all existed in the raw lignin, even after high temperature treatment.24 For the modified biochars, the relative intensity at 1750 cm−1 was important for the adsorption performance due to the electron-withdrawing effect of C![[double bond, length as m-dash]](https://www.rsc.org/images/entities/char_e001.gif) O via electron-donor–acceptor (EDA) interaction.25 When the K/L ratios were increased, the relative intensity of this peak increased from LC-1 to LC-2, while LC-3 had the weakest C
O via electron-donor–acceptor (EDA) interaction.25 When the K/L ratios were increased, the relative intensity of this peak increased from LC-1 to LC-2, while LC-3 had the weakest C![[double bond, length as m-dash]](https://www.rsc.org/images/entities/char_e001.gif) O peak (see the red square), demonstrating that LC-2-800 had the maximum content of C
O peak (see the red square), demonstrating that LC-2-800 had the maximum content of C![[double bond, length as m-dash]](https://www.rsc.org/images/entities/char_e001.gif) O due to the addition of an optimum amount of KHP, while an excess amount of KHP led to the ignition loss of carbon together with the cleavage of –COOH during the pyrolysis process. Moreover, the weakest intensity of the band at 1440 cm−1 was found in LC-2-800, which indicated that the greatest amount of –O–CH3 groups was cracked or transformed in this sample.
O due to the addition of an optimum amount of KHP, while an excess amount of KHP led to the ignition loss of carbon together with the cleavage of –COOH during the pyrolysis process. Moreover, the weakest intensity of the band at 1440 cm−1 was found in LC-2-800, which indicated that the greatest amount of –O–CH3 groups was cracked or transformed in this sample.
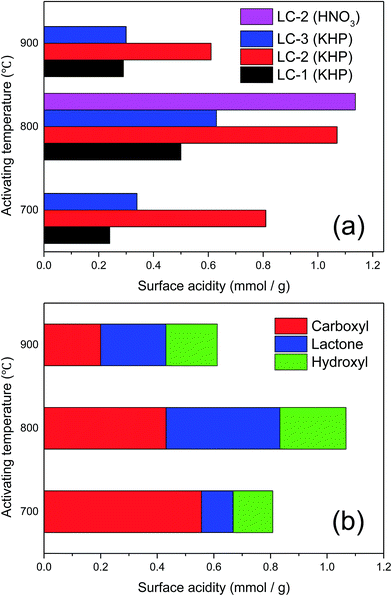
The Boehm titration method was carried out with different alkaline solutions to quantify the acidic oxygen-containing functional groups (–COOH, –COO–, and –OH, etc.), which may lead to a higher connectivity with DBT and exert a positive effect on the sulfur capacity.26 The adsorption desulfurization is based on the Lewis acid–base theory, whereby the thiophene-type sulfides in the fuel oil are classified as Lewis bases, which are easily adsorbed on the Lewis acid center of the adsorbent.27,28 The results are shown in Fig. 2.
As shown in Fig. 2a, an increase in the total content of acidic groups was found to accompany the increase of the activating temperature from 700 °C to 800 °C, whereas at 900 °C, a drastic decrease in the amount of acidic groups occurred because the carboxyl groups were mostly decomposed at excessive temperature (above 800 °C) and the disordered carbon was converted into aromatic structures.29 It was determined that the total surface acidity of the biochar without KHP treatment was very low, only 0.08 mmol g−1, which was much less than that after KHP treatment. Comparing the different amounts of KHP added, LC-2 had the highest total concentration of acidic groups at every temperature. Even compared with HNO3 treatment at 800 °C, the number of acid groups in LC-2 was not much less than that obtained by HNO3 treatment. In Fig. 2b, the different amounts of the main acidic groups of LC-2 at different temperatures are presented. The amount of carboxyl groups decreased with the increasing temperature. The amount of lactone first increased substantially when the temperature was increased to 800 °C and was then reduced by half when the activating temperature rose from 800 °C to 900 °C. Zhou et al.30 found that an oxidized adsorbent could give rise to a greater amount of C![[double bond, length as m-dash]](https://www.rsc.org/images/entities/char_e001.gif) O bonds in acid oxygen-containing groups, leading to better adsorption desulfurization performance. However, LC-2 still had the highest concentration of carbonyl groups, which was consistent with the above results of FT-IR, and the polar groups played a key role in its adsorption ability. In addition to acting as a surface oxidant, KHP can also neutralize the KOH residue in alkali lignin before the activation process: the pH values decreased from 8.8 to 4.9 after the addition of KHP (Table S1†). However, the acidity is not the only factor affecting the desulfurization efficiency. Thus, the additive KHP not only acts as a surface oxidant, but also provides an acidic environment to optimize the surface chemistry for ADS.
O bonds in acid oxygen-containing groups, leading to better adsorption desulfurization performance. However, LC-2 still had the highest concentration of carbonyl groups, which was consistent with the above results of FT-IR, and the polar groups played a key role in its adsorption ability. In addition to acting as a surface oxidant, KHP can also neutralize the KOH residue in alkali lignin before the activation process: the pH values decreased from 8.8 to 4.9 after the addition of KHP (Table S1†). However, the acidity is not the only factor affecting the desulfurization efficiency. Thus, the additive KHP not only acts as a surface oxidant, but also provides an acidic environment to optimize the surface chemistry for ADS.
![[thin space (1/6-em)]](https://www.rsc.org/images/entities/char_2009.gif) :
:![[thin space (1/6-em)]](https://www.rsc.org/images/entities/char_2009.gif) 1. When increasing the dose of KHP, as shown in Fig. 3c, channels with an even size distribution were clearly apparent. These were formed by the thermal cracking of carbon chains in the KHP, which led to an increased and more uniform release of gas due to the self-decomposition and self-carbonization of lignin, which increased the volatilization and improved the formation of rich pores on the surface of the LCs. Fig. 3d shows that introducing an excess of KHP produced a carbon surface covered with numerous irregular and broken pores due to the contraction of the carbon skeleton and shrinkage of the internal microporous regions as the reaction became more violent at higher temperature, leading to the poor adsorption performance and lower product yield. Thus, the optimum additive amount of KHP was necessary for the formation of internal pores.
1. When increasing the dose of KHP, as shown in Fig. 3c, channels with an even size distribution were clearly apparent. These were formed by the thermal cracking of carbon chains in the KHP, which led to an increased and more uniform release of gas due to the self-decomposition and self-carbonization of lignin, which increased the volatilization and improved the formation of rich pores on the surface of the LCs. Fig. 3d shows that introducing an excess of KHP produced a carbon surface covered with numerous irregular and broken pores due to the contraction of the carbon skeleton and shrinkage of the internal microporous regions as the reaction became more violent at higher temperature, leading to the poor adsorption performance and lower product yield. Thus, the optimum additive amount of KHP was necessary for the formation of internal pores.
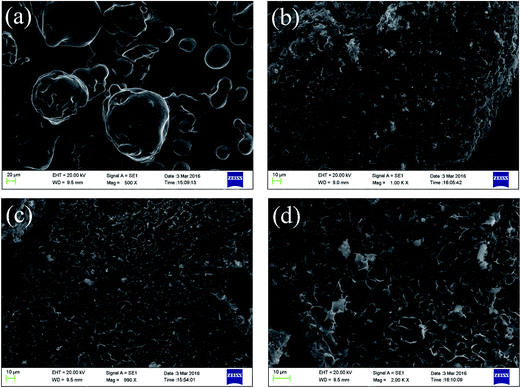 | ||
| Fig. 3 SEM images of raw lignin and lignin-derived biochars with different KHP/lignin mass ratios under activation at 800 °C ((a) lignin, (b) LC-1-800, (c) LC-2-800, (d) LC-3-800). | ||
The specific surface area and in-depth porous structures of the biochar samples (LC-1/2/3) were determined by the N2 adsorption–desorption technique and the pore size distributions were analyzed via the NLDFT model (Table 1). The results showed that LC-2-800 had the largest surface area and highest porosity, and its micropore volume made up more than 60% of the total pore volume, which also provided potential for greatly increasing its adsorption capacity for DBT.
| Samples | SBETa (m2 g−1) | Vtotalb (cm3 g−1) | Vmicro (cm3 g−1) | Vmicro/Vtotal | Dmean (nm) |
|---|---|---|---|---|---|
| a Brunauer–Emmett–Teller.b Nonlocal density functional theory (NLDFT).c Biochar from lignin pyrolysis without KHP treatment. | |||||
| LCc | 49 | 0.023 | 0.004 | 0.174 | 0.11 |
| LC-1-800 | 582 | 0.273 | 0.070 | 0.256 | 2.28 |
| LC-2-800 | 912 | 0.365 | 0.220 | 0.603 | 2.13 |
| LC-3-800 | 723 | 0.330 | 0.120 | 0.364 | 1.98 |
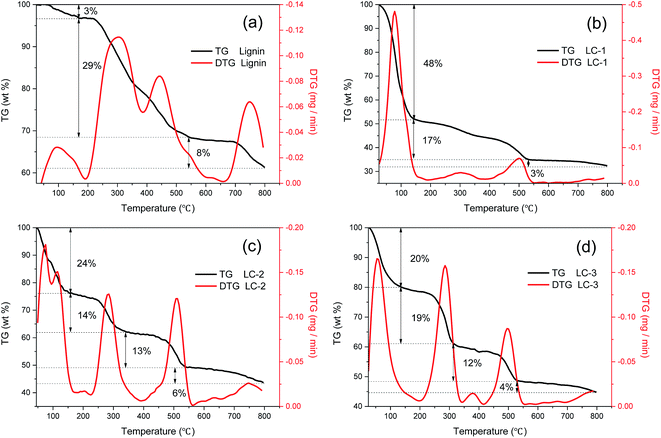 | ||
| Fig. 4 TG and DTG curves of (a) lignin, (b) LC-1, (c) LC-2, (d) LC-3 for the continuous temperature range from 25 °C to 800 °C at a heating rate of 10 °C min−1. | ||
After mixing with KHP, the main decomposition activity clearly occurred at temperatures of 300 °C, 500 °C and 750 °C. The authors of ref. 32 considered that the lignin charring process happened between 150 °C and 500 °C, in which the major release phase of CO2 occurred at 300 °C and that of CH4 at 500 °C. Comparing the DTG peaks at 300 °C of Fig. 4b–d, the peak of LC-3 was much higher than that of LC-2 and LC-1. Combined with the previous results of surface acidity in Fig. 2a and b, this indicated that an overdose of KHP accelerated the release of CO2 at 300 °C, which was caused by thermal cracking of carboxyl and lactone groups. In addition, LC-2 showed the highest pyrolysis rate at 500 °C, which was attributed to the release of CH4, indicating that the cracking and reforming of the –O–CH3 groups of lignin in LC-2 was stronger than that of LC-1 and LC-3. This result was also consistent with LC-2 having the weakest intensity of –O–CH3, as shown in Fig. 1. The increased release of volatiles favored pore-formation. Thus, it can be seen from the above results that KHP plays an important role in catalytic lignin cracking during the charring stage and in promoting pore-forming throughout the process.
3.2 Effects of conditions on adsorption desulfurization
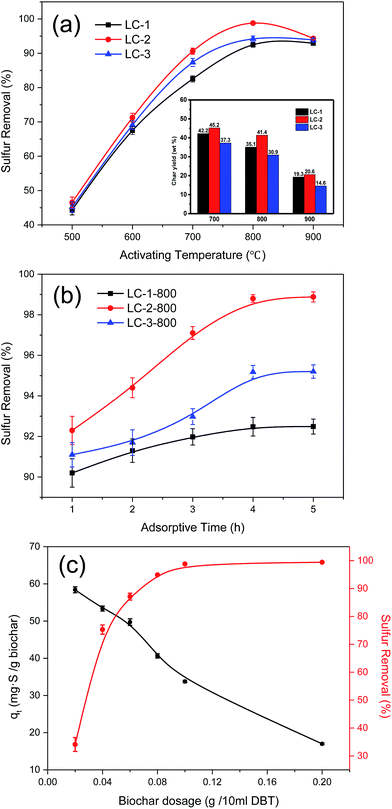
To investigate the optimal conditions for DBT adsorption from the model fuel, some essential factors, such as K/L mass ratio, activating temperature, dosage of biochar, and contact time, were investigated in a series of quantitative and comparative experiments (Fig. 5a–c).3.3 Adsorption isotherms
The theoretical adsorption capacities and interactions between adsorbent and adsorbate of DBT on lignin-derived biochar at different impregnation ratios (Fig. 6) were investigated as the adsorption equilibrium was approached. The sulfur adsorption capacities of LC-2-800 significantly increased from 6.32 to 52.44 mg S g−1 as the initial concentration of sulfur increased from 30 to 800 mg L−1, which means that the greatest driving force was provided by the higher initial concentration of the solution. The Langmuir and Freundlich adsorption equations were used to relate the data. The Langmuir model can be described by eqn (3):
 | (3) |
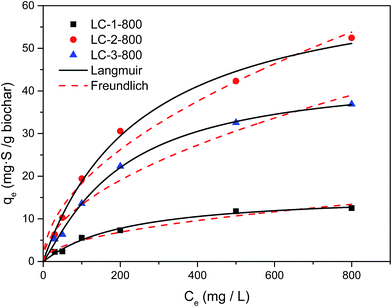 | ||
| Fig. 6 Langmuir and Freundlich isotherms for the adsorption of DBT at different initial concentrations over LC-1/2/3-800 (biochar dose = 0.1 g/10 mL; T = 30 °C; t = 4 h). | ||
The adsorption behavior often fits the empirical expression proposed by Freundlich:38
| qe = kFCe1/n | (4) |
The correlated parameters obtained by nonlinear regression are listed in Table 2. All the values of the correlation coefficient (R2) of the Langmuir model were over 0.9800, and were higher than the corresponding values of Freundlich. The values revealed that the Langmuir adsorption isotherm was more suitable for describing the adsorption characteristics of DBT on lignin-derived biochar and indicated that the adsorption process was more inclined to occur on a monolayer surface. Meanwhile, all the Freundlich constants n were higher than 1, and the all values representing the adsorption capacity qm and kF were highest when LC-2 was used, which was the adsorbent with the largest surface area and the greatest surface acidity, which agreed with the previous experimental data indicating a positive adsorption process. Therefore, these results provide further evidence that a higher surface area is beneficial for the adsorption capacity.
| Samples | Langmuir | Freundlich | ||||
|---|---|---|---|---|---|---|
| qm (mg g−1) | kL (L mg−1) | R2 | kF (mg g−1) | n | R2 | |
| LC-1-800 | 15.9 | 0.0038 | 0.9802 | 0.5 | 2.0708 | 0.9645 |
| LC-2-800 | 67.6 | 0.0037 | 0.9906 | 1.7 | 1.9296 | 0.9786 |
| LC-3-800 | 44.0 | 0.0020 | 0.9965 | 1.2 | 1.9336 | 0.9688 |
3.4 Regeneration of biochar
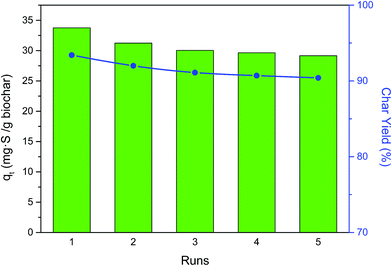
For the long-term application of an adsorbent for pollutant removal, recyclability and sustainability are high priorities. In this paper, the used LC-2-800 was regenerated by heat treatment at 400 °C under N2 atmosphere for 3 h to evaporate the DBT from the micro-pores for the next adsorption run (the boiling point of DBT is 332 °C). Then the biochar was weighed after cooling and the next adsorption experiment was carried out in 10 mL DBT model oil at 30 °C for 4 h. As shown in Fig. 7, the adsorption capacities were 33.75, 31.24, 30.03, 29.65, and 29.16 mg S g−1 biochar for the five rounds of adsorption tests and the char yield was still higher than 90%, which showed that the regenerated biochar still maintained an ideal performance for DBT adsorption.The biochar will inevitably deteriorate in quality after each adsorption experiment because of the separation medium (such as the filter paper) and the cracking of acidic groups on the surface of LCs during high temperature regeneration. To investigate this, Boehm titration was carried out and showed that (as shown in Table S3†) the number of oxygen-containing groups on the surface gradually decreased with the increase of the number of cycles. The loss of quality also weakened the desulfurization effect, but the biochar still had a favorable adsorption capacity (over 29 mg S g−1) compared with other reported adsorbents.35–37 In addition, the surface of the regenerated carbon is mainly microporous in structure (Table 1), and the molecular dynamic diameter of DBT is 0.8 nm.40 It is therefore very difficult to completely evaporate the DBT adsorbed in the micro-pores, which will partially remain in the pores, thus gradually limiting the performance after each cycle. Therefore, the adsorption capacities of the reused biochar decreased, but it nonetheless retained its high efficiency, and the results are satisfactory.
3.5 Adsorption desulfurization for actual gasoline and diesel
The best-performing biochar was also investigated for its adsorptive desulfurization performance of commercial gasoline and diesel. The adsorption tests were similar to the DBT desulfurization, with LC-2-800 as the adsorbent and the biochar dose = 0.1 g/10 mL DBT. The results showed that the sulfur adsorption capacities of LC-2-800 were 4.4 and 30.6 mg S g−1 with the initial sulfur concentrations of 91.3 and 600.9 μg g−1 for the gasoline and the diesel, respectively, both of which were lower than that of the DBT model fuel. This effect can arguably be attributed to the complexity of the compositions of the actual fuels and the powerful hydrophilicity of the oxygenated functional groups on the surface,41 which would greatly affect the selectivity of the adsorbent for sulfur compounds in the oil phase. Further studies will be carried out to explore new efficient and regenerated activated carbons with greater polarity for practical oil desulfurization.4. Conclusions
A series of lignin-derived biochars were synthesized by a one-step carbonization/chemical activation process with potassium hydrogen phthalate (KHP) for DBT adsorption. The KHP-impregnated biochar had much more developed porous properties and higher surface acidity than non-impregnated biochar from lignin. The experimental results showed that a K/L mass ratio of 2![[thin space (1/6-em)]](https://www.rsc.org/images/entities/char_2009.gif) :
:![[thin space (1/6-em)]](https://www.rsc.org/images/entities/char_2009.gif) 1 and activating temperature of 800 °C were the most suitable for DBT adsorption by biochar. The Langmuir model gave the best fit for isothermal adsorption and indicated that a larger surface area was favorable for adsorption. The used biochar could be recycled 5 times with a high adsorption ability.
1 and activating temperature of 800 °C were the most suitable for DBT adsorption by biochar. The Langmuir model gave the best fit for isothermal adsorption and indicated that a larger surface area was favorable for adsorption. The used biochar could be recycled 5 times with a high adsorption ability.
Acknowledgements
This study is financially supported by the Young Scholars Development Fund of Southwest Petroleum University (SWPU, 201131010032). The authors thank the editors and anonymous reviewers for the suggestions on improving this manuscript.References
- S. J. Allen, B. Koumanova, Z. Kircheva and S. Nenkova, Ind. Eng. Chem. Res., 2005, 44, 2281–2287 CrossRef CAS.
- R. B. Santos, P. Hart, H. Jameel and H.-M. Chang, BioResources, 2013, 8, 1456–1477 Search PubMed.
- D. Montané, V. Torné-Fernández and V. Fierro, Chem. Eng. J., 2005, 106, 1–12 CrossRef.
- A. J. Hernández-Maldonado, R. T. Yang and W. Cannella, Ind. Eng. Chem. Res., 2004, 43, 6142–6149 CrossRef.
- J.-H. Shan, L. Chen, L.-B. Sun and X.-Q. Liu, Energy Fuels, 2011, 25, 3093–3099 CrossRef CAS.
- X.-L. Tang and L. Shi, Langmuir, 2011, 27, 11999–12007 CrossRef CAS PubMed.
- N. A. Khan and S. H. Jhung, J. Hazard. Mater., 2012, 237, 180–185 CrossRef PubMed.
- M. Seredych, J. Lison, U. Jans and T. J. Bandosz, Carbon, 2009, 47, 2491–2500 CrossRef CAS.
- P. K. Malik, Dyes Pigm., 2003, 56, 239–249 CrossRef CAS.
- I. Dallmeyer, L. T. Lin, Y. Li, F. Ko and J. F. Kadla, Macromol. Mater. Eng., 2014, 299, 540–551 CrossRef CAS.
- S. Yaman, Energy Convers. Manage., 2004, 45, 651–671 CrossRef CAS.
- Z. Li, Y. Ge and L. Wan, J. Hazard. Mater., 2015, 285, 77–83 CrossRef CAS PubMed.
- E. Gonzalez-Serrano, T. Cordero, J. Rodriguez-Mirasol, L. Cotoruelo and J. Rodriguez, Water Res., 2004, 38, 3043–3050 CrossRef CAS PubMed.
- K. Wang, Y. Cao, X. Wang, M. A. Castro, B. Luo, Z. Gu, J. Liu, J. D. Hoefelmeyer and Q. Fan, J. Power Sources, 2016, 307, 462–467 CrossRef CAS.
- J. Campos-Martin, M. Capel-Sanchez and J. Fierro, Green Chem., 2004, 6, 557–562 RSC.
- A. Ishihara, F. Dumeignil, J. Lee, K. Mitsuhashi, E. W. Qian and T. Kabe, Appl. Catal., A, 2005, 289, 163–173 CrossRef CAS.
- A. Chica, A. Corma and M. E. Dómine, J. Catal., 2006, 242, 299–308 CrossRef CAS.
- X.-D. Tang, Y.-F. Zhang, J.-J. Li, Y.-Q. Zhu, D.-Y. Qing and Y.-X. Deng, Ind. Eng. Chem. Res., 2015, 54, 4625–4632 CrossRef CAS.
- M. Soleimani, A. Bassi and A. Margaritis, Biotechnol. Adv., 2007, 25, 570–596 CrossRef CAS PubMed.
- S. A. Ganiyu, K. Alhooshani, K. O. Sulaiman, M. Qamaruddin, I. A. Bakare, A. Tanimu and T. A. Saleh, Chem. Eng. J., 2016, 303, 489–500 CrossRef CAS.
- Z. Long, C. Yang, G. Zeng, L. Peng, C. Dai and H. He, Fuel, 2014, 130, 19–24 CrossRef CAS.
- L. Qiu, Y. Cheng, C. Yang, G. Zeng, Z. Long, S. Wei, K. Zhao and L. Luo, RSC Adv., 2016, 6, 17036–17045 RSC.
- K. Zhao, Y. Cheng, H. Liu, C. Yang, L. Qiu, G. Zeng and H. He, RSC Adv., 2015, 5, 66013–66023 RSC.
- A. Demirbaş, Energy Convers. Manage., 2000, 41, 633–646 CrossRef.
- M. Kitano, D. Yamaguchi, S. Suganuma, K. Nakajima, H. Kato, S. Hayashi and M. Hara, Langmuir, 2009, 25, 5068–5075 CrossRef CAS PubMed.
- R. B. Fidel, D. A. Laird and M. L. Thompson, J. Environ. Qual., 2013, 42, 1771–1778 CrossRef CAS PubMed.
- S. A. Shahriar, H. Lin and Y. Zheng, Ind. Eng. Chem. Res., 2012, 51, 14503–14510 CrossRef CAS.
- M. A. Larrubia, J. RamìRez and G. Busca, Appl. Catal., B, 2002, 224, 167–178 CrossRef CAS.
- K. Yip, M. Xu, C.-Z. Li, S. P. Jiang and H. Wu, Energy Fuels, 2010, 25, 406–414 CrossRef.
- A. Zhou, X. Ma and C. Song, Appl. Catal., B, 2009, 87, 190–199 CrossRef CAS.
- Q. Liu, S. Wang, Y. Zheng, Z. Luo and K. Cen, J. Anal. Appl. Pyrolysis, 2008, 82, 170–177 CrossRef CAS.
- H. Yang, R. Yan, H. Chen, D. H. Lee and C. Zheng, Fuel, 2007, 86, 1781–1788 CrossRef CAS.
- J. Xiong, W. Zhu, H. Li, W. Ding, Y. Chao, P. Wu, S. Xun, M. Zhang and H. Li, Green Chem., 2015, 17, 1647–1656 RSC.
- J. Xiong, L. Yang, Y. Chao, J. Pang, P. Wu, M. Zhang, W. Zhu and H. Li, Green Chem., 2016, 18, 3040–3047 RSC.
- J. Xiong, W. Zhu, H. Li, L. Yang, Y. Chao, P. Wu, S. Xun, W. Jiang, M. Zhang and H. Li, J. Mater. Chem. A, 2015, 3, 12738–12747 CAS.
- K. A. Cychosz, A. G. Wong-Foy and A. J. Matzger, J. Am. Chem. Soc., 2009, 131, 14538–14543 CrossRef CAS PubMed.
- Y. Shi, X. Zhang, L. Wang and G. Liu, AIChE J., 2014, 60, 2747–2751 CrossRef CAS.
- C. D. Hatch, J. S. Wiese, C. C. Crane, K. J. Harris, H. G. Kloss and J. Baltrusaitis, Langmuir, 2012, 28, 1790–1803 CrossRef CAS PubMed.
- I. Abe, K. Hayashi, T. Hirashima and M. Kitagawa, Colloids Surf., 1984, 8, 315–318 CrossRef CAS.
- D. Jayne, Y. Zhang, S. Haji and C. Erkey, Int. J. Hydrogen Energy, 2005, 30, 1287–1293 CrossRef CAS.
- H. Hui, T. T. Qian, W. J. Liu, J. Hong and H. Q. Yu, Chemosphere, 2014, 113, 175–181 CrossRef PubMed.
Footnote |
| † Electronic supplementary information (ESI) available. See DOI: 10.1039/c6ra20220a |
| This journal is © The Royal Society of Chemistry 2016 |

