Photo-Fenton process in a Co(II)-adsorbed micellar soft-template on an alumina support for rapid methylene blue degradation

Prateeksha Mahamallik and Anjali Pal*
Department of Civil Engineering, Indian Institute of Technology, Kharagpur 721302, India. E-mail: anjalipal@civil.iitkgp.ernet.in; Fax: +91-3222-282254; Tel: +91-3222-281920

Received 5th August 2016 , Accepted 17th October 2016

First published on 17th October 2016


Abstract

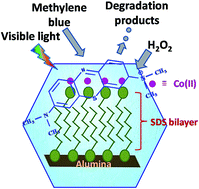
Fenton and Fenton-like processes are versatile and widely applied for organic pollutant degradation. In the present work, a new approach has been made for such a process, where ‘admicellar support’ on alumina has been used to hold the catalyst (in this case Co(II)), as well as the target pollutant methylene blue (MB). In this case, while, both are firmly attached to the layer, the active species, ˙OH radicals, generated from the reaction of Co(II) and H2O2 reacts with MB leading to degradation products in an efficient way. Visible light facilitates the reaction. Effects of various operational parameters such as dose of the catalyst, initial concentration of the dye, H2O2 concentration and light intensity, have been studied. The kinetics followed ‘zero order’ indicating a true ‘surface catalyzed reaction’. Leaching of Co(II) is minimal which is beneficial for real water treatment. The new features of this study are that the degradation of MB is entirely on a solid surface, and monitoring the reaction is done through an extraction method. The degradation products are analyzed by ESI-MS. The turn over number (TON) and turn over frequency (TOF) of the catalyst are found to be 6.82 × 10²⁰ molecules per g and 1.89 × 10¹⁷ molecules per g per second, respectively. The recycling ability of the material is also very good up to the 3rd cycle.


1. Introduction

Homogeneous Fenton and Fenton-like processes are efficient technologies for degradation of organic pollutants.1–6 However, for the traditional homogeneous Fenton process some of the major constraints are (i) limitation in the pH range (pH 2–4); (ii) necessity of separation of iron from the system at the end of the treatment; (iii) chances of surface deactivation due to the formation of complexes or degradation products. These drawbacks have motivated the researchers, throughout the decades, to develop newer heterogeneous catalysts for Fenton and Fenton-like processes. The application of heterogeneous catalysis is attractive because it minimizes the metal ion precipitation and facilitates the recovery of catalyst.

During the past decades, preparation and application of surface-modified heterogeneous catalytic systems has gained popularity, as they show higher efficiency compared to homogeneous systems. Metal particles, in particular, when dispersed on the surface of a support, show much higher catalytic activity and selectivity as compared to bulk particles.7 Currently, heterogeneous Fenton or Fenton-like reactions are used for complete mineralization of pollutants. Thus they have immense applications for the treatment of industrial wastewater. In the past, hydroxyl Fe-pillared bentonite was applied for the catalytic degradation of dye.8 Iron, immobilized on silica support, was also used for phenol degradation using photo-Fenton reaction.9 Carbon based Fe catalyst was used for orange II degradation.10 FeVO4 was reported to be an efficient catalyst for generation of hydroxyl radical in heterogeneous Fenton reaction.11 The degradation of 4-chloro-3-methyl phenol by zero-valent iron nanoparticle by heterogeneous Fenton process was reported by Xu et al.12 Solar Fenton-like reaction using Fe-zeolite was performed by Gonzalez-Olmos et al.13 Ion exchange technique was applied to prepare zeolite Y–Fe catalyst for carrying out Fenton reaction on orange II.14

Iron, as Fenton catalyst, is advantageous because of its low toxicity and large abundance. Both Fe2+ and Fe3+ are highly reactive. Nevertheless, the requirement of strict acidic condition, to prevent iron precipitation, has been the main hindrance for its practical application in advanced oxidation processes. This prompted the researchers to find out suitable alternatives such as non-ferrous Fenton catalysts.15 For example, cerium was applied for Fenton-like reaction in the presence of hydrogen peroxide.16 But toxicity of cerium toward aquatic life restricts its practical application. Copper was also considered as an alternative catalyst for Fenton-like reaction.17,18 Although, unlike the Fe-based system, there is no surface poisoning in case of Cu-Fenton-like reaction, yet it has some disadvantages. In the presence of air, Cu+ is oxidized to Cu2+ in acidic and near neutral condition which decreases the availability of Cu+. As a result, the reaction between Cu+ and H2O2 to produce hydroxyl radical is substantially inhibited. So, in such type of aerobic water treatment technologies excess H2O2 has to be provided to counteract the oxygen present in air to make the reaction irreversible. Thus the process becomes costly due to excessive utilization of H2O2. The efficiency is also declined because of the scavenging of hydroxyl radicals. Chromium is another option for Fenton-like reaction. It has various oxidation states and it can act efficiently in both acidic and neutral conditions.19,20 But chromium is extremely toxic. Thus chromium-based Fenton type catalyst might only be considered for the treatment of the wastewater contaminated with chromium. Among the other transition metal catalysts, ruthenium is the only member of the platinum group that shows Fenton-like activity. But ruthenium is costly. So it may not have practical applications. Again, azo dye methyl orange was degraded through heterogeneous photo-Fenton-like process using single-phase akaganeite nanoparticle (β-FeOOH) prepared by ultrasound-microwave assisted method.21 Xu et al. reported the heterogeneous photo-Fenton process for the removal of methyl orange from water by the prepared TiO2/hydroniumjarosite photocatalyst under UV light irradiation.22 Cobalt is another alternative for Fenton-like reaction. Among the several transition metals studied in the past, cobalt ions (Co2+) showed very good activity for photo-degradation under visible light. Most importantly, cobalt can work efficiently in neutral pH condition. In the past, Co2+ loaded periodic mesoporous aluminum phosphate (PMAP) was utilized, as heterogeneous catalyst, for the decomposition of phenol.23 Co–TiO2 was successfully synthesized and was applied for the degradation of rhodamine-B through Fenton-like reaction.24 Cobalt oxide catalyst was immobilized on graphene oxide and it was applied for the removal of orange-II from water.25 Nanosized Co3O4/SiO2 system was used for the degradation of phenol.26

Heterogeneous Fenton reaction has two phases, viz., adsorption and degradation. However, in most cases, the chances and extent of adsorption, and its influence on degradation were ignored. Here we have utilized the adsolubilization concept in photo-Fenton type of reaction. ‘Adsolubilization’ is an efficient phenomenon that can be used for the removal of organic and inorganic pollutants. It is a process where surfactant bilayer (admicelle) is formed on the solid support, and the organic molecules or metal ions are adsorbed/solubilized in the admicellar surface. Surfactant-modified alumina and silica has been the two commonly used templates for adsolubilization. In the past years, we have demonstrated that surfactant-modified alumina (SMA) can act as an excellent adsorbing system for cationic dyes such as malachite green and crystal violet.27,28 The potentiality of SMA for metal ion (viz., Mn(II), Ni(II) and Cu(II)) removal is also established very recently.29,30 In a report we have also shown how adsolubilization concept can be used for the fabrication of heterogeneous material to achieve better catalytic effect on 4-nitrophenol reduction by borohydride.31 In the present work, a similar approach has been undertaken, for the first time, to attach Co(II) to SMA surface. It has been observed that SMA can accommodate Co(II) in a more efficient way compared to normal Al2O3. The Co(II) loaded surfactant-modified alumina (designated as Co-SMA) is our heterogeneous surface to bring out the Fenton process. The additional advantage of the presence of the admicellar surface on SMA is that, it has the capability to accommodate methylene blue (MB), a model cationic dye, efficiently. Thus our aim was to study the degradation of MB by photo-Fenton process, in fully adsorbed state, and co-existing with Co(II) on Co-SMA surface. It was our interest to see whether the admicellar layer can act as a soft-template to host the reactants, and facilitate the MB degradation. To the best of our knowledge, this is the first report of dye degradation by photo-Fenton process, while it is fully adsorbed in admicellar surface.

2. Materials and methods

2.1 Chemicals

Alumina was obtained from SRL, India. Sodium dodecyl sulfate (SDS; mol. wt 288.38 g mol−1), glacial acetic acid, methylene blue as chloride salt (MB; mol. wt 319.85 g mol−1), cobalt chloride hexahydrate (mol. wt 237.93 g mol−1) and hydrogen peroxide (30%) were purchased from Merck. Acridine orange was obtained from Loba chemicals. Terephthalic acid and titanium(IV) oxysulfate sulfuric acid hydrate were purchased from Aldrich.

2.2 Instrumentation

UV-vis spectrophotometer (SPECTRASCAN UV 2600, Chemito, India) was used to measure the absorbance with a 1 cm well stoppered quartz cuvette. Field Emission Scanning Electron Microscopy (FESEM) analysis was carried out using a microscope (Supra 40, Carl Zeiss Pvt. Ltd, Germany). Magnetic stirrer (Tarsons) was used for stirring purpose. The source of visible light was a normal bulb (Philips; 40–200 W). To know the stretching and bending vibration frequencies of alumina, SDS, SMA and Co-SMA, the analyses were performed using FTIR instrument (PerkinElmer). Atomic absorption spectrometer (AA240FS) with an acetylene flame was used for cobalt determination. XPS analysis was performed in PHI 5000 Versa ProbeII (ULVAC – PHI, INC, Japan) with a microfocused (100 μm, 25 W, 15 kV) monochromatic Al-Kα source ( = 1486.6 eV), a hemispherical analyzer and a multichannel detector. Luxmeter (Lutron LX-101) was used to measure the light intensity. The MS analyses of the reaction mixture were carried out in the mass spectrometer (WATERS, USA). The ionization mode preferred was ESI+-MS because water was the solvent. Detection of hydroxyl radical in reaction system was carried out by Cary Eclipse fluorescence spectrophotometer (Agilent). Diffusive reflectance spectra (DRS) were recorded using Cary model 5000 UV-vis NIR spectrophotometer.

2.3 Preparation of the material

2.3.1 Preparation of surfactant-modified alumina. Surfactant-modified alumina (SMA) was prepared by following the method described earlier.27–30 The detail procedure is as follows: 20 g of sodium dodecyl sulfate (SDS) was dissolved in 900 mL of distilled water. Sodium chloride (2.5 g), dissolved in 100 mL of distilled water was added to the SDS solution. The pH of the mixture was adjusted to ∼4.5. Then 100 g of alumina was added to it and was shaken for 24 h at 150 rpm and 30 °C. The supernatant was collected and the concentration of SDS was determined using the calibration equation of SDS (the detail procedure is described in Section 2.3.2). The alumina, thus obtained as the solid settled at the bottom, was designated as surfactant-modified alumina (SMA). The prepared SMA was washed with distilled water and dried in an oven at 60 °C (12 hours). Then the material was collected and stored in an airtight bottle under ambient condition. The prepared SMA was loaded with cobalt in the next step, and used further as a catalyst for MB degradation.
2.3.2 Determination of SDS loading on Al2O3. The calibration of SDS was performed following the method reported earlier.32 To construct a calibration curve, acridine orange (5 × 10⁻³ M, a cationic dye) and glacial acetic acid were added to the different SDS solutions having known concentration in the range of 0–5 mg L−1. Acridine orange acted as an ion-pairing agent with SDS. The complex was extracted in toluene. Finally, the absorbance of the toluene layer was measured at 467 nm after phase separation. The absorbance value at 467 nm was proportional to the SDS concentration. The calibration equation was: absorbance = 0.2 × conc. (mg L−1) + 0.008 (R2 = 0.987). The SDS concentration remaining in the supernatant after SMA preparation was measured using the calibration equation. From the mass balance method the loading of surfactant was found to be 115.5 mg (0.4 × 10⁻³ mole) per gram of alumina.
2.3.3 Preparation of Co-SMA and Co-alumina. A stock solution of cobalt (CoCl2·6H2O) with concentration 100 mg L−1 was prepared in distilled water. Then 3 g of SMA was added to 50 mL of this solution, and kept for required time under ambient condition, with occasional hand shaking. After maximum adsorption (which takes ∼4 h), the supernatant was collected to find out the remaining concentration of cobalt. The Co(II) loaded SMA was washed thrice with distilled water. Then it was dried in an oven at 60 °C (4 h). The dried material (designated as Co-SMA) was collected and kept in an airtight bottle. Using the same procedure cobalt loading was also done on normal Al2O3. The material was called as Co-alumina.
2.3.4 Determination of cobalt loading on alumina and SMA. Concentration of cobalt remaining in solution after its adsorption on alumina and SMA was measured using AAS and loading of cobalt on alumina and SMA was calculated. The loading of cobalt on alumina and SMA was found to be 0.205 mg g−1 (3.47 × 10⁻⁶ mol g−1) and 1.38 mg g−1 (2.34 × 10⁻⁵ mol g−1), respectively.

2.4 MB degradation

2.4.1 Experimental procedure for MB degradation on Co-SMA. Basically, there were two distinct steps involved in the degradation process. The first step was the adsolubilization of MB dye on Co-SMA; and the second one was the degradation of adsolubilized MB by H2O2 and visible light. Adsolubilization of MB was achieved by stirring MB solution (10 mL at desired concentration) with Co-SMA (at a particular dose) for 30 min under ambient condition. The desired concentration of MB was prepared by diluting the stock solution having the concentration 100 mg L−1. After the complete adsorption of MB on Co-SMA, the whole mixture (both the solid as well as the supernatant) was degraded using photo-Fenton process. The degradation was carried out in a glass beaker in the presence of H2O2 and visible light (normal table lamp). The experimental set-up is shown in Fig. S1. The distance of the top surface of the reaction mixture from the light source was ∼15 cm, and the depth of the reacting solution was ∼1.5 cm. The concentrations of MB present in the degraded samples were monitored time to time.
2.4.2 Determination of MB degradation efficiency. To measure the dye concentration present in solid phase (as it was observed that, throughout the entire time period of reaction no dye was released in water medium), the whole reaction mixture (both the solid and the liquid phase) was extracted in 1-butanol (an appropriately chosen water immiscible organic solvent), and finally the absorbance at λmax: 657 nm was measured in the organic solvent.

As the MB concentration was measured through the extraction process, it was important to know the efficiency of 1-butanol to extract MB, while it was present in the Co-SMA surface and the water medium. The extraction efficiency was judged by comparing the two separate calibration curves of MB (in the range of 0–20 mg L−1); the first one was the calibration of MB dissolved in 1-butanol (i.e. without extraction), and the second one was the calibration curve of MB after it was adsolubilized on Co-SMA followed by its extraction in 1-butanol (from H2O/solid mixture). Thus for the second calibration curve 10 mL MB solutions in the concentration range 0–20 mg L−1 was taken in separate vials. To each of them, Co-SMA was added at 20 g L−1 dose and kept standing for 30 min. It was observed that the whole amount of MB was adsolubilized on the Co-SMA surface making it deep blue in color. After the MB got fully adsolubilized, the whole mixture (solid along with the water part) was extracted with 1-butanol (10 mL). Finally, the calibration curve was generated and compared with the first one (i.e. without extraction). Both the calibration curves were straight line and the correlation coefficients (R2) were 0.999 and 0.972 for the first and second one, respectively. The equations were represented as: absorbance = 0.078 × conc. (mg L−1) + 0.059 (without extraction), and absorbance = 0.078 × conc. (mg L−1) + 0.138 (after extraction) for the two described cases. The reproducibility of the extraction was also tested from 5 sets of experiments. In that experiment 10 mL of MB solutions having concentration 10 mg L−1 was adsolubilized on 0.2 g of Co-SMA, and finally extracted in 10 mL of 1-butanol. The relative standard deviation was ±2.2%.

The absorbance of MB extracted in 1-butanol was monitored at λmax: 657 nm using a UV-visible spectrophotometer. Concentration of the dye was calculated using the calibration equation: absorbance = 0.078 × conc. (mg L−1) + 0.138. The dye decolorization was calculated as follows.

Dye decolorization (%) = {(C0Ct)/C0} × 100
where, C0 = concentration of MB at zero time of reaction; Ct = concentration of MB at time t.

2.4.3 Determination of H2O2 decomposition. H2O2 decomposition in the presence of Co-SMA and visible light was monitored by spectrophotometric method.13,33 Titanium(IV) oxysulfate sulfuric acid hydrate solution was prepared by dissolving 0.25 g of titanium(IV) oxysulfate sulfuric acid hydrate in 100 mL of water and 15 mL of H2SO4. In each measurement, 1 mL of reaction mixture was taken and diluted 10 times. Then 20 μL of diluted sample was added to 2 mL of titanium(IV) oxysulfate solution for measurement of absorbance. The titanium(IV) salt solution reacted with the remaining hydrogen peroxide to form a titanyl complex which was yellow in color having λmax at 410 nm.

3. Results and discussion

3.1 Adsorption of Co(II) on SMA surface

It is already established that when SDS solution is added to alumina, under acidic conditions (pH ∼4–5), the SDS molecules get adsorbed on the alumina surface to form either hemimicelle (at SDS concentration < CMC) or admicelle (at SDS concentration > CMC). The solubilizing property of these micellar layer can be utilized to host several organic molecules27,28,34 or metal ions,29,30 at a much higher capacity.

The idea of the present study was to observe the synergistic performance of such a system, where the metal ion and the dye co-exist in the surfactant bilayer in fully adsorbed state, and react with the hydrogen peroxide in Fenton process. The soft-template, formed on the alumina surface, may thus provide some excellent environment for the reaction. Our earlier studies have shown how the micro-heterogeneous micellar structure could enhance the reduction rate of MB by arsine gas.35 The catalysis in heterogeneous solid surface and in micellar environment may lead to interesting phenomenon. Such an attempt is new, especially, in Fenton process. The system was judiciously selected where both metal ion and cationic dye may have better adsorption in terms of capacity and stability. Based on our earlier studies, SMA was selected as a suitable substrate for such applications. Here our selected metal ion was Co(II), which was proved to be effective for Fenton process. Thus, the involvement of visible light to enhance the performance was also noticed. The schematic for Co(II) adsorption on the SMA surface is shown in Fig. 1. The procedure of Co-SMA preparation was simple and the material was stable for years even at ambient condition. It was encouraging to note that the MB degradation performance was the same (within ±3%) with the freshly prepared and 1 year old samples of Co-SMA. The stability of the material in solution phase was also commendable. That was because Co(II) got adsorbed on SMA by electrostatic interaction between negatively charged dodecyl sulfate anion and positively charged cobalt ion (Fig. 1). This Co-SMA material was our catalyst for heterogeneous Fenton-like reaction to degrade MB.


image file: c6ra19857k-f1.tif
Fig. 1 Schematic for the preparation of Co-SMA.

To find out the time required for optimum Co(II) adsorption on SMA surface, a kinetic study was performed (Fig. 2). It was observed that during the initial period, the rate was much faster, and ∼67% removal of Co(II) occurred in the initial 50 min. However, 240 min time was selected as the optimum time to prepare Co-SMA as because in this time period the removal of Co(II) almost reached the highest value.


image file: c6ra19857k-f2.tif
Fig. 2 Kinetics of adsorption of Co(II) on SMA surface.

In the present work the Co(II), embedded on SMA, was acting as the catalyst for Fenton process; hence it was felt pertinent to compare, the efficacy of SMA to adsolubilize Co(II), with that of normal alumina. As expected, similar to our earlier studies carried out for other metal ion removal,29,30 the SMA showed much higher adsorption capacity (>6 times) for Co(II) as compared to that of alumina (Fig. S2). Under similar experimental conditions, the loading of cobalt on alumina and SMA was found to be 0.205 mg g−1 (3.47 × 10⁻⁶ mol g−1) and 1.38 mg g−1 (2.34 × 10⁻⁵ mol g−1), respectively. It is worth noting that the relative proportion (mol/mol) of SDS/cobalt on SMA was ∼17[thin space (1/6-em)]:[thin space (1/6-em)]1.

3.2 Characterization of Co-SMA

3.2.1 Scanning electron microscopy (SEM). Scanning electron microscopy (SEM) analyses of SMA and Co-SMA were performed to have an idea about the surface topography and composition of the material. SEM images of SMA and Co-SMA are shown in Fig. 3(a) and (b), respectively. The surface in both the cases was rough. The EDAX of Co-SMA confirmed the incorporation of cobalt on SMA (0.22% by weight) (Fig. 3c).
image file: c6ra19857k-f3.tif
Fig. 3 SEM images of (a) SMA, (b) Co-SMA, and (c) EDAX of Co-SMA.
3.2.2 Fourier transform infrared (FTIR) study. FTIR analysis was carried out for alumina, SDS, SMA and Co-SMA. The spectra are shown in Fig. 4a–d, respectively. In Fig. 4a, the band at 570 cm−1 designates the stretching vibration of Al–O.36 The peak at 1630 cm−1 is assigned to the surface water on alumina.36 The broad absorption peak in the range of 3410–3465 cm−1 corresponds to –OH group, indicating the existence of the hydroxyl groups on the surface. The band at 1230 cm−1, in Fig. 4b, is due to the stretching vibration of S–O bond present in sulfate group of SDS.37 The peak at 3470 cm−1 designates H–OH stretching. The band at 1075 cm−1 indicates the C–C stretching, and 827 cm−1 and 588 cm−1 band correspond to asymmetric C–H bending of CH2 group.37 The bands present in Fig. 4c and d are already described. Those are characteristic bands of alumina and SDS. From this study it is clear that, SDS is present in the prepared material.
image file: c6ra19857k-f4.tif
Fig. 4 FTIR spectra of (a) alumina, (b) SDS, (c) SMA, (d) Co-SMA.
3.2.3 Diffusive reflectance spectra (DRS) analysis. The DRS of alumina, SMA and Co-SMA are shown in Fig. 5. The incorporation of cobalt in SMA is supported by the absorption peak appeared at ∼560 nm in the DRS of Co-SMA (Fig. 5).38,39
image file: c6ra19857k-f5.tif
Fig. 5 DRS of alumina, SMA and Co-SMA.
3.2.4 X-ray photoelectron spectroscopy (XPS). Elemental composition of surface of Co-SMA is identified by XPS analysis. In the wide range XPS (Fig. 6a) of the Co-SMA, the peak appearing at 529.6 eV is of the O1s spectrum and it can be attributed to the O2− ions.39 The binding energy of Al2p at 74.4 eV is attributed to Al3+ (oxide)40 and the peak noticed at 283.2 eV designates C1s. Two major peaks are found from the XPS of cobalt (Fig. 6b), situated at 780.5 eV and 796.25 eV representing Co2p3/2 and Co2p1/2. By deconvoluting the spectra, other two satellite peaks are found at 785.67 eV for 2p3/2 component and at 801.62 eV for 2p1/2 component due to the coupling between the multielectrons present in Co2+.41
image file: c6ra19857k-f6.tif
Fig. 6 XPS spectra of Co-SMA. (a) Wide range mode, (b) Co2p.

3.3 Adsorption of MB on Co-SMA surface and its degradation

As our aim was to study the efficacy of MB degradation by Fenton reaction occurring within the admicelle supported on alumina, it was necessary to study the adsolubilization of MB on SMA surface. MB being a cationic dye is expected to be readily adsorbed on the negatively charged Co-SMA surface. The kinetics of adsorption (both in terms of removal percentage and adsorption capacity), in the entire range of MB concentration (10–30 mg L−1) is shown in Fig. 7. For this study, the Co-SMA dose selected was 20 g L−1. The SMA was allowed to remain in contact with MB solution (10 mL), under ambient condition, with stirring. The SMA immediately turned to blue indicating that MB was adsorbed on the surface of Co-SMA. It was observed that maximum (almost 100%) adsorption occurred within the first 10 min. However, 30 min time was selected as the ‘contact time’ to get the MB in fully adsolubilized state. Such a fast adsorption of dye is beneficial for its practical real field application. The qe values for MB adsorption, in case of 10 mg L−1, 20 mg L−1 and 30 mg L−1 of MB concentration, on Co-SMA (at a dose of 20 g L−1) were found to be 0.498 mg g−1 (1.56 × 10⁻⁶ mol g−1), 0.989 mg g−1 (3.09 × 10⁻⁶ mol g−1) and 1.482 mg g−1 (4.63 × 10⁻⁶ mol g−1), respectively (Fig. 7). Thus in case of 10 mg L−1 initial concentration of MB, the relative concentration ratio (in terms of mole) of SDS[thin space (1/6-em)]:[thin space (1/6-em)]Co(II)[thin space (1/6-em)]:[thin space (1/6-em)]MB per gram of catalyst was 0.4 × 10⁻³[thin space (1/6-em)]:[thin space (1/6-em)]2.34 × 10−5[thin space (1/6-em)]:[thin space (1/6-em)]1.56 × 10−6.
image file: c6ra19857k-f7.tif
Fig. 7 Kinetics of adsolubilization of MB on Co-SMA surface at different initial concentrations.

In contrast to this, on alumina surface, the adsorptive removal of MB was very less (∼5% in 1 h time for all three concentrations). This is because there was no surfactant bilayer present on the alumina surface to host MB. This says again why SMA is beneficial compared to normal alumina to study the Fenton process of degradation with the cationic dye MB, as a model.

The adsorption of MB was further confirmed from the UV-vis DRS of the MB-adsorbed Co-SMA (Fig. 8a), when the characteristic peaks of MB at λmax at ∼658 nm was clearly visible. It is also interesting to observe that during the course of reaction no new peak was developed in the Co-SMA surface indicating that the products are desorbed and released in to the solution.


image file: c6ra19857k-f8.tif
Fig. 8 (a) DRS of MB in Co-SMA during the course of reaction, (b) absorption spectra of MB during the course of reaction after its extraction from Co-SMA surface.

Additionally the monitoring of MB degradation during the course of reaction was also possible by visible absorption spectroscopy, after its extraction in 1-butanol (Fig. 8b).

3.4 Kinetics of degradation of MB in different systems

Degradation of methylene blue (MB) was carried out under various experimental conditions with different combinations, i.e. MB + Visible light (VL), MB + VL + H2O2, MB + VL + Alumina, MB + H2O2 + Alumina, MB + VL + H2O2 + Alumina, MB + VL + SMA, MB + H2O2 + SMA, MB + VL + H2O2 + SMA, MB + VL + Co-SMA, MB + H2O2 + Co-SMA and MB + VL + H2O2 + Co-SMA. As shown in Fig. 9, out of all these combinations, only MB + H2O2 + Co-SMA and MB + VL + H2O2 + Co-SMA system were able to degrade MB. In all the systems where alumina or Co-SMA was used, MB was first allowed to get adsorbed on the solid surface. In case of alumina, for 10 mg L−1 of MB concentration, the adsorption efficiency was very less (∼5%), whereas, at higher concentration (30 mg L−1, 100 mg L−1) MB did not get adsorbed (∼1.2%). But for Co-SMA, the adsorption of MB was very high (∼100%) at both the concentrations mentioned above. As because in heterogeneous catalysis, adsorption step is a prerequisite, this adsolubilization step may lead to higher catalytic efficiency. It is notable that in the present case, both Co(II) and MB are embedded in admicelle, and this provides them a better contact. After adsorption of MB, i.e. after 30 min, the reaction was allowed to start by adding the reagent H2O2 in the reaction medium. The combination for this was designated as MB + H2O2 + Co-SMA. The degradation of MB was ∼68% in one hour (Fig. 9). However, the same system if irradiated with visible light (i.e. the combination is MB + VL + H2O2 + Co-SMA) the efficiency achieved was much higher (∼97.4%) in one hour (Fig. 9). So MB + VL + H2O2 + Co-SMA operational condition was considered to proceed further. The reason behind the increased efficiency under visible light illuminated condition is possibly because Co(III) to Co(II) conversion (which is essential for our Fenton-like process) is facilitated by the visible light.42 At this point it may be mentioned that although the dose of SMA look rather high (20 g L−1) but the actual catalyst i.e. Co(II) present is quite low (27.6 mg L−1). This is because the loading of Co(II) on SMA is low (1.38 mg g−1).
image file: c6ra19857k-f9.tif
Fig. 9 Kinetics of degradation of MB under different conditions (initial conc. of MB: 10 mg L−1; catalyst dose: 20 g L−1; light intensity: 10[thin space (1/6-em)]010 lux; conc. of H2O2: 348.8 mM).
3.4.1 Decolorization of methylene blue on Co-SMA surface by photo-Fenton process under various operational conditions. Effect of various operational parameters (i.e. initial MB concentration, catalyst dose, H2O2 concentration, light intensity etc.) on the decolorization of adsolubilized MB was studied in detail under the selected condition (i.e. MB + VL + H2O2 + Co-SMA). In all cases, the reaction followed zero order, which depicts a true surface catalyzed reaction. In heterogeneous catalysis, three main reaction mechanisms were proposed. These are Langmuir–Hinshelwood,43 Eley–Rideal,43 and Mars–Van Krevelen.44 In the Langmuir–Hinshelwood mechanism, the two reacting species are adsorbed on the catalyst surface before the reaction takes place. Surface diffusion facilitates interaction between adsorbed molecules. Finally, the reaction product desorbs from the surface. In case of Eley–Rideal mechanism, only one of the reactants is adsorbed on to the surface, after which the other reactant interacts with the adsorbed species directly from the solution phase. This is followed by desorption of the reaction products. According to Mars–Van Krevelen mechanism, the surface itself is an active part of the reaction. One reactant forms a chemical bond with the catalyst surface. The other reactant now reacts directly from the solution phase with the chemically bonded reactant on the surface.

Photo-Fenton degradation of MB in this study is proposed to follow Langmuir–Hinshelwood mechanism. The adsolubilized MB reacts with the adsorbed radical formed in presence of Co(II) and H2O2 on Co-SMA surface. The Langmuir–Hinshelwood kinetic model is generally expressed as follow:

 
image file: c6ra19857k-t1.tif(1)
where C represents the concentration (mg L−1) in solution of the molecule being degraded (i.e. MB), kr is the reaction rate constant (mg L−1 min−1) and Ke (L mg−1) is the equilibrium constant for the adsorption of the molecule on the catalyst surface at the reaction temperature. The term krKe is combined and represented as kapp (min−1). So eqn (1) can be represented as
 
image file: c6ra19857k-t2.tif(2)

If KeC ≪ 1, then eqn (2) can be expressed as first order equation

 
image file: c6ra19857k-t3.tif(3)

But if KeC ≫ 1, then eqn (2) becomes zero order equation

 
image file: c6ra19857k-t4.tif(4)

Thus zero order kinetics indicates that, the active sites are substantially covered by the organic molecule.45 There are evidences of Langmuir–Hinshelwood mechanism following zero order kinetics. Liang et al. reported19 zero order kinetics in case of Langmuir–Hinshelwood mechanism describing that the instantaneous adsorbed amount of pollutant (MB) on solid surface (chromium substituted magnetite) was almost constant. Shukla et al. described26 the formation of SO4˙ as the slowest step in degradation of phenol by Co/SiO2 catalyst, which was the explanation for zero order kinetics.

In the system considered for the present work, both the adsolubilized MB and Co(II) were firmly embedded on the SMA surface. When hydrogen peroxide was added to the reaction mixture, it reacted with Co(II) and produced hydroxyl radical and Co(III) (eqn (5)). As soon as the hydroxyl radical was produced, it oxidized the SMA-adsorbed MB in a fast way (eqn (9)), and finally the degraded products were released from the solid surface (eqn (10)). In between there were several other steps (eqn (6)–(8)), which take place during the photo Fenton process. The pictorial presentation of MB degradation on Co-SMA surface is shown in Fig. 10. In our case the MB degradation followed the zero order kinetics, which could be interpreted in terms of the relative rates at which the reactive oxygen species (ROS), such as ˙OH radicals, are formed and consumed. It can be speculated that the production of hydroxyl radical is much slower compared to its consumption. So the rate of degradation of MB, finally, only depended on the rate of ROS formation. The slower step (or steps) did not involve MB. That is why the reaction followed zero order with respect to MB. The possible step-wise mechanism is shown in eqn (5)–(10):

 
Co2+ (adsorbed on SMA) + H2O2 → Co3+ + OH + ˙OH (slow) (5)
 
Co3+ + H2O2 → Co2+ + HOO˙ + H+ (6)
 
Co3+ + H2O + visible light → Co2+ + ˙OH + H+ (7)
 
˙OH + H2O2 → H2O + HOO˙ (8)
 
˙OH + MB → products (fast) (9)
 
Products → released from the SMA surface (10)


image file: c6ra19857k-f10.tif
Fig. 10 Pictorial presentation of MB degradation on Co-SMA surface in presence of H2O2 and visible light.

Experiments were conducted to find out the rate of decomposition of H2O2 in presence of Co-SMA (20 g L−1) and visible light (10[thin space (1/6-em)]010 lux), but in the absence of MB, following the method described in Section 2.4.3. The zero order rate constant of H2O2 decomposition increased from 0.002 to 0.009 mg L−1 min−1 with increase in Co-SMA dose from 10 g L−1 to 20 g L−1 (Fig. 11, curve a–c). This decomposition was carried out with exposure of 10[thin space (1/6-em)]010 lux visible light and in the absence of MB. But the zero order rate constant for MB degradation varied from 0.012 to 0.017 mg L−1 min−1 with increase in catalyst dose from 10 g L−1 to 20 g L−1 (Table 1). Similar observation was reported earlier during the Fenton-like phenol degradation in Fe-zeolites.13 It shows that production of hydroxyl radical by decomposition of H2O2 is much slower than its consumption, which is related to the degradation of MB by the generated hydroxyl radical (Table 1). An induction time was observed for 10 and 15 g L−1 of Co-SMA at the initial period of the reaction. It may be due to the requirement of surface activation time.


image file: c6ra19857k-f11.tif
Fig. 11 Kinetics of H2O2 (348.8 mM) decomposition at different doses (10–20 g L−1; curve a–c) of Co(II)-SMA (but in absence of MB) and in presence of 10[thin space (1/6-em)]010 lux visible light. Curve d shows the H2O2 decomposition under homogeneous catalysis in presence of [Co] = 27.6 mg L−1 and 10[thin space (1/6-em)]010 lux visible light.
Table 1 Rate constant of MB degradation with respect to different operational parametersa
Sl. no. IC (mg L−1) DC (g L−1) CH (mM) LI (lux) RC (mg L−1 min−1) R2
a (IC: initial concentration of MB; DC: dose of Co-SMA; CH: conc. of H2O2 (30%); LI: light intensity in lux; RC: rate constant for zero-order reaction).
1 10 20 348.8 10[thin space (1/6-em)]010 0.017 0.982
2 20 20 348.8 10[thin space (1/6-em)]010 0.014 0.994
3 30 20 348.8 10[thin space (1/6-em)]010 0.012 0.996
4 10 10 348.8 10[thin space (1/6-em)]010 0.012 0.997
5 10 15 348.8 10[thin space (1/6-em)]010 0.015 0.988
6 10 20 348.8 10[thin space (1/6-em)]010 0.017 0.982
7 10 25 348.8 10[thin space (1/6-em)]010 0.018 0.979
8 10 30 348.8 10[thin space (1/6-em)]010 0.014 0.986
9 10 10 174.4 10[thin space (1/6-em)]010 0.008 0.995
10 10 10 348.8 10[thin space (1/6-em)]010 0.012 0.997
11 10 10 523.2 10[thin space (1/6-em)]010 0.014 0.999
12 10 20 348.8 4430 0.007 0.961
13 10 20 348.8 10[thin space (1/6-em)]010 0.017 0.982
14 10 20 348.8 19[thin space (1/6-em)]890 0.019 0.947
15 10 20 348.8 24[thin space (1/6-em)]700 0.016 0.988


The visible light photo catalysis by cobalt is due to the absorbance response in visible light region as shown in the UV-vis DRS spectrum of Co-SMA (Fig. 5). It is reported earlier also by researchers that cobalt facilitates the visible light photo response ability. Visible light facilitates the conversion of Co(III) to Co(II) (eqn (7)),42 which is essential for the Fenton type of reaction to continue.


3.4.1.1 Effect of Co-SMA dose. The dependence of the reaction rate on the dose was investigated in the range of 10–30 g L−1 of Co-SMA. The MB concentration was kept fixed at 10 mg L−1 and the H2O2 concentration was 348.8 mM. In the whole range of Co-SMA dose, the reaction followed zero order kinetics (Fig. 12a and b & Table 1). With the increase in dose from 10 g L−1 to 25 g L−1, the rate constant of the reaction increased from 0.012 to 0.018 mg L−1 min−1 (Fig. 12b & Table 1). Then further increase in the dose to 30 g L−1 resulted in a decrease in rate constant to 0.014 mg L−1 min−1 (Fig. 12b & Table 1). An increase in the catalyst dose led to an increase in the number of reactive sites, which produced more ˙OH radicals. However, excessive increase in the dose resulted in abundant production of ˙OH radicals, which react within themselves. As a consequence, the efficiency of pollutant degradation was lowered.46 Another reason for such a decrease in the efficiency is the turbidity generated by the increased amount of catalyst causing hindrance in the passage of light.47
image file: c6ra19857k-f12.tif
Fig. 12 (a) Kinetics of MB degradation with various doses of catalyst; (b) plot of zero-order rate constant vs. dose of catalyst (initial conc. of MB: 10 mg L−1; light intensity: 10[thin space (1/6-em)]010 lux; conc. of H2O2: 348.8 mM).

3.4.1.2 Effect of initial MB concentration. The reaction was observed with different MB concentrations (10–30 mg L−1), keeping Co-SMA dose fixed at 20 g L−1. After complete adsolubilization of MB on Co-SMA, H2O2 was added to the reaction mixture (final H2O2 concentration: 348.8 mM), and finally the reaction mixtures were exposed to visible light. The kinetic study showed that the reaction followed zero order at all concentrations. It is interesting to note that the initial rate constant up to 30 min (i.e. up to ∼40% degradation) of reaction in all three MB concentrations were exactly same (0.012 mg L−1 min−1) with excellent correlation (R2 = 0.99 in all case) (Fig. 13). However, as the reaction is further continued, slight deviation from the zero order rate is observed, especially in case of lower initial concentration of MB. As a whole, over the 60 min reaction, the rate constant decreased slightly as the initial concentration of MB increased from 10 mg L−1 to 30 mg L−1 (Table 1).
image file: c6ra19857k-f13.tif
Fig. 13 Zero order kinetic plot of MB degradation at different initial MB concentrations (dose of the catalyst: 20 g L−1; light intensity: 10[thin space (1/6-em)]010 lux; concentration of H2O2: 348.8 mM).

3.4.1.3 Effect of light intensity. The MB degradation under the chosen reaction condition (i.e. MB + VL + H2O2 + Co-SMA) was carried out under varying light intensity. Simple table lamps with different power (40–200 W; 4430–24[thin space (1/6-em)]700 lux) were used for such purpose. The light intensity was measured at the top surface of the reaction mixture. First, Co-SMA was added at a dose of 20 g L−1 to MB solution (initial concentration: 10 mg L−1) and was stirred for 30 min for complete adsorption of MB on the surface. Finally, the reaction was carried out up to 1 h. The reaction followed zero order kinetics for the entire range of light intensity. The rate constant of the reaction increased from 0.007 to 0.019 mg L−1 min−1 with increase in light intensity from 4430 to 19[thin space (1/6-em)]890 lux (Fig. 14). Further increase in intensity to 24[thin space (1/6-em)]700 lux resulted in a decrease in rate constant to 0.016 mg L−1 min−1 (Fig. 14 & Table 1). The reason for the decrease may be that, under intense light, the production of hydroxyl radical was large enough to react among themselves.46
image file: c6ra19857k-f14.tif
Fig. 14 Plot of zero order rate constant vs. intensity of light (initial conc. of MB: 10 mg L−1; dose of the catalyst: 20 g L−1; concentration of H2O2: 348.8 mM).

3.4.1.4 Effect of H2O2 concentration. In order to understand the effect of H2O2 on MB degradation kinetics, experiments were conducted with different concentrations of H2O2 (174.4 to 523.2 mM) following the same procedure as described earlier. The initial MB concentration was selected as 10 mg L−1, Co-SMA dose as 10 g L−1 and the light intensity as 10[thin space (1/6-em)]010 lux. In the entire range of H2O2 concentration, the reaction followed zero order kinetics. The rate constant increased from 0.008 to 0.014 mg L−1 min−1 with increase in H2O2 concentration from 174.4 to 523.2 mM. The plot of rate constant vs. H2O2 concentration (mM) followed a straight line with a correlation coefficient R2 = 0.964 (Fig. 15). The increase in the rate constant is due to an increase in the ˙OH radical concentration with the addition of more H2O2 to the solution.46
image file: c6ra19857k-f15.tif
Fig. 15 Plot of zero order rate constant vs. concentration of H2O2 (initial conc. of MB: 10 mg L−1; dose of the catalyst: 10 g L−1; light intensity: 10[thin space (1/6-em)]010 lux).

3.4.1.5 Effect of initial pH. Some of the treatment methods are pH dependent. During the process, in many cases, a significant change in the solution pH is observed. Thus pH adjustment is required during the treatment to get better efficiency. In the present case, however, the pH of the medium did not change significantly during the MB degradation. To understand the degradation efficiency in different pH conditions, the initial pH of MB was varied in the range of 3–12. The reaction was carried out for 60 min with visible light having intensity 10[thin space (1/6-em)]010 lux. The concentration of MB, Co-SMA and H2O2 applied were 10 mg L−1, 20 g L−1 and 174.4 mM, respectively. It was observed that while the decolorization efficiency was highest (∼96%) at pH 12, the MB decolorization was not efficient (∼46%) at pH 3. In earlier report also it is mentioned that heterogeneous Co2+ system showed enhanced reactivity in alkaline condition.15
3.4.2 Leaching of cobalt and SDS from Co-SMA surface during MB degradation. It was important to investigate the leaching of metal and surfactant for the adsolubilization-based method described. In the present study, leaching of cobalt from Co-SMA and Co-alumina were compared. It was interesting to see that discharge of cobalt in case of Co-SMA was much less as compared to that from Co-alumina after 90 min of reaction. Leaching of cobalt from Co-SMA was ∼5%, whereas that from Co-alumina was ∼93%. Thus the concentration of cobalt in the solution phase after 90 min reaction was 4.13 and 11.5 mg L−1 in case of Co-SMA and Co-alumina, respectively. Such lesser leaching in case of Co-SMA might be due to the bilayer structure of surfactant, which helped to attach cobalt more firmly. Leaching of SDS from Co-SMA was also very less (∼0.1%). The SDS concentration in the treated water was found as ∼2 mg L−1. This is certainly encouraging while water treatment is concerned.

3.5 Comparison of homogeneous and heterogeneous Fenton-like reaction

It was felt necessary to compare our new system with the conventional homogeneous Fenton-like reaction. To do so the homogeneous Fenton-like reaction was carried out with the Co(II) concentration 27.6 mg L−1 in 10 mg L−1 of MB solution. The concentration was selected with the apprehension that the whole amount of Co embedded in SMA is taking part in the reaction. It was noted with interest that no degradation in solution phase occurred at that Co(II) concentration in case of homogeneous photo-Fenton reaction. So, concentration of cobalt in solution phase was increased gradually by 3.4, 170, 340, 681 and 1702 times as that of the Co(II) present in Co-SMA. It is worthy to note that, for homogeneous catalysis even at 1702 times higher concentration of Co(II), the degradation of MB was found to be only ∼29% after 90 min reaction. But in case of Co-SMA, the MB degradation was almost complete (∼97.4%) in 60 min under our experimental condition i.e. with 20 g L−1 Co-SMA dose. It concludes that, for the reaction, the heterogeneous system was much more efficient than the homogeneous one. From the above experiment, the possibility of MB degradation due to the catalytic activity of leached cobalt is also excluded.

Further, to know whether H2O2 decomposition (and thereby hydroxyl radical generation) in presence of Co-SMA surface is favored, the reaction was performed in heterogeneous and homogeneous catalysis conditions (but in the absence of MB), and the rate was compared. In both cases the conditions were identical and the cobalt concentration were kept the same (i.e. in homogeneous condition [Co] = 27.6 mg L−1; and in heterogeneous condition the Co-SMA dose was 20 g L−1 since the cobalt was loaded at 1.38 mg g−1 of SMA and it was assumed that the whole amount of cobalt is taking part in the reaction). The kinetics for both homogeneous- and heterogeneous-phase reactions has been shown in Fig. 11. It was observed that H2O2 concentration did not change over time in case of homogeneous Fenton, whereas a decrease in H2O2 concentration was observed in solid supported catalyst. This reveals that same amount of cobalt in solution phase is not able to generate hydroxyl radical. Hence, our Co-SMA system is expected to give better results in terms of MB degradation.

3.6 Mechanistic aspect of reaction

3.6.1 Hydroxyl radical formation during MB degradation. To investigate the mechanism of reaction it was important to examine the formation of reactive oxygen species (ROS), especially the ˙OH radicals in the photo-Fenton process. For this purpose disodium salt of terephthalic acid fluorescence probing technology and radical scavenging measurements were carried out. Terephthalic acid (TA) reacts with hydroxyl radical at near neutral pH, and forms 2-hydroxyterephthalic acid which has a bright stable fluorescence at λem: 425 nm (λex: 315 nm; slit 10/10) (Fig. S3).48,49 This reaction is unaffected by the presence of other ROS such as H2O2, HO2˙ and O2˙. This phenomenon was utilized to confirm the formation of ˙OH radical in the system. The generation of ˙OH radical was monitored in presence and in absence of MB. Both the reactions were carried out in presence of visible light (10[thin space (1/6-em)]010 lux), Co-SMA (20 g L−1), and H2O2 (348.8 mM). For this experiment, 1.5 mL of reaction mixture, taken at certain reaction times, was added to 1.5 mL of TA (prepared by dissolving in aqueous NaOH solution followed by the addition of HCl to adjust the pH at ∼7), and finally the fluorescence intensity was measured. The time dependant fluorescence spectra of the reaction mixture, in the absence of adsolubilized MB, are shown in Fig. 16a. The increase of fluorescence intensity with increase in time, throughout the entire period of reaction (1 h), revealed that ˙OH radicals were produced continuously, upon reaction of H2O2 with Co(II) embedded in SMA. This is also supported by the H2O2 decomposition in presence of Co-SMA (Section 3.4.1 and 3.5). This hydroxyl radical might either be the un-adsorbed or desorbed ROS (i.e. coming out of the Co-SMA surface after reaction of H2O2 with Co(II)). However, in the presence of adsolubilized MB, the fluorescence intensity generated was much less (Fig. 16b). Moreover, from the figure, an increasing trend was observed during the first 45 min, and then in next 15 min the fluorescence intensity decreased. The probable reason was that, part of the ˙OH radical present in the liquid phase took part in the degradation of MB, or may be reacted with unused H2O2. The kinetics of the reaction in the absence and presence of MB is shown in Fig. 16c and d, respectively. In both the cases the kinetics was observed to be of zero order. It was noticed that in the first case the kinetics of fluorescence evolution was faster compared to that of the second one, which indicated the participation of ˙OH radical in the MB degradation process. Similar observation was reported by Xu et al. earlier for MB degradation in Co(II)–bicarbonate system.48
image file: c6ra19857k-f16.tif
Fig. 16 Monitoring of OH radical formation during the catalytic decomposition of H2O2 by Co(II)-SMA through time dependent fluorescence evolution upon reaction of OH radical with terephthalic acid in (a) absence, and (b) in presence of adsorbed MB (10 mg L−1). (TA: 0.134 mM, H2O2: 348.8 mM, Co-SMA: 20 g L−1, (b) TA: 0.134 mM, H2O2: 348.8 mM, Co-SMA: 20 g L−1). (c) and (d) shows the plot of fluorescence intensity vs. time for the reaction conditions (a) and (b), respectively.
3.6.2 Identification of the degradation products of MB. The pure MB as well as the degradation products of MB, which desorbed from the solid surface and finally remained in water medium, was identified by ESI mass spectra (Fig. S4 (a and b)). The formation of ˙OH radical and the subsequent oxidation of MB were evidenced from the analysis of the spectrum of the reaction mixture after 1 h. The reaction was carried out on MB (10 mg L−1) with Co-SMA (20 g L−1) under the described Experimental condition. In the reaction mixture, the MB cation did not appear at m/z 284 (structure 1 in Fig. 17). However, the peaks in higher mass region appeared at m/z 300, 316 and 338. These peaks could be related to the products (as shown by structure 2, 3a, 3b, and 4 in Fig. 17 (Scheme 1)) formed from the successive hydroxylation of the MB molecule due to ˙OH radical attack. The other signals appearing in the lower mass region were due to the fragmentation of the molecular structure of MB. This result agreed well with the several reports50,51 describing complete mineralization of MB by ˙OH radical. In the lower range the signals appeared at m/z 270 which corresponded to the structure due to the loss of methyl group bonded to the amino group of MB molecule (structure 5 in Fig. 17, Scheme 2).51 During degradation, the molecular structure broke into several fragments showing the characteristic peaks at m/z 245 (structure 6 in Fig. 17, Scheme 2),52 161 (structure 7 in Fig. 17, Scheme 1)50 and 158 (structure 8 in Fig. 17, Scheme 2).53 During the process, the prominent peak, which appeared at m/z 207, could be assigned to the structure 9 (Fig. 17, Scheme 1), generated from the hydroxylated products.54 The reaction scheme with proposed route for MB degradation is shown in Fig. 17. It is important, at this point, to mention that while the ESI-MS was performed on pure MB (at a concentration of 10 mg L−1) under the same condition as that of the reaction mixture, it showed peak only at m/z 284, which corresponded to MB cation.55 In addition to this, another peak at m/z = 285 was found. The precursor of this peak might be due to leucomethylene blue, the reduced form of methylene blue.55 No other peak at either higher or lower mass region appeared in this case. Similar observation was reported earlier by Mansur et al.54
image file: c6ra19857k-f17.tif
Fig. 17 Degradation products of MB identified by mass spectroscopy after 60 min reaction (conc. of MB: 10 mg L−1; dose of Co-SMA: 20 g L−1; light intensity: 10[thin space (1/6-em)]010 lux; conc. of H2O2: 348.8 mM).

3.7 Turn over number (TON), turn over frequency (TOF) and recycle ability of the catalyst

In heterogeneous catalysis, the TON is the number of reactant molecules that 1 g of catalyst can convert into products. The TOF is TON per time. TON and TOF speak about the efficiency of a catalyst. Catalyst having higher TON and TOF is considered to be more efficient. In this catalytic reaction study, TON and TOF were calculated for 10 mg L−1 MB concentration and 20 g L−1 Co-SMA dose. Here, in case of 20 g L−1 Co-SMA dose, amount of cobalt (0.276 mg per 10 mL of reaction mixture) present in SMA was considered for the calculation. The TON and TOF values for the said concentration and dose were found to be 6.82 × 10²⁰ molecules per g and 1.89 × 10¹⁷ molecules per g per second.

The recycle ability of the catalyst is a very important factor to judge the applicability of the method. The cost is less in case of the catalysts, which can be recycled many times. The recycle ability of Co-SMA was tested for MB degradation using Co-SMA as catalyst. In this experiment MB solution (conc. 10 mg L−1) was degraded in presence of Co-SMA (20 g L−1) and H2O2 (348.8 mM) under visible light (10[thin space (1/6-em)]010 lux). The catalyst showed good performance up to 3rd cycle (89.9% degradation) when compared to the 1st cycle (97.4%). However, in the 4th cycle the efficiency was reduced to 68.2%. The results are shown in Fig. 18.


image file: c6ra19857k-f18.tif
Fig. 18 Recycle ability of Co-SMA for MB degradation (initial conc. of MB: 10 mg L−1; catalyst dose: 20 g L−1; light intensity: 10[thin space (1/6-em)]010 lux; conc. of H2O2: 348.8 mM).

4. Conclusions

A new heterogeneous photo-catalyst was fabricated, where Co(II) was adsorbed on the admicellar support, formed on surfactant-modified alumina (SMA). The as-prepared catalyst, designated as Co-SMA, was characterized by SEM/EDAX, FTIR and XPS. Adsorption of cobalt on SMA was ∼6.4 times higher as compared to that on normal alumina. Methylene blue (MB) was then adsolubilized on the same surface for further degradation using photo-Fenton reaction. The new aspect of the method is that the degradation of MB occurred in fully adsolubilized state and under micellar environment, and it followed zero order kinetics under all different conditions examined. The reaction was studied under various experimental conditions i.e. initial concentration of MB, dose of Co-SMA, H2O2 concentration and light intensity. Decolorization efficiency was found to be ∼96% at pH 12, whereas 46% at pH 3. The MB degradation with the developed heterogeneous Co-SMA catalyst was much more efficient as compared to homogeneous cobalt catalyzed Fenton reaction. Fluorescence experiment confirmed that ˙OH radicals were generated and utilized in the Fenton reaction. The TON and TOF of the catalyst were calculated and found to be 6.82 × 10²⁰ molecules per g and 1.89 × 10¹⁷ molecules per g per second, respectively. It was observed that the catalyst Co-SMA could be recycled up to 3rd cycle with almost the same efficiency as that of the fresh material. Mass spectral analyses confirmed the degradation of MB in to smaller molecules, under the experimental conditions.

Acknowledgements

The authors are thankful to Prof. S. K. Srivastava, Department of Physics, IIT Kharagpur for the XPS analysis of Co-SMA. The authors are also thankful to Indian Institute of Technology, Kharagpur, India for the financial support.

References

  1. M. Neamtu, A. Yediler, I. Siminiceanu and A. Kettrup, J. Photochem. Photobiol., A, 2003, 161, 87–93 CrossRef CAS.
  2. V. Kavitha and K. Palanivelu, Chemosphere, 2004, 55, 1235–1243 CrossRef CAS PubMed.
  3. C. L. Hsueh, Y. H. Huang, C. C. Wang and C. Y. Chen, Chemosphere, 2005, 58, 1409–1414 CrossRef CAS PubMed.
  4. R. Matta, K. Hanna and S. Chiron, Sci. Total Environ., 2007, 385, 242–251 CrossRef CAS PubMed.
  5. Y. Yang, P. Wang, S. Shi and Y. Liu, J. Hazard. Mater., 2009, 168, 238–245 CrossRef CAS PubMed.
  6. L. M. Nieto, G. Hodaifa, S. Rodríguez, J. A. Giménez and J. Ochando, Chem. Eng. J., 2011, 173, 503–510 CrossRef CAS.
  7. A. Cao and G. Veser, Nat. Mater., 2010, 9, 75–81 CrossRef CAS PubMed.
  8. J. Chen and L. Zhu, Catal. Today, 2007, 126, 463–470 CrossRef CAS.
  9. F. Martínez, G. Calleja, J. A. Melero and R. Molina, Appl. Catal., B, 2007, 70, 452–460 CrossRef.
  10. J. H. Ramirez, F. J. Maldonado-Hódar, A. F. Pérez-Cadenas, C. Moreno-Castilla, C. A. Costa and L. M. Madeira, Appl. Catal., B, 2007, 75, 312–323 CrossRef CAS.
  11. J. Deng, J. Jiang, Y. Zhang, X. Lin, C. Du and Y. Xiong, Appl. Catal., B, 2008, 84, 468–473 CrossRef CAS.
  12. L. Xu and J. Wang, J. Hazard. Mater., 2011, 186, 256–264 CrossRef CAS PubMed.
  13. R. Gonzalez-Olmos, M. J. Martin, A. Georgi, F. D. Kopinke, I. Oller and S. Malato, Appl. Catal., B, 2012, 125, 51–58 CrossRef CAS.
  14. M. L. Rache, A. R. García, H. R. Zea, A. M. Silva, L. M. Madeira and J. H. Ramírez, Appl. Catal., B, 2014, 146, 192–200 CrossRef CAS.
  15. A. D. Bokare and W. Choi, J. Hazard. Mater., 2014, 275, 121–135 CrossRef CAS PubMed.
  16. E. G. Heckert, S. Seal and W. T. Self, Environ. Sci. Technol., 2008, 42, 5014–5019 CrossRef CAS PubMed.
  17. D. A. Nichela, A. M. Berkovic, M. R. Costante, M. P. Juliarena and F. S. G. Einschlag, Chem. Eng. J., 2013, 228, 1148–1157 CrossRef CAS.
  18. F. Nerud, P. Baldrian, J. Gabriel and D. Ogbeifun, Chemosphere, 2001, 44, 957–961 CrossRef CAS PubMed.
  19. X. Liang, Y. Zhong, H. He, P. Yuan, J. Zhu, S. Zhu and Z. Jiang, Chem. Eng. J., 2012, 191, 177–184 CrossRef CAS.
  20. A. D. Bokare and W. Choi, Environ. Sci. Technol., 2010, 44, 7232–7237 CrossRef CAS PubMed.
  21. Z. Xu, Y. Yu, D. Fang, J. Xu, J. Liang and L. Zhou, Ultrason. Sonochem., 2015, 27, 287–295 CrossRef CAS PubMed.
  22. Z. Xu, D. Fang, W. Shi, J. Xu, A. Lu, K. Wang and L. Zhou, Environ. Eng. Sci., 2015, 32, 497–504 CrossRef CAS.
  23. Y. P. Zhu, T. Z. Ren and Z. Y. Yuan, RSC Adv., 2015, 5, 7628–7636 RSC.
  24. Q. Chen, F. Ji, Q. Guo, J. Fan and X. Xu, J. Environ. Sci., 2014, 26, 2440–2450 CrossRef PubMed.
  25. P. Shi, R. Su, S. Zhu, M. Zhu, D. Li and S. Xu, J. Hazard. Mater., 2012, 229, 331–339 CrossRef PubMed.
  26. P. Shukla, H. Sun, S. Wang, H. M. Ang and M. O. Tadé, Sep. Purif. Technol., 2011, 77, 230–236 CrossRef CAS.
  27. A. K. Das, S. Saha, A. Pal and S. K. Maji, J. Environ. Sci. Health, Part A: Toxic/Hazard. Subst. Environ. Eng., 2009, 44, 896–905 CrossRef CAS.
  28. A. Adak, M. Bandyopadhyay and A. Pal, Sep. Purif. Technol., 2005, 44, 139–144 CrossRef CAS.
  29. M. U. Khobragade and A. Pal, J. Environ. Sci. Health, Part A: Toxic/Hazard. Subst. Environ. Eng., 2015, 50, 385–395 CrossRef CAS PubMed.
  30. M. U. Khobragade and A. Pal, J. Environ. Chem. Eng., 2014, 2, 2295–2305 CrossRef CAS.
  31. P. Mahamallik and A. Pal, RSC Adv., 2015, 5, 78006–78016 RSC.
  32. A. Adak, A. Pal and M. Bandyopadhyay, Indian J. Chem. Technol., 2005, 12, 145–148 CAS.
  33. F. L. Lam, A. C. Yip and X. Hu, Ind. Eng. Chem. Res., 2007, 46, 3328–3333 CrossRef CAS.
  34. A. Adak, A. Pal and M. Bandyopadhyay, Colloids Surf., A, 2006, 277, 63–68 CrossRef CAS.
  35. S. Kundu, S. K. Ghosh, M. Mandal, T. Pal and A. Pal, Talanta, 2002, 58, 935–942 CrossRef CAS PubMed.
  36. D. C. Vasconcelos, E. H. Nunes and W. L. Vasconcelos, J. Non-Cryst. Solids, 2012, 358, 1374–1379 CrossRef CAS.
  37. M. K. Singh, A. Agarwal, R. Gopal, R. K. Swarnkar and R. K. Kotnala, J. Mater. Chem., 2011, 21, 11074–11079 RSC.
  38. O. D. Jayakumar, C. Sudakar, C. Persson, V. Sudarsan, T. Sakuntala, R. Naik and A. K. Tyagi, Cryst. Growth Des., 2009, 9, 4450–4455 CAS.
  39. Y. Lu, Y. Lin, D. Wang, L. Wang, T. Xie and T. Jiang, Nano Res., 2011, 4, 1144–1152 CrossRef CAS.
  40. A. C. M. Esther, N. Sridhara, S. V. Sebastian, P. Bera, C. Anandan, S. T. Aruna, D. Rangappa, A. K. Sharma and A. K. Dey, J. Mater. Sci.: Mater. Electron., 2015, 26, 9707–9716 CrossRef CAS.
  41. R. Sahoo, A. K. Sasmal, C. Ray, S. Dutta, A. Pal and T. Pal, ACS Appl. Mater. Interfaces, 2016, 8, 17987–17998 CAS.
  42. T. Warang, N. Patel, R. Fernandes, N. Bazzanella and A. Miotello, Appl. Catal., B, 2013, 132, 204–211 CrossRef.
  43. G. Ertl, Surf. Sci., 1994, 299, 742–754 CrossRef.
  44. M. A. Vannice, Catal. Today, 2007, 123, 18–22 CrossRef CAS.
  45. N. G. Asenjo, R. Santamaría, C. Blanco, M. Granda, P. Álvarez and R. Menéndez, Carbon, 2013, 55, 62–69 CrossRef CAS.
  46. J. An, L. Zhu, Y. Zhang and H. Tang, J. Environ. Sci., 2013, 25, 1213–1225 CrossRef CAS.
  47. N. Daneshvar, S. Aber, M. S. Dorraji, A. R. Khataee and M. H. Rasoulifard, Sep. Purif. Technol., 2007, 58, 91–98 CrossRef CAS.
  48. A. Xu, X. Li, S. Ye, G. Yin and Q. Zeng, Appl. Catal., B, 2011, 102, 37–43 CrossRef CAS.
  49. K. I. Ishibashi, A. Fujishima, T. Watanabe and K. Hashimoto, J. Photochem. Photobiol., A, 2000, 134, 139–142 CrossRef CAS.
  50. H. W. Carvalho, A. P. Batista, P. Hammer and T. C. Ramalho, J. Hazard. Mater., 2010, 184, 273–280 CrossRef CAS PubMed.
  51. A. P. Batista, H. W. P. Carvalho, G. H. Luz, P. F. Martins, M. Gonçalves and L. C. Oliveira, Environ. Chem. Lett., 2010, 8, 63–67 CrossRef CAS.
  52. J. Zhang, F. T. Hu, Q. Q. Liu, X. Zhao and S. Q. Liu, React. Kinet., Mech. Catal., 2011, 103, 299–310 CrossRef CAS.
  53. A. Houas, H. Lachheb, M. Ksibi, E. Elaloui, C. Guillard and J. M. Herrmann, Appl. Catal., B, 2001, 31, 145–157 CrossRef CAS.
  54. A. A. Mansur, H. S. Mansur, F. P. Ramanery, L. C. Oliveira and P. P. Souza, Appl. Catal., B, 2014, 158, 269–279 CrossRef.
  55. H. Gnaser, M. R. Savina, W. F. Calaway, C. E. Tripa, I. V. Veryovkin and M. J. Pellin, Int. J. Mass Spectrom., 2005, 245, 61–67 CrossRef CAS.

Footnote

Electronic supplementary information (ESI) available. See DOI: 10.1039/c6ra19857k

This journal is © The Royal Society of Chemistry 2016
Click here to see how this site uses Cookies. View our privacy policy here.