Simultaneous and direct analysis of multiple types of organic contaminants in water based on a MOF decorated with a suitable quantity of Au nanoparticles, using SALDI-TOF MS

Hongyun Niua, Saihua Wangab, Yixin Tanc, Xiaowei Songab and Yaqi Cai*ab
aState Key Laboratory of Environmental Chemistry and Ecotoxicology, Research Center for Eco-Environmental Sciences, Chinese Academy of Sciences, Beijing 100085, China. E-mail: caiyaqi@rcees.ac.cn; Tel: +86-10-62849182
bUniversity of Chinese Academy of Sciences, Beijing, 100049, China
cDepartment of Resources Environmental and Chemical Engineering of Nanchang University, Nanchang, Jiangxi Province 330031, China

Received 3rd August 2016 , Accepted 10th October 2016

First published on 11th October 2016


Abstract

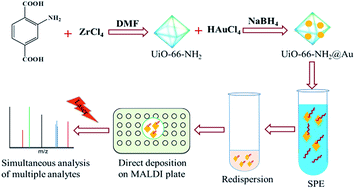
For the first time, surface-assisted laser desorption/ionization time-of-flight mass spectrometry (SALDI-TOF MS) combined with direct solid-phase extraction was used to simultaneously and rapidly analyze multiple types of organic contaminants in water samples. The technique employed gold nanoparticles (Au NPs) loaded onto the metal–organic framework (MOF) UiO-66-NH2. A suitable quantity of Au NPs endows excellent matrix functionality to the nanocomposite with only weak Au cluster peak interference.

Due to intensive industrial growth, water has become more and more polluted with toxic organic contaminants, which pose a great threat to human health and water ecosystems. Developing advanced multi-residue methodologies can provide broad and realistic information about water pollution in a rapid, sensitive and selective way. Mass spectrometry (MS) coupled with gas chromatography (GC) or liquid chromatography (LC) has been successfully applied for identifying and analyzing multiple types of analytes in different fields.1–3 However, these methods usually involve complicated sample treatment procedures and require professional staff to operate the instruments; this is cost-intensive, labor-intensive and time-consuming.

Recently, the surface-assisted laser desorption/ionization time-of-flight mass spectrometry (SALDI-TOF MS) technique using nanoparticles as the laser desorption/ionization (LDI)-assisting matrix for the determination of toxic organic contaminants has been developed. The advantages of SALDI-TOF MS over other methodologies include high throughput and analysis speed, good tolerance toward contaminants, the ability to analyze complex mixtures, and easy operation.4,5 Various kinds of environmental organic and inorganic pollutants have been analyzed using SALDI-TOF MS including dioxin,6 perfluorinated chemicals (PFCs),7–10 brominated flame retardants,10–12 polycyclic aromatic hydrocarbons (PAHs),8,9,12–17 pesticides,7,10,12 endocrine disrupting chemicals (EDCs),7,9,17,18 estrogens,10,18,19 organic dyes,20,21 pharmaceuticals,8,21–24 and so on.

However, multi-residue methodology has not been successfully established and applied based on the SALDI-TOF MS technique. This could be very informative for the simultaneous measurement of the above mentioned pollutants to monitor the concurrences of organic contaminants in water samples. To achieve this, nanomaterials should exhibit very high efficiencies for the detection of various small molecules, and very low background interference in the region of 200–800 Da. Gold nanoparticles (Au NPs) offer a powerful SALDI matrix for small biomolecules.25–31 However, the Au NP matrix often produces many Au cluster peaks in the mass spectrum that tend to suppress the actual sample ion peaks; moreover, the Au colloids may become inhomogeneously distributed after being dried on the target plate, thus leading to poor reproducibility. To solve this problem, in our work, the Au NPs are loaded onto zirconium based metal–organic frameworks modified with amino groups (UiO-66-NH2) via an impregnation method which takes advantage of the electrostatic attraction between AuCl4 and the amino groups on the MOF. The content of Au NPs in the nanocomposites is 0.3 atomic% according to X-ray photoelectron spectroscopy (XPS) analysis (Table S1, ESI), which both guarantees excellent assistance for the LDI of the analytes and avoids intense Au cluster peak interference in the mass spectrum. MOFs have also been reported to have matrix effects for the detection of low-mass molecules.9,16,18 Therefore, a synergistic effect on the LDI of the analytes in SALDI-TOF can be expected from the combination of the Au NPs and the MOF itself. Detailed information about the synthesis and characterization of the UiO-66-NH2@Au nanocomposites is presented in the ESI.

The as-prepared UiO-66-NH2@Au possessed an octahedral structure with particle sizes ranging from 70–100 nm (Fig. 1A). The excellent uniformity of the nanocomposite can be observed in the scanning electron microscopy (SEM) image (Fig. 1B). In the high resolution transmission electron microscopy (HRTEM) image in Fig. 1C, well-defined lattice fringes are clearly observed, with a lattice spacing of 0.307 nm, corresponding to the {111} diffraction plane of Au NPs. The estimated particle size of the Au NPs is 3–5 nm. The nanoscale and uniform size of UiO-66-NH2@Au ensure the high reproducibility of mass signals. According to the N2 adsorption/desorption isotherm, the Brunauer–Emmett–Teller (BET) surface area of the obtained UiO-66-NH2@Au composite was 500 m2 g−1 (Fig. S1A, ESI). Infrared (IR) spectra (Fig. S1B, ESI) and XPS analysis (Fig. S2, ESI) proved the existence of sufficient benzene rings and –NH2 groups in the nanocomposites to provide hydrophobic interactions, π–π stacking and electrostatic attractive interactions to organic pollutants. In the UV-Vis spectrum of UiO-66-NH2@Au (Fig. 1D), absorption at 337 nm was observed. Two absorption peaks at 365 nm and 532 nm also confirm the introduction of –NH2 groups and Au NPs. In summary, the high absorption in the near-ultraviolet region and the immobilization of Au NPs offer great potential to UiO-66-NH2@Au as a SALDI matrix.


image file: c6ra19635g-f1.tif
Fig. 1 TEM (A), SEM (B), and HRTEM (C) images of UiO-66-NH2@Au. UV-Vis spectrum of UiO-66-NH2@Au (D).

We first compared the matrix effects of UiO-66, UiO-66-NH2, and UiO-66-NH2@Au by employing perfluorooctane sulfonate (PFOS) as a model analyte. As shown in Fig. 2A, UiO-66 exhibited a poor matrix performance for the LDI of PFOS. Due to the high absorption at 337 nm (Fig. S3, ESI), the S/N ratio of the PFOS ion rose greatly when UiO-66-NH2 was used as the matrix although there was strong background signal interference (Fig. 2B). With the UiO-66-NH2@Au matrix, however, the S/N ratios for the PFOS ion were around 10 times higher than those obtained with UiO-66-NH2. The background signal interference in the mass spectrum generally disappeared; the Au cluster peaks Au2 and Au3 (at m/z 394 and 591) were observed in the mass region of 200–600 Da with relatively low intensity (Fig. 2C), and showed a limited negative effect on the LDI efficiency of the target. The weak peak intensity of the Au clusters might arise from the low content of Au NPs in the nanocomposites. A suitable quantity of Au NPs guarantees a high LDI efficiency for analytes and low background interference by the matrix. The excess energy stored in the Au NPs after photoexcitation could be released into the MOF support, preventing evaporation and destruction of the Au NPs.31


image file: c6ra19635g-f2.tif
Fig. 2 SALDI-TOF MS of PFOS at different concentrations (100, 10 and 1 ng mL−1 from the top row to the bottom row) in negative reflection mode with UiO-66 (A), UiO-66-NH2 (B) and UiO-66-NH2@Au (C) as the matrixes.

The possibility for simultaneous analysis of multiple types of hazardous compounds was investigated by detecting a mixture of PFCs (perfluorobutane sulfonate PFBS, perfluorohexane sulfonate PFHxS, and PFOS), the endocrine disrupting chemical bisphenol A (BPA), halogenated flame retardants (tetrabromobisphenol A TBBPA, pentabromophenol PBP, and tetrachlorobisphenol A TCBPA), the pesticide pentachlorophenol (PCP), and hormones (L-thyronine T3, L-thyroxine T4, and 17-α-ethynylestradiol EE2) at different levels. With the assistance of UiO-66-NH2@Au, the deprotonated ions of these chemicals could be distinctly identified using LDI-TOF MS. The signal intensity of these analytes increased linearly as their concentrations rose (Fig. 3A–C). In contrast, with an α-cyano-4-hydroxycinnamic acid (CHCA) or 2,5-dihydroxybenzoic acid (DHB) matrix, only the signals of the three PFCs ions could be identified, accompanying dense background interference (Fig. 3D and E). Apparently, the LDI of nonpolar and mediated polar targets at low concentrations is hardly realized with the aid of organic matrixes, which may result from the fact that the fragment peaks of CHCA and DHB matrixes in the mass spectra totally suppressed the signals of phenols and hormones. With the aid of UiO-66-NH2@Au, in the multi-residue study, the detection limit (S/N = 3) of PFCs reached 190–650 fg, while LODs for halogenated phenols, BPA, and hormones ranged from 3–44 pg (Table S2, ESI). Compared with the mass spectra and LODs of the individual analytes, the signal intensity (for the same concentration) and detection limit of each analyte in the mixture dropped by about 5–20% (Fig. S4–S7 and Table S3, ESI). This meant that the LODs for most of the analytes achieved in the present study were comparable to, or better than, those reported in the literature,8,13,17 indicating the high sensitivity of the established method. Moreover, the perfect homogeneity of the UiO-66-NH2@Au matrix results in good reproducibility. Taking PBP (50 ng mL−1) as an example, the RSDs were 10.7% (n = 15) for spot-to-spot and 12.9% (n = 30) for sample-to-sample assays (Fig. S8, ESI).


image file: c6ra19635g-f3.tif
Fig. 3 Comparison of the simultaneous detection of PFCs, halogenated fire retardants, PCP, and endocrine disrupting chemicals in a single run via LDI-TOF MS using UiO-66-NH2@Au (A–C), CHCA (D), and DHB (E) matrixes. Analyte concentrations for (A), (D) and (E) PFCs 100 ng mL−1; PCP, halogenated fire retardants, BPA and EE2 1000 ng mL−1; T3 and T4 10[thin space (1/6-em)]000 ng mL−1. Analyte concentrations for (B) PFCs 10 ng mL−1; PCP, halogenated fire retardants, BPA and EE2 100 ng mL−1; T3 and T4 1000 ng mL−1. Analyte concentrations for (C) PFCs 1 ng mL−1; PCP, halogenated fire retardants, BPA and EE2 50 ng mL−1; T3 and T4 100 ng mL−1.

UiO-66-NH2@Au possesses an ultrahigh surface area and bears abundant benzene rings and amino groups, which exhibit strong adsorption capabilities for organic pollutants. Thereby, UiO-66-NH2@Au can be used as a solid-phase extraction (SPE) adsorbent to enrich low levels of targets from water samples. As a result of its matrix function, the UiO-66-NH2@Au SPE can be used to detect the enriched analytes directly. Thus the time required for the analysis of multiple groups of organic pollutants in water samples is shortened from several days to one hour.

We selected PBP, TCBPA, TBBPA, and three PFCs as models to test the ability of UiO-66-NH2@Au as a SPE adsorbent as well as a matrix. A series of analytes (0.5–50 ng mL−1 for phenols and 0.05–10 ng mL−1 for PFCs) were enriched by 1 mg of UiO-66-NH2@Au from 40 mL of water solution. After 30 min of enrichment, the collected UiO-66-NH2@Au was redispersed in acetonitrile/water (50% v/v) solution and directly analyzed using SALDI-TOF MS. The signal intensities of the deprotonated ions of the halogenated fire retardants and PFCs increased linearly with their spiked concentrations, with R2 values >0.987 and RSDs ranging from 7.8–18% (n = 3) (Table S4, ESI). The corresponding mass spectra of PBP, TCBPA, TBBPA and PFCs with various concentrations are shown in Fig. S9. The S/N ratios of PFOS and PFHxS were 15 and 5.9, respectively, at 0.05 ng mL−1; for PFBS and PBP, the S/N ratios were higher than 10 as the spiked concentration was 0.5 ng mL−1; and signals for ionized fragments of TCBPA and TBBPA were observed at 1.0 ng mL−1 (S/N ≥ 9.0). The LODs for phenols and PFCs decreased to 0.2–0.8 and 0.02–0.12 ng mL−1, respectively. Compared with the LODs of these analytes without enrichment, the detection sensitivity rose 15–35 fold for phenols and 5–10 fold for PFCs. The absolute recoveries of PBP, TCBPA, TBBPA, PFBS, PFHxS and PFOS were 30.4%, 52.8%, 75.8%, 11.2%, 12.5%, and 21.0%, respectively (Table S4, ESI). The low recoveries of these analytes (especially PFCs) mainly resulted from a lower amount of UiO-66-NH2@Au in this system than would be used in a traditional SPE technique.

For PFCs, the detection sensitivities in this study were lower than those reported by Kawasaki and coworkers7 which were 0.1–10 ng L−1 for PFOS, PFHxS and PFBS using functionalized graphene-coated cobalt nanoparticles both as adsorbent and matrix. In Kawasaki's study, the extremely low LODs for PFCs partly resulted from the huge volume (1 L) of water samples, which gave rise to larger enrichment factors. On the other hand, the graphene-coated cobalt nanoparticles were more hydrophobic than MOF. Although Kawasaki and co-workers stated that electrostatic interactions between –NH2 groups and PFCs were responsible for anionic PFOS uptake, the hydrophobic interactions between adsorbents and PFCs played an important role as well, which may be one of the possible reasons for the higher sensitivity observed for long-chain PFOS than for PFHxS and PFBS. In this study, the enhancement of sensitivity was related to the hydrophobicity of the analytes, implying that hydrophobic interactions were the driving force for the analytes' uptake. To confirm this hypothesis, we desorbed the analytes from UiO-66-NH2@Au after enrichment and the concentrated eluent was analyzed by high performance liquid chromatography (HPLC)-UV and HPLC/MS/MS for the detection of phenols and PFCs respectively (see Table S4, ESI). The absolute recoveries of PBP, TCBPA, TBBPA, PFBS, PFHxS and PFOS were 25.3%, 57.5%, 72.5%, 12.8%, 16.0%, and 21.8%, respectively, which were close to the recoveries of these analytes obtained by the SPE-SALDI-TOF MS technique. The recoveries of these analytes by the traditional SPE method were correlated with the hydrophobicity of the analytes as well. We also determined the LODs of the analytes using the traditional SPE method. The sensitivities for the phenols were similar to those determined via the SPE-SALDI-TOF MS method (Table S5, ESI). However, the LODs of the PFCs were significantly lower than those achieved by the SPE-SALDI-TOF MS system. We believe that the sensitivity to PFCs of the SPE-SALDI-TOF MS technique can be greatly enhanced by improving the surface hydrophobicity of the adsorbent.

To investigate the feasibility of the method for the analysis of halogenated phenols and PFOS, SPE-SALDI-TOF MS was applied to determine the presence of analytes in tap water and river water samples. The blank water samples were pretreated with UiO-66-NH2@Au and analyzed directly with SALDI-TOF MS. As presented in Fig. S10–S12, no PFCs, PBP, TCBPA and TBBPA were detected in these water samples. Then we spiked low (10 ng mL−1 of phenols and 1 ng mL−1 of PFCs) and high (50 ng mL−1 of phenols and 5 ng mL−1 of PFCs) concentrations of analytes into the water samples. The spiked samples were directly measured by SALDI-TOF MS with the assistance of the UiO-66-NH2@Au matrix. As shown in Fig. 4A, B, S11B, C and S12B, C, the obvious [M − H] and the fragments of PBP and PFCs were detected in all the samples since the spiked concentrations were higher than the corresponding LODs. For TCBPA and TBBPA, the deprotonated ions and fragments were identified when the spiked concentrations were 50 ng mL−1 (Fig. 4B, S11C and S12C†). The signal intensities of these analytes in water samples were comparable to those from standard test solutions (Fig. S10B and C, ESI), implying the good resistance of the matrix to real samples. Subsequently, the water samples spiked with low concentrations of analytes were pretreated with UiO-66-NH2@Au and detected using SALDI-TOF MS. Fig. 4C, S11D and S12D show that the [M − H] and fragments of all the analytes were discerned clearly in these water samples. The recoveries of phenols and PFCs were in the range 75–90% (Table S6, ESI). This result proves the application potential of the proposed strategy of SPE coupled with direct SALDI-TOF MS in the rapid, sensitive, and simultaneous analysis of multiple types of hazardous compounds in real water samples.


image file: c6ra19635g-f4.tif
Fig. 4 Simultaneous analysis of PFCs and halogenated fire retardants in tap water samples using the established SPE-SALDI-TOF MS technique: 10 ng mL−1 of halogenated fire retardants and 1 ng mL−1 of PFCs spiked in tap water (A), 50 ng mL−1 of halogenated fire retardants and 5 ng mL−1 of PFCs spiked in tap water (B), and mass spectrum of 10 ng mL−1 of halogenated fire retardants and 1 ng mL−1 of PFCs in tap water (C) after preconcentration with UiO-66-NH2@Au and direct detection using SALDI-TOF MS.

In summary, we have synthesized an Au NP-loaded Zr based metal–organic framework using functionalized amino groups (UiO-66-NH2@Au). This was used as the SALDI matrix for the simultaneous measurement of low-mass organic contaminants. As a result of the perfect matrix performance and the strong affinity to organic pollutants of UiO-66-NH2@Au, PFCs, PCP, halogenated fire retardants, BPA, and hormones could be detected by SALDI-TOF MS analysis in a single run. Using the established SPE method coupled with the direct SALDI-TOF MS method, trace levels of halogenated fire retardants and PFCs could be analyzed simultaneously from several environmental water samples with high recoveries and reproducibility, implying the good resistance of the method to real samples. To the best of our knowledge, this is the first study that shows the possibility of establishing multi-residue methodology using nanomaterial-aided SALDI-TOF MS for the screening, identification and measurement of organic contaminants from water samples in a rapid, sensitive, cheap and easy-to-operate way.

Acknowledgements

We thank the National Basic Research Program of China (2015CB931903), the National Natural Science Foundation of China (21537004, 21477140, 21277152, 21277002), and the Strategic Priority Research Program of the Chinese Academy of Sciences (XDB14010201) for financial support.

Notes and references

  1. T. Portolés, E. Pitarch, F. J. López and F. Hernández, J. Chromatogr. A, 2011, 1218, 303–315 CrossRef PubMed.
  2. F. Hernández, M. Ibáñez, T. Portolés and M. I. Cervera, J. Hazard. Mater., 2015, 282, 86–95 CrossRef PubMed.
  3. R. Diaz, M. Ibáñez, J. V. Sancho and F. Hernández, J. Chromatogr. A, 2013, 1276, 47–57 CrossRef CAS PubMed.
  4. C. S. Pan, S. Y. Xu, H. J. Zhou, Y. Fu, M. L. Ye and H. F. Zou, Anal. Bioanal. Chem., 2007, 387, 193–204 CrossRef CAS PubMed.
  5. Z. Guo, Q. Zhang, H. Zou, B. Guo and J. Y. Ni, Anal. Chem., 2002, 74, 1637–1641 CrossRef CAS PubMed.
  6. X. Z. Zhou, Y. Y. Wei, Q. Y. He, F. Boey, Q. C. Zhang and H. Zhang, Chem. Commun., 2010, 46, 6974–6976 RSC.
  7. H. Kawasaki, K. Nakai, R. Arakawa, E. K. Athanassiou, R. N. Grass and J. Wendeli, Anal. Chem., 2012, 84, 9268–9275 CAS.
  8. Y. R. Ma, X. L. Zhang, T. Zeng, D. Cao, Z. Zhou, W. H. Li, H. Y. Niu and Y. Q. Cai, ACS Appl. Mater. Interfaces, 2013, 5, 1024–1030 CAS.
  9. X. Q. Yang, Z. A. Lin, X. P. Yan and Z. W. Cai, RSC Adv., 2016, 6, 23790–23793 RSC.
  10. Q. Liu, M. T. Cheng and G. B. Jiang, Chem.–Eur. J., 2013, 19, 5561–5565 CrossRef CAS PubMed.
  11. T. Seino, H. Sato, A. Yamamoto, A. Nemoto, M. Torimura and H. Tao, Anal. Chem., 2007, 79, 4827–4832 CrossRef CAS PubMed.
  12. L. G. Hu, S. Y. Xu, C. S. Pan, C. G. Yuan, H. F. Zou and G. B. Jiang, Environ. Sci. Technol., 2005, 39, 8442–8447 CrossRef CAS PubMed.
  13. X. S. Li, J. H. Wu, L. D. Xu, Q. Zhao, Y. B. Luo, B. F. Yuan and Y. Q. Feng, Chem. Commun., 2011, 47, 9816–9818 RSC.
  14. X. M. He, G. T. Zhu, J. Yin, Q. Zhao, B. F. Yuan and Y. Q. Feng, J. Chromatogr. A, 2014, 1351, 29–36 CrossRef CAS PubMed.
  15. J. Zhang, X. L. Dong, J. S. Cheng, J. H. Li and Y. S. Wang, J. Am. Soc. Mass Spectrom., 2011, 22, 1294–1298 CrossRef CAS PubMed.
  16. Y. H. Shih, C. H. Chien, B. Singco, C. L. Hsu, C. H. Lin and H. Y. Huang, Chem. Commun., 2013, 49, 4929–4931 RSC.
  17. Z. Lin, J. N. Zheng, G. Lin, Z. Tang, X. Q. Yang and Z. W. Cai, Anal. Chem., 2015, 87(15), 8005–8012 CrossRef CAS PubMed.
  18. Z. Lin, W. Bian, J. N. Zheng and Z. W. Cai, Chem. Commun., 2015, 51, 8785–8788 RSC.
  19. T. C. Chiu, L. C. Chang, C. K. Chiang and H. T. Chang, J. Am. Soc. Mass Spectrom., 2008, 19, 1343–1346 CrossRef CAS PubMed.
  20. C. Y. Shi, J. R. Meng and C. H. Deng, Chem. Commun., 2012, 48, 2418–2420 RSC.
  21. Q. Zhao, J. Xu, J. Yin and Y. Q. Feng, Anal. Chim. Acta, 2015, 889, 138–146 CrossRef CAS PubMed.
  22. N. Amini, M. Shariatgorji and G. Thorsén, J. Am. Soc. Mass Spectrom., 2009, 20, 12071213 CrossRef PubMed.
  23. C. S. Pan, S. Y. Xu, L. G. Hu, X. Y. Su, J. J. Ou, H. F. Zou, Z. Guo, Y. Zhang and B. C. Guo, J. Am. Soc. Mass Spectrom., 2005, 16, 883–892 CrossRef CAS PubMed.
  24. C. Y. Shi, J. R. Meng and C. H. Deng, J. Mater. Chem., 2012, 22, 20778–20785 RSC.
  25. Y. F. Huang and H. T. Chang, Anal. Chem., 2007, 79, 4852–4859 CrossRef CAS PubMed.
  26. V. Amendola, L. Litti and M. Meneghetti, Anal. Chem., 2013, 85, 11747–11754 CrossRef CAS PubMed.
  27. Y. J. Li, Y. T. Tseng, B. Unnikrishnan and C. C. Huang, ACS Appl. Mater. Interfaces, 2013, 5, 9161–9166 CAS.
  28. C. W. Tsao and Z. J. Yang, ACS Appl. Mater. Interfaces, 2015, 7, 22630–22637 CAS.
  29. H. Kawasaki, T. Sugitani, T. Watanabe, T. Yonezawa, H. Moriwaki and R. Arakawa, Anal. Chem., 2008, 80, 7524–7533 CrossRef CAS PubMed.
  30. R. Nayak and D. R. Knapp, Anal. Chem., 2010, 82, 7772–7778 CrossRef CAS PubMed.
  31. M. R. Yang and T. Fujino, Chem. Phys. Lett., 2014, 592, 160–163 CrossRef CAS.

Footnote

Electronic supplementary information (ESI) available: Experimental details and additional figures and tables. See DOI: 10.1039/c6ra19635g

This journal is © The Royal Society of Chemistry 2016
Click here to see how this site uses Cookies. View our privacy policy here.