Synthesis of dense arrays of multiferroic CoFe2O4–PbZr0.52Ti0.48O3 core/shell nanocables

D. Sallagoityab, C. Elissaldea, J. Majimela, M. Maglione*a, Vlad. A. Antoheb, F. Abreu Araujob, P. M. Pereira de Sáb, S. Basovab and L. Pirauxb
aCNRS, Univ. Bordeaux, ICMCB, UPR 9048, 87 Avenue du Docteur Schweitzer, 33600 Pessac, France. E-mail: mario.maglione@icmcb.cnrs.fr
bInstitute of Condensed Matter and Nanosciences, Université catholique de Louvain, Place Croix du Sud, B-1348, Louvain-la-Neuve, Belgium

Received 2nd August 2016 , Accepted 17th October 2016

First published on 27th October 2016


Abstract

A major challenge in the development of efficient magnetoelectric nanocomposites is the adequate control of the interfaces, in order to avoid the formation of undesirable interphases and to ensure an optimal strain mediated coupling. In this work we used a combination of low-cost impregnation and electrodeposition processes within the ordered nanochannels of a porous anodic alumina template, to elaborate CoFe2O4–PbZr0.52Ti0.48O3 core/shell nanocable arrays with high interfacial areas between the ferroelectric and the magnetic phases. We have shown in this way that the thermal annealing steps required for phase's crystallization and oxidation of metallic CoFe2 into spinel CoFe2O4 are critical with respect to interdiffusion phenomena through the interfaces. The impact of the processing temperature on the morphological and structural features of the nanocables was then discussed. We demonstrated that an optimization of process variables in the synthesis of CoFe2O4–PbZr0.52Ti0.48O3 nanocables allows a significant improvement in their microstructure and ensures the chemical integrity of the two-phase materials, an important concern when seeking for enhanced multiferroic properties.

Introduction

Magnetoelectric (ME) composites made by combining ferroelectric and magnetic phases are a novel class of next generation multifunctional materials that have drawn significant interest in recent years.1–6 In particular, the indirect strain mediated coupling interaction between piezoelectric and magnetostrictive phases could produce a large ME response, several orders of magnitude higher than that corresponding to single phase ME materials so far available at room temperature. This ME effect in composite materials is known as a product tensor property which results from the cross interaction between piezoelectric and magnetostrictive ordering of the two phases.1 ME composite architectures have been elaborated in several geometries like particles embedded in a matrix,7,8 co-sintered bilayered structures,9–11 as well as low-dimensionality heterostructures such as laminated and epitaxial auto-assembled vertical thin films12–15 or more recently, coaxial nanofibers.16–18

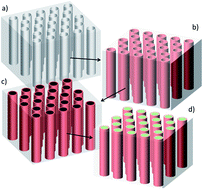
There is also a significant interest in the use of template-assisted synthesis methods due to their proven reliability, flexibility and reproducibility in order to build well-ordered tridimensional arrays of nanocables (NCs) with high aspect ratio and high surface areas.19–24 In a previous work,25 we reported the two-step elaboration of Ni–BaTiO3 (Ni–BTO) NC arrays within porous anodic aluminum oxide (AAO) templates and we pointed out the limitations inherent to annealing temperature.26,27 Thermal treatment performed at too high temperature: (i) may affect the ferroelectric BTO shell microstructure through defects-driven surface rearrangement and interdiffusion inside the AAO pores, or it (ii) may induce the template curvature and hence hinder the subsequent Ni electrodeposition into the BTO-coated AAO pores. Meanwhile, composites made of CoFe2O4–Pb(Zr0.52Ti0.48)O3 (CFO–PZT) are very appealing, as PZT with composition near the morphotropic phase boundary (MPB) exhibits excellent ferroelectric and piezoelectric properties, whereas CFO displays large magnetocrystalline anisotropy, high coercivity, and moderate saturation magnetization.1 Most of the studies devoted to PZT/CFO are based on electrospinning.28–30 Here we propose to built vertically oriented arrays of CFO–PZT NCs using a three-step process: (i) sol–gel impregnation of AAO templates and crystallization of the PZT shell on the pore walls, thus forming PZT nanotubes (NTs), (ii) CoFe2 (CF) metallic alloy electrodeposition within the PZT-coated AAO templates and (iii) in situ oxidation of the CF to obtain the desired CFO spinel cores. These processes are schematically illustrated in Fig. 1. Compared to the Ni–BTO NCs, the synthesis of CFO–PZT NCs implies an additional critical step consisting of an in situ oxidation process to reach the final magnetostrictive spinel phase. Taking into account the above-mentioned temperature-related limitations, the optimal thermal energy required for material crystallization should be thus carefully considered.


image file: c6ra19548b-f1.tif
Fig. 1 Schematics for the synthesis of the CFO–PZT NC arrays: (a) porous AAO template, (b) wet chemical deposition and crystallization of the PZT shells on the AAO pore walls, (c) electrodeposition of the CF cores within the PZT-coated AAO pores, and (d) CF conversion into CFO by in situ thermal oxidation.

In the present work, we studied the fabrication of CFO–PZT core–shell NCs within AAO, focusing on the annealing temperature effects. We showed the role of the PZT NTs as a diffusion barrier and the benefit of the direct in situ oxidation of metallic CF nanowires into CFO during the crystallization of NTs with regards to interface control. We took advantage of the flexibility of the combined impregnation–electrodeposition approach to lower the process temperature and to design nanocable with improved microstructure while ensuring a significant improvement in their microstructure and ensures the chemical integrity of the two-phase materials, an important concern when seeking for enhanced multiferroic properties.

Experimental section

Commercial AAO templates (Synkera Technology Inc., Longmont, CO, USA) were used as the nanoporous host for the process development. They featured a thickness of 50 μm with a mean pore diameter of 150 nm and an inter-pore distance (center-to-center distance between pores) around 250–300 nm, leading thus to a porosity of ∼15%.

The PZT sol was synthesized using lead acetate trihydrate Pb(CH3CO2)23H2O and titanium(IV) isopropoxide Ti(OCH(CH3)2) from Sigma Aldrich, as well as zirconium(IV) isopropoxide Zr(OCH(CH3)2) 70% wt from Alpha Caesar as precursors.31 Lead acetate trihydrate Pb(CH3CO2)23H2O was dissolved separately in glacial acetic acid at room temperature under magnetic stirring. Ti and Zr were dispersed in a second vessel containing isopropanol at room temperature under stirring. Then the two solutions were mixed under stirring at room temperature to form an homogeneous 0.4 M stoichiometric MPB PbZr0.52Ti0.48O3 sol. Water was added in the mixture to activate the complete hydrolysis of the alkoxides. AAO templates were immersed into the PZT sol during one minute. Wet faces were carefully dried with absorbent paper to remove the PZT film formed on the top, prior to the crystallization annealing. Two calcination temperatures for PZT crystallization were selected, i.e. 500 °C and 700 °C (referred to as PZT500 and PZT700 in the following) during 6 h in order to ensure complete crystallization of the PZT while preventing phase transformation of the amorphous alumina into α-Al2O3.25

Next, arrays of CF–PZT NCs have been fabricated by electrodeposition using a three-electrode potentiostatic setup with a Pt foil acting as counter electrode. The working electrode consisted of a Cu/Au (900/100 nm) bilayer subsequently evaporated onto one side of the PZT-impregnated AAO template to cover its pores. The CF metallic cores were then grown at room temperature, by applying a pulsed potential (oscillating between −1.5 V for 80 ms and −0.5 V for 20 ms) versus an Ag/AgCl reference electrode (KCl saturated), in an electrolyte containing 0.1 M FeSO4·6H2O, 0.1 M CoSO4·6H2O and 0.16 M H3BO3. The plating current was recorded as a function of time and the electrodeposition process was stopped before filling the PZT-coated AAO nanopores to preserve the one-dimensional core/shell CF–PZT structure considering the large volume expansion along the pore axis after metal deposition. The height of electrodeposited CF nanowires was thus limited to 10 μm. Ultimately, the dense arrays of CFO–PZT NCs were obtained after a subsequent annealing treatment at 500 °C or 600 °C for 24 h in air (referred to in the text as CFO500 or CFO600, respectively).

First, morphological and structural characterizations were performed after each processing step, using either scanning or transmission electron microscopy (HRSEM and STEM-BF) and/or in situ X-ray Diffraction (XRD). Second, magnetic characterization of the AAO-embedded core/shell NCs was carried out before and after the different thermal exposures, using a Superconducting Quantum Interference Device (SQUID) and/or an Alternating Gradient force Magnetometer (AGFM).

Results and discussion

PZT shell crystallization

HRSEM investigations were carried out to check PZT700 and PZT500 morphology and nanostructuration after the subsequent removal of the AAO template in a 1 M NaOH (aq.) solution (Fig. 2). In both cases, bundle of PZT tubular high aspect-ratio nanostructures were observed, driven by strong interactions between their hydrophilic surfaces. The amount of residual AAO (τAl) remained on their surfaces after the template removal was estimated from Energy Dispersive X-ray (EDX) analysis, according to the following equation:
 
image file: c6ra19548b-t1.tif(1)

image file: c6ra19548b-f2.tif
Fig. 2 HRSEM micrographs showing bundles of PZT700 (a) and PZT500 (c) tubular structures after the AAO template removal. (b) and (d) Corresponding higher magnification images. The pronounced granular aspect of the PZT700 structures can be observed in panel (b).

The obtained τAl mean value of 3 for PZT700 indicates that the etching process does not allow to fully remove the AAO for the sample annealed at 700 °C. This is supported by the fact that the PZT700 tubular structures were rough and granular as shown in Fig. 2(a) and (b).

Compared to BTO, PZT is a complex ternary system, and metastable binary oxides such as PbO, PbO2, ZrO2, TiO2, can be formed during the pyrolysis reaction occurring in the temperature range of 300–400 °C. The volatility of PbO is also a recurring issue. In contrast, it was shown that annealing temperatures up to 700 °C carry enough energy to induce Pb diffusion into AAO through oxygen vacancies.32 This phenomenon may thus promote crystallized interphases formation of Pb2Al2O5, PbAl12O19 or Al2TiO5 (Fig. 3(a)).


image file: c6ra19548b-f3.tif
Fig. 3 (a) Schematic illustrations of the Pb–Al interphase formation during PZT crystallization at 700 °C for 6 h inside the AAO template. The inset shows a magnified view at the interface between the two constituents, highlighting the diffusion process of Pb into the amorphous AAO. (b) A single PZT700 tubular structure obtained after the chemical dissolution of the AAO template, consisting in a tubular core/shell PZT/AAO system. (c) A single AAO-free PZT700 tubular structure after a 5 M μ-wave etching step.

Considering the small amount of PZT NTs and the complex diffusion process, thermogravimetric and XRD analyses did not allow a reliable identification and discrimination of interphases. However the presence of residual amorphous Al and Al-rich crystallized phases were unambiguously detected by HRSEM. From the microstructural analysis, we can thus deduce that (i) partially crystallized Al-rich interphase is formed under crystallization conditions at 700 °C for 6 h, and (ii) the AAO interphase cannot be fully removed using 1 M NaOH (aq.) wet etching conditions. Consequently, the PZT700 nanostructures revealed in these soft conditions consist in a tubular double-shell mixture of Al-rich interphases at the outer surface and pure PZT inside (as illustrated in Fig. 3(b)). Their high surface roughness (see Fig. 2(b)) can be thus explained by the formation of a granular shell made of Al-rich phase. Dissolution process was then performed in extreme conditions (5 M NaOH under μ-wave at 160 °C, followed by an ultrasonic dispersion in ethanol) in order to unambiguously evaluate PZT700 inner nanostructure (schematic representation in Fig. 3(c)). In comparison, PZT500 structures crystallized at lower temperature (500 °C) have thinner walls and present smooth and homogeneous surface after the AAO wet etching step (see Fig. 2(c) and (d)). The thickness of the PZT nanotubes was estimated close to 15 nm by STEM-EDX analysis. The mean τAl value calculated close to 0.1 indicates that the residual AAO was entirely removed and the formation of Al-rich interphase was prevented. As a result, pure PZT500 tubular structures with smooth outer surfaces were observed (see Fig. 2(d)).

CF electrodeposition within PZT-coated AAO and subsequent thermal conversion into CFO

Fig. 4(a) and (b) show cross-sectional views at two different magnifications through an array of CF–PZT700 NCs embedded in the AAO template. The filling of the PZT was homogeneous and the CF growth was stopped when the deposited height was about 10 μm. As expected, starting from the top three distinct phases are thus clearly evidenced (see Fig. 4(a)): the porous alumina template (dark grey), the PZT-coated AAO pores region (light gray) and the electrochemically-grown area of metallic CF solid cores (white). Such ordered arrays of AAO-embedded CF–PZT NCs were magnetically characterized to determine the impact of the NC architecture on the magnetic properties.
image file: c6ra19548b-f4.tif
Fig. 4 (a) HRSEM fracture image of a CF–PZT700 nanocable array embedded in the AAO template (150 nm pore diameter, 15% porosity). (b) Corresponding closed-up magnification of a single NC highlighting the three-phased AAO–PZT–CF morphology.

For the arrays of metallic CF nanowires, the magnetocrystalline anisotropy can be neglected and the effective field Heff in the saturated state is only determined by magnetostatic contributions, i.e. shape anisotropy and dipolar interaction. It can be thus expressed as:33

 
Heff = 2πMS − 6πMSP (2)
where 2πMS is the shape anisotropy, 6πMSP is the dipolar interaction field in the saturated state, with P the nanowire packing factor (corresponding to the template porosity, i.e. 15%, in case the whole cross section of the nanochannel array of the pristine AAO template is completely filled by CF) and MS = 1850 emu cm−3 is the saturation magnetization for CF. For comparison, an array of CF nanowires was prepared using the same electrochemical conditions and porous AAO template. Fig. 5 shows the normalized SQUID hysteresis loops measured at room temperature with the field applied along the revolution axis of the nanowires for the two samples (AAO-embedded CF nanowires and CF–PZT core/shell NCs).


image file: c6ra19548b-f5.tif
Fig. 5 Room temperature hysteresis loops measured with the external field applied along the revolution axis of the AAO-embedded CF nanowires (dashed line) and CF–PZT700 NCs (solid line).

As expected, the PZT–CF NCs sample is more easily magnetized than the CF nanowire sample counterpart. This is because of the NC morphology, which leads to a packing factor for the CF–PZT system smaller than for the purely metallic nanowire sample. As a result, the interaction field is smaller and leads to higher effective field and a stronger uniaxial anisotropy in the core/shell NCs. In contrast, the higher packing value of CF nanowires results in stronger dipolar interactions which are responsible for the shearing of the hysteresis loop.34

Recent papers reported the high reactivity of amorphous AAO in contact with metallic nanowires when increasing temperature, through the so called Kirkendall effect.35–37 Our preliminary oxidation tests performed at 600 °C during 24 h in air (corresponding to the usual conditions reported in most papers from literature38–42) within pure AAO templates have shown strong interdiffusion effects between Co, Fe and Al, and the formation of an Al-rich interphase between CFO600 oxidized nanowires and AAO. However, when considering PZT700 within AAO membranes, the reactivity between AAO and CF seems to be stabilized thanks to the PZT shell which acts as an efficient diffusion barrier layer. Fig. 6(a) and (b) show HRSEM images of oxidized CFO600–PZT700 NCs after chemical dissolution of the template, revealing that the core/shell morphology has been maintained after the CF oxidation process.


image file: c6ra19548b-f6.tif
Fig. 6 (a) and (b) HRSEM micrographs at different magnifications, showing the dense arrays of CFO600–PZT700 NCs after the AAO template etching in 1 M NaOH. (c) and (d) Micrographs at different magnifications acquired from the CFO500–PZT500 NCs prepared in similar conditions.

Mean τAl values for oxidized CFO600–PZT700 NCs were typically measured between 3.9 and 5.1. The oxidation step is thus followed by a significant increase of residual AAO in comparison with the PZT700 tubular structures (see Fig. 2(a) and (b)). In other words, interdiffusion between PZT shell and AAO template is enhanced during the second thermal treatment for converting CF into CFO at 600 °C.

Bright field (BF) STEM experiments coupled with EDX compositional mapping were performed on CFO600–PZT700 NCs following two different protocols for the sample preparation (Fig. 7). The elementary analysis evidences atomic diffusion of Pb inside the AAO template (Fig. 7(b)) and the presence of Al-rich crystallized interphase on the surface of single free NCs obtained after NaOH etching (Fig. 7(c) and (d)). As expected, the decrease of both PZT crystallization temperature from 700 °C to 500 °C and CF to CFO oxidation temperature from 600 °C to 500 °C leads to a significant decrease of τAl values (approximatively divided by 5 with respect to CFO600–PZT700 – see Fig. 6(c) and (d)). Similarly, the surface of free CFO500–PZT500 NC observed by STEM-BF after AAO template etching in 1 M NaOH (aq.) and dispersion in ethanol is smooth and well defined (see Fig. 7(e) and (f)).


image file: c6ra19548b-f7.tif
Fig. 7 (a) STEM-BF micrograph of the CFO600–PZT700 core/shell architecture within the AAO template after grinding and dispersion in ethanol. (c) The same sample after AAO etching in 1 M NaOH and dispersion in ethanol. (e) The CFO500–PZT500 system after template etching and dispersion in ethanol. (b, d and f) Corresponding chemical mapping, with Pb, Fe and Al represented in red, green and blue, respectively.

Accordingly, no contribution of Al (expected to appear in blue color on the chemical mapping image) occurs in such optimized annealing conditions. Therefore, from the electron microscopy investigations, it clearly appears that reduction of the temperature of crystallization of the PZT shells and of the temperature of metallic cores oxidation, leads to a significant improvement of both morphological and structural characteristics of the CFO–PZT core/shell assembly.

To further support the latter statements, CF to CFO oxidation inside pre-annealed PZT500 tubular structures was followed by in situ X-ray diffraction using a PANalytical diffractometer with cobalt anticathode (see Fig. 8). Taking into account the very low quantity of matter inside the AAO template and the strong nanostructuration of the phases (either for PZT shell or for CF core), specific preparation technics were developed in order to accurately and unambiguously determine the structural features of the CFO–PZT NCs. A PZT multi-impregnation process (three successive impregnations with intermediate crystallization steps) was carried out to provide thick enough tubular structures. Electrodeposition step was maintained longer to increase the CF height. The cubic CF (110) most intensive peak (52.4° for Co anticathode) represented by the black dotted line is surrounded by two peaks very close, attributed to PZT and Au (contribution of the Cu/Au bilayer cathode used for electrodeposition). However, the contribution of each phase can be easily discriminated when increasing the temperature. Progressive disappearance of the CF (110) peak is observed between 20 °C and 500 °C whereas CFO spinel phase starts to crystallize at 300 °C (green marked peaks (220), (311), (400), (511), and (440) at 35.7°, 41.6°, 50.7°, 63.0°, 67.5° and 74.4°, respectively).


image file: c6ra19548b-f8.tif
Fig. 8 CF to CFO in situ oxidation inside PZT followed by in situ X-ray diffraction at different temperatures with an increment of 100 °C. The starting room temperature CF pattern is represented in black and the final CFO oxidized one is in red.

This evolution indicates that the metallic CF and the oxide CFO coexist over a temperature range going from 300 °C to 500 °C. The intensity of spinel CFO peaks increases with temperature while the mid-height width decreases, in good agreement with a gradual increase in the crystalline size within the oxidized cores. Moreover, relative intensities of (220) (35.7°) and (440) (74.4°) peaks are raised meaning a preferential orientation of the CFO phase along (hk0) plans, possibly attributed to the highly anisotropic confinement given by the porous structure of the AAO template. We can then assume that CF to CFO oxidation should be effective at lower temperature than 600 °C. In addition PZT500 crystalline signature is evidenced by the presence of five peaks (marked in red on Fig. 8) that are attributed to a pseudo-cubic phase of Pb(ZrTi)O3, as confirmed by profile matching using EVA software. HRTEM investigation conducted on PZT NTs (not shown) confirmed the high crystallinity of PZT nanoparticles (mean diameter ranging between 5 and 10 nm). This size belongs to the critical range with regards to the alteration of ferroelectricity. However, it was clearly shown in literature that in confined 1D geometry, the contribution of defects, surface tension, strain induced domain configuration, effective screening of the surfaces charges by chemisorbed hydroxyl groups could locally stabilize a polar state.43–45

Fig. 9 shows the magnetic hysteresis curves with the external field applied parallel to the NC axis. For the CF nanowire arrays, magnetocrystalline anisotropy can be neglected and the effective anisotropy is entirely magnetostatic, as pointed out previously. In contrast, large coercivity fields and remanence have been achieved in the CFO nanowire arrays. Such high coercive fields are associated with the magnetocrystalline anisotropy, and also possibly since the grain size is approaching the single-domain critical value.38 The results show that oxidation performed at 600 °C during 24 h under air is followed by a significant decrease of the saturation magnetic moment by a factor 3.8 and by a large increase of the coercive field from few tens of Oe to 1100 Oe (Fig. 9(a)).


image file: c6ra19548b-f9.tif
Fig. 9 (a) Room temperature hysteresis loops measured with the external field applied along the revolution axis of the CF–PZT700 NCs (dashed line) and CFO600−PZT700 NCs (solid line) embedded in AAO templates, (b) the same as in (a) for CF–PZT500 NCs (dashed line) and CFO500−PZT500 NCs (solid line).

As shown in Fig. 9(b), oxidation at a lower temperature (500 °C) leads to a somewhat smaller reduction in the saturation magnetic moment (a factor 2.5) and coercive field (around 450 Oe). The coercive fields are comparable to the room temperature values reported in the literature for CFO/AAO systems.38–42

Conclusions

CFO–PZT NCs were successfully synthesized combining the cost effective impregnation and electrodeposition processes. The thermal treatment required to obtain the magnetostrictive spinel phase is a key step with respect to the interdiffusion phenomena. We showed that the PZT act as an efficient diffusion barrier between the CF cores and the AAO template. We overcame the thermal constraints and demonstrated the benefit of a global lowering of the processing temperature to preserve both architecture and structural integrity of this complex system. Such control of interfaces opens a promising pathway towards low-cost processing of magnetoelectric nanocomposites.

Acknowledgements

F. A. A. acknowledges the Research Science Foundation of Belgium (FRS-FNRS) for financial support (FRIA grant). The IDS FunMat European doctoral school is also acknowledged for financial support. The work was partially supported as well by the Fédération Wallonie-Bruxelles (ARC 13/18-052 Supracryst).

References

  1. C.-W. Nan, M. I. Bichurin, S. Dong, D. Viehland and G. Srinivasan, J. Appl. Phys., 2008, 103, 031101 CrossRef.
  2. L. W. Martin, S. P. Crane, Y.-H. Chu, M. B. Holcomb, M. Gajek, M. Huijben, C.-H. Yang, N. Balke and R. Ramesh, J. Phys.: Condens. Matter, 2008, 20, 434220 CrossRef.
  3. G. Schileo, Prog. Solid State Chem., 2013, 41, 87–98 CrossRef CAS.
  4. N. Spaldin and M. Fiebig, Science, 2005, 309, 391–392 CrossRef CAS PubMed.
  5. G. Srinivasan, Annu. Rev. Mater. Res., 2010, 40, 153–178 CrossRef CAS.
  6. W. Eerenstein, N. D. Mathur and J. F. Scott, Nature, 2006, 442, 759–765 CrossRef CAS PubMed.
  7. A. M. J. G. Van Run, D. R. Terrell and J. H. Scholing, J. Mater. Sci., 1974, 9, 1710–1714 CrossRef CAS.
  8. R. A. Islam and S. Priya, J. Mater. Sci., 2009, 44, 5935–5938 CrossRef CAS.
  9. J. Ryu, S. Priya, K. Uchino and H. E. Kim, J. Electroceram., 2012, 8, 107–119 CrossRef.
  10. K. Mori and M. Wuttig, Appl. Phys. Lett., 2002, 81, 100–101 CrossRef CAS.
  11. Z. Fang, S. G. Lu, F. Li, S. Datta, Q. M. Zhang and M. El Tahchi, Appl. Phys. Lett., 2009, 95, 11–13 Search PubMed.
  12. H. Zheng, J. Wang, S. E. Lofland, Z. Ma, L. Mohaddes-Ardabili, T. Zhao, L. Salamanca-Riba, S. R. Shinde, S. B. Ogale, F. Bai, D. Viehland, Y. Jia, D. G. Schlom, M. Wuttig, A. Roytburd and R. Ramesh, Science, 2004, 303, 661–663 CrossRef CAS PubMed.
  13. L. Yan, Y. Yang, Z. Wang, Z. Xing, J. Li and D. Viehland, J. Mater. Sci., 2009, 44, 5080–5094 CrossRef CAS.
  14. H. Zheng, F. Straub, Q. Zhan, P.-L. Yang, W.-K. Hsieh, F. Zavaliche, Y.-H. Chu, U. Dahmen and R. Ramesh, Adv. Mater., 2006, 18, 2747–2752 CrossRef CAS.
  15. J. Li, I. Levin, J. Slutsker, V. Provenzano, P. K. Schenck, R. Ramesh, J. Ouyang and A. L. Roytburd, Appl. Phys. Lett., 2005, 87, 072909 CrossRef.
  16. F. Yao, L. Xu, B. Lin and G.-D. Fu, Nanoscale, 2010, 2, 1348–1357 RSC.
  17. J. L. Shuhong Xie, F. Ma and Y. Liu, Nanoscale, 2011, 3, 3152–3158 RSC.
  18. Q. Zhu, Y. Xie, J. Zhang, Y. Liu, Q. Zhan, H. Miao and S. Xie, J. Mater. Res., 2014, 29, 657–664 CrossRef CAS.
  19. J. S. Andrew, J. D. Starr and M. A. K. Budi, Scr. Mater., 2014, 74, 38–43 CrossRef CAS.
  20. X. Liu, M. Li, Z. Hu, Y. Zhu, S. Dong and X. Zhao, Mater. Lett., 2012, 82, 57–60 CrossRef CAS.
  21. X. L. Liu, M. Y. Li, J. Wang, Z. Q. Hu, Y. D. Zhu and X. Z. Zhao, Appl. Phys. A, 2012, 108, 829–834 CrossRef CAS.
  22. M. Liu, X. Li, H. Imrane, Y. Chen, T. Goodrich, Z. Cai, K. S. Ziemer, J. Y. Huang and N. X. Sun, Appl. Phys. Lett., 2007, 90, 152501 CrossRef.
  23. S. H. Johnson, P. Finkel, O. D. Leaffer, S. S. Nonnenmann, K. Bussmann and J. E. Spanier, Appl. Phys. Lett., 2011, 99, 182901 CrossRef.
  24. T. N. Narayanan, B. P. Mandal, A. K. Tyagi, A. Kumarasiri, X. Zhan, M. G. Hahm, M. R. Anantharaman, G. Lawes and P. M. Ajayan, Nano Lett., 2012, 12, 3025–3030 CrossRef CAS PubMed.
  25. D. Sallagoity, C. Elissalde, J. Majimel, R. Berthelot, U. C. Chung, N. Penin, M. Maglione, V. A. Antohe, G. Hamoir, F. Abreu Araujo and L. Piraux, J. Mater. Chem. C, 2015, 3, 107–111 RSC.
  26. S. G. Yang, T. Li, L. S. Huang, T. Tang, J. R. Zhang, B. X. Gu, Y. W. Du, S. Z. Shi and Y. N. Lu, Phys. Lett. A, 2003, 318, 440–444 CrossRef CAS.
  27. Z. L. Xiao, C. Y. Han, U. Welp, H. H. Wang, W. K. Kwok, G. A. Willing, J. M. Hiller, R. E. Cook, D. J. Miller and G. W. Crabtree, Nano Lett., 2002, 2, 1293–1297 CrossRef CAS.
  28. S. H. Xie, J. Y. Li, Y. Qiao, Y. Y. Liu, L. N. Lan, Y. C. Zhou and S. T. Tan, Appl. Phys. Lett., 2008, 92, 062901 CrossRef.
  29. Y. Xie, Y. Ou, F. Ma, Q. Yang, X. Tan and S. Xie, Nanosci. Nanotechnol. Lett., 2013, 5, 546–551 CrossRef CAS.
  30. S. Xie, F. Ma, Y. Liu and J. Li, Nanoscale, 2011, 3, 3152–3158 RSC.
  31. B. A. Hernandez, K. Chang, E. R. Fisher and P. K. Dorhout, Chem. Mater., 2002, 14, 480–482 CrossRef CAS.
  32. S. D. B. Jin Kyu Han and J. kim, J. Appl. Phys., 2012, 112, 034106 CrossRef.
  33. A. Encinas-Oropesa, M. Demand, L. Piraux, I. Huynen and U. Ebels, Phys. Rev. B: Condens. Matter Mater. Phys., 2001, 63, 104415 CrossRef.
  34. F. Zighem, T. Maurer, F. Ott and G. Chaboussant, J. Appl. Phys., 2011, 109, 013910 CrossRef.
  35. L. Qin, G. A. Jones, T. H. Shen, P. J. Grundy, W. X. Li and K. J. Abrams, Mater. Lett., 2010, 64, 2685–2687 CrossRef CAS.
  36. F. Wang, H. Huang and S. Yang, J. Eur. Ceram. Soc., 2009, 29, 1387–1391 CrossRef CAS.
  37. S. Prasad and A. Paul, Appl. Phys. Lett., 2007, 90, 2005–2008 CrossRef.
  38. G. Ji, S. Tang, B. Xu, B. Gu and Y. Du, Chem. Phys. Lett., 2003, 379, 484–489 CrossRef CAS.
  39. Y. Xu, D. S. Xue, D. Q. Gao, J. L. Fu, X. L. Fan, D. W. Guo, B. Gao and W. B. Sui, Electrochim. Acta, 2009, 54, 5684–5687 CrossRef CAS.
  40. A. Pirouzfar and S. A. Seyyed Ebrahimi, J. Magn. Magn. Mater., 2014, 370, 1–5 CrossRef CAS.
  41. J.-S. Jung, J.-H. Lim, K.-H. Choi, S.-L. Oh, Y.-R. Kim, S.-H. Lee, D. A. Smith, K. L. Stokes, L. Malkinski and C. J. O'Connor, J. Appl. Phys., 2005, 97, 10F306 Search PubMed.
  42. D. Carlier and J.-P. Ansermet, J. Electrochem. Soc., 2006, 153, C277–C281 CrossRef CAS.
  43. J. Kim, S. A. Yang, Y. C. Choi, J. K. Han, K. O. Jeong, Y. J. Yun, D. J. Kim, S. M. Yang, D. Yoon, H. Cheong, K.-S. Chang, T. W. Noh and S. D. Bu, Nano Lett., 2008, 8, 1813–1818 CrossRef CAS PubMed.
  44. Z. Hua, P. Yang, H. Huang, J. Wan, Z.-Z. Yu, S. Yang, M. Lu, B. Gu and Y. Dua, Mater. Chem. Phys., 2008, 107, 541–546 CrossRef CAS.
  45. J. E. Spanier, A. M. Kolpak, J. J. Urban, I. Grinberg, L. Ouyang, W. S. Yun, A. M. Rappe and H. Park, Nano Lett., 2008, 6, 735–739 CrossRef PubMed.

This journal is © The Royal Society of Chemistry 2016
Click here to see how this site uses Cookies. View our privacy policy here.