Solvothermal preparation of Ag nanoparticle and graphene co-loaded TiO2 for the photocatalytic degradation of paraoxon pesticide under visible light irradiation

Amir Homayoun Keihana, Reza Hosseinzadehb, Mousa Farhadianc, Hamid Kooshkid and Ghader Hosseinzadeh*e
aMolecular Biology Research Center, Baqiyatallah University of Medical Science, Tehran, Iran
bMedical Laser Research Center, ACECR, Tehran, Iran
cDepartment of Materials Engineering, Isfahan University of Technology, Isfahan, Iran
dNanobiotechnology Research Center, Baqiyatallah University of Medical Science, Tehran, Iran
eYoung Researchers and Elite Club, West Tehran Branch, Islamic Azad University, Tehran, Iran. E-mail: ghader87@gmail.com; Fax: +98-21-82482562; Tel: +98-21-82482562

Received 1st August 2016 , Accepted 25th August 2016

First published on 30th August 2016


Abstract

The growing use of organophosphorus compounds such as paraoxon as agriculture pesticides results in their accumulation in soils and groundwater. Therefore there is a high demand for developing efficient methods for removing these materials from contaminated environmental resources. In this study, Ag nanoparticle and graphene co-loaded TiO2 with various contents of Ag and graphene was prepared via a facile surfactant free solvothermal method in a mixture of water and ethanol solvents and was applied, for the first time, for the photocatalytic degradation of paraoxon (as a model organophosphorus compound) under visible light irradiation. In this ternary nanocomposite, the presence of Ag nanoparticles is for narrowing the band gap to the visible region due to its surface plasmon resonance (SPR) effect and the presence of graphene is for diminishing the recombination rate of the photogenerated electron and holes due to its high electrical conductivity. The results of photocatalytic activity tests demonstrate that the nanocomposite with 6% wt Ag and 1% wt graphene content has the best photocatalytic activity among the products. Investigation of the chemical state of the nanocomposites showed that the covering of Ag nanoparticle loaded TiO2 with a high weight ratio of graphene resulted in the formation of Ag–O bonds through bonding of Ag to the oxygen functional groups of graphene which causes a decrease of the SPR effect of Ag and by this way decreases the photocatalytic activity. Gas Chromatography-Mass Spectrometry (GC-MS) was used as analytical tool for determination of the photocatalytic reaction intermediates. GC-MS analysis results show that photodegradation of paraoxon produces 4-nitrophenol, di-ethylphosphate, mono-ethylphosphate, hydroquinone and hydroxyhydroquinone as major intermediates and subsequent photodegradation of these results in complete mineralization of paraoxon.

1. Introduction

Organophosphorus compounds are widely used as pesticides worldwide and about 38% of the total used pesticides are these compounds.1 The toxicity of these compounds is attributed to their irreversibly binding to the acetylcholine esterase (AChE) enzyme and inhibiting the normal function of AChE with hindering of the hydrolysis of acetylcholine and a subsequent accumulation of acetylcholine in the body.2 In spite of their usefulness as agricultural pesticides, the growing use of these compounds has increased the environmental contamination of soils and groundwater. Therefore, the development of effective methods for water treatment from these poisonous materials is a major challenge for researchers. Currently used methods for water treatment for these poison materials include homogeneous and heterogeneous hydrolysis,3 photolysis,4 biodegradation,5 and photochemical degradation.6

Clearly, photocatalytic treatment, as one of the green technologies, has been recognized as an ideal and promising technique to eliminate the organic pollutants from aqueous environments by utilizing solar energy, for this reason, during the past decades, this technique has attracted vast attention.7 Because of its strong oxidizing power under ultraviolet irradiation, environment-friendly, high chemical stability, and low production cost, among all the other photocatalysts studied so far TiO2 semiconductor is the most attractive and leading photocatalyst in this field.8 However, TiO2 suffers from its relatively large intrinsic band gap energy (>3.2 eV), and therefore absorbs radiation only in UV region (∼5% of solar light).9 Therefore, reducing the band-gap energy of TiO2 for visible light absorption could significantly enhance the photocatalytic activity of TiO2 under the solar light irradiation.10 Moreover, separation of the photo-induced electron–hole pairs and their transferring to the surface active sites play an important role in photocatalytic activity enhancement because by this way fast electron–hole recombination rate could be suppressed.11 To enhance the visible light absorption and also reducing the fast electron–hole recombination in semiconductor photocatalysts, there are some approaches including: using porous TiO2 instead of solid TiO2, decoration of TiO2 surface with other material such as graphene, carbon nanotube and SiO2, doping with noble metals, transition metal or nonmetal materials and so on.12–16

Owning to their individual benefits including excellent optical, catalytical and antibacterial properties, incorporating of the noble metals in TiO2 has attracted tremendous research interests.17 Due to the surface plasmon resonance (SPR) effects of the Ag nanoparticles, it has been shown that incorporating of Ag nanoparticles in semiconductors structure such as TiO2 could improves the photocatalytic efficiency of that semiconductor and furthermore could red shifts the light absorption of that semiconductor in to the visible light region.18,19 Moreover, because of their high electric conductance, the Ag nanoparticles can also reduce the recombination of photo-generated electron hole pairs by transferring of the electrons to its surface.18

Because of its excellent electrical and thermal conductivity, superior mechanical strength and high specific surface area, nowadays, graphene arouse great interest among scientists in various fields.20 This unique properties of graphene made it as an excellent candidate to form hybrid structures with other materials such as semiconductors, metals, and polymers for improving the performance of these base materials in many application fields such as energy, water treatment, catalysis, and electronic fields.21 Due to its high electron mobility and extended π-electron conjugation, graphene can also reduce the recombination of photogenerated electron–hole pairs in photocatalysts.22 In summary, the photocatalytic properties of graphene-based photocatalysts are influenced by several factors, such as the electrical properties of graphene sheets, the interfacial contact and charge transfer between graphene and photocatalyst.23

In this work, Ag nanoparticle loaded TiO2 was prepared through photo-reduction method by UV irradiation of solution containing Ag+, TiO2 nanoparticles and formic acid as a sacrificial component. After photo-reduction step, graphene oxide powder was added to this solution and Ag nanoparticle and graphene co-loaded TiO2 were prepared via simple surfactant free solvothermal in mixture of water and ethanol solvents. This ternary nanocomposite was used, for the first time, for photocatalytic degradation of paraoxon pesticide. For increasing the photocatalyst efficiency, Ag and graphene contents of this nanocomposite was optimized.

2. Experimental

2.1. Chemicals and reagents

Titanium dioxide nanoparticles with 70% anatase and 30% rutile structure (P25) was purchased and used as received from Degussa, Germany. Paraoxon was purchased in analytical grade from Sigma-Aldrich. Graphite powder, KMnO4, K2S2O8, P2O5, NaOH, formic acid and silver nitrate, all in analytical grade, were purchased from Merck (Germany).

2.2. Synthesis of graphene oxide (GO)

Graphene oxide (GO) was synthesized from graphite powder by modified Hummers method in two steps including pre-oxidizing and oxidizing process. Graphite powder (2 g) was put into a mixture of 12 mL of concentrated H2SO4 (18 M), 2.5 g of K2S2O8, and 2.5 g of P2O5. The solution was heated for 24 h at temperature of 80 °C. The above mixture was diluted with 500 mL of deionized (DI) water, and after filtering washed with DI water until the pH naturalization. This pre-oxidized graphite was then subjected to oxidation process. The pre-oxidized graphite powder was added to a mixture of 120 mL of concentrated H2SO4 (18 M) and 30 mL of concentrated HNO3 (15 M) under vigorous stirring in an ice water bath. 15 g of KMnO4 was added to this solution at temperature of 20 °C. After 96 h stirring at room temperature, the mixture was diluted with 1 L of DI water and 20 mL of 30% H2O2 solution was added to end the oxidation. The resulted GO precipitate was separated by centrifuge (10[thin space (1/6-em)]000 rpm) and washed with 1[thin space (1/6-em)]:[thin space (1/6-em)]10 HCl aqueous solution and DI water to remove any water-soluble byproducts.

2.3. Synthesis of Ag nanoparticle and graphene co-loaded TiO2

TiO2 suspension was prepared by dispersing of 0.15 g TiO2 nanoparticles in 60 mL deionized water at pH 2 (using 1 M nitric acid). A given amount of Formic acid and silver nitrate (the molar ratio of formic acid to silver nitrate was 10[thin space (1/6-em)]:[thin space (1/6-em)]1) were added to this suspension and after 2 h stirring in dark condition, the mixture was subjected to UV light irradiation source for reducing of Ag+ to Ag ‎nanoparticles. In this process, formic acid acts as a reducing agent for reduction of silver cations. After complete photo-reduction of Ag+ to Ag ‎nanoparticles, a desired amount of graphene oxide (GO) powder was ultrasonically dispersed in this solution and the solution pH was adjusted to 7 (using 1 M NaOH solution). After addition of 30 mL anhydrous ethanol, the mixture solution was transferred into a 100 mL Teflon-lined stainless steel autoclave and heated to 120 °C for 24 h. After solvothermal treatment, the resulted product was centrifuged, washed and finally dried in air at 60 °C.

In this work for obtaining the optimum contents of Ag and graphene in the nanocomposite structure, a series of Ag and graphene co-loaded TiO2 nanocomposites with various contents of Ag and graphene were prepared and their photocatalytic activity were compared with each other. According to the results of our photocatalytic activity test (Section 4), among the only Ag nanoparticle loaded TiO2 nanocomposites with 1, 2, 4, 6 and 8 wt% silver content (which named as AT1, AT2, AT4, AT6 and AT8 respectively) TiO2 with 6 wt% Ag content (AT6) has the best photocatalytic activity thus in preparing Ag and graphene co-loaded TiO2 nanocomposites with 0.5, 1, 1.5, and 2 wt% graphene contents (which named as AT6-G0.5, AT6-G1, AT6-G1.5 and AT6-G2 respectively) only this percentage of Ag content in nanocomposite structure was used. For comparison, an only graphene loaded TiO2 nanocomposites with 1 wt% graphene content (which named as T-G1) was also prepared by similar procedure.

2.4. Catalyst characterization

XRD experiment was carried out by Philips X'Pert MPD Pro X-ray diffractometer with Co-Kα irradiation (λ = 1.54018 Å). Diffuse reflectance UV-Vis spectra were recorded in the reflectance ‎mode using Avaspec-2048-TEC in the wavelength range 200–700 nm. The surface morphology and size of products was characterized by TESCAN VEGA-3 scanning electron microscopy (SEM) and Philips CM30 transmission electron microscopy (TEM). Brunauer–Emmett–Teller technique (Belsorp II, mini Japan) was used for investigation of shape and pore size distribution and also surface area. X-ray photoelectron spectroscopy (XPS) spectra of the samples was acquired by using a Gamma-data-scienta ESCA 200 hemispherical analyzer equipped with an Al Kα X-ray source (1486.6 eV). All binding energy values were corrected by calibrating the C 1s peak at 284.6 eV. For comparison the photo-generated electron–hole recombination rates of the different photocatalysts, photoluminescence (PL) emission spectra of the as prepared photocatalysts were recorded via VARIAN (Cary Eclipse) fluorescence spectrophotometer, with an excitation wavelength of λex = 300 nm. Ag and Ti contents of the photocatalysts were measured by inductively coupled plasma-atomic emission spectrophotometer (ICP-AES, Arcos EOP, Spectro, Germany). For measurement of the carbon contents of the photocatalysts, the CHN elemental analysis was performed by an ECS4010 Costech elemental analyzer (Italy).

2.5. Evaluation of photocatalytic performance and determination of photodegradation intermediates

The photocatalytic activity of as-prepared samples (TiO2-P25, AT, and AT6-G with different amount of GO loading) was evaluated by photodegradation test of paraoxon, as a model of organophosphorus compounds. In this work, as an irradiation source, a 570 W xenon lamp (OSRAM Co) was used and a L41 UV filter (Kenko Co.) was employed to remove UV light (λ < 400 nm). Reaction suspensions were prepared by adding 20 mg of different photocatalyst powder into a 100 mL aqueous solution of paraoxon with an initial concentration of 31 mg L−1. Prior to irradiation, the suspension was magnetically stirred in a dark condition for 2 hours to establish an adsorption–desorption equilibrium condition. Then the suspension containing pollutant and photocatalyst were irradiated under the visible light with constant stirring. For keeping the temperature of solution at 25 °C, water circulation was used around the reaction container (Fig. S1). At given time intervals, a fixed quantity of the suspension (5 mL) was taken and immediately centrifuged for extraction of photocatalyst, then the remaining concentration of paraoxon was analyzed by VARIAN (100 Bio) UV-visible spectrophotometer (Fig. S2 absorption spectra of paraoxon). The above procedure was repeated three times for photocatalytic activity evaluation of each photocatalyst.

In order to ascertain the reactive species (hvb+, OH˙ and O2˙ radicals) responsible for the photocatalytic activity of the photocatalysts, three different scavengers were used: KI as an hvb+ scavenger, tert-butanol (tBuOH) as an OH˙ scavenger and benzoquinone as an O2˙ scavenger.24 For this purpose, before the irradiation, these scavengers were added to the reaction suspension (containing paraoxon and photocatalyst) with initial concentration of 100 mM, and then the photocatalytic activity measurements were repeated in presence of these scavengers.

For intermediates identification, 2 mL of the irradiated suspension was sampled and centrifuged to remove the photocatalyst and then analyzed by Gas Chromatography (GC) (6890 N-Alilent) and Mass Spectroscopy (MS) (5973-Alilent) with DB 5 MS capillary column of 0.25 mm inner diameter, 0.25 μm thickness and 30 meters length. In GC-MS analysis, the column temperature was held at 50 °C for 2 min, then increased to 300 °C with ramp of 15 °C min−1, and finally held at this temperature for 37 min. Electron Ionization mass spectra were identified using NIST 2002 Library (Wiley) and most of these compounds were automatically identified by the NIST MS-search software. For evaluation the mineralization of paraoxon, total organic carbon (TOC) measurements were performed by using a Shimadzu TOC-VCSH total organic carbon analyzer.

According to our photocatalytic activity test results (Section 4), AT6-G1 has the best photocatalytic activity among others, and therefore in characterization section only TiO2 nanoparticles, AT6 and AT6-G1 were characterized.

3. Results and discussion

3.1. Characterization

XRD. Fig. 1 shows the X-ray diffraction pattern for the Degussa P25 TiO2, AT6, and AT6. The peaks at 2θ = 25.1°, 37.8°, 48°, 54.2°, 55.2°, 62.8°, 68.9° and 60.7° confirmed the presence of anatase phase (JCPDS no. 21-1272) and the peaks at 2θ = 27.4° and 36.2° confirmed the presence of rutile phase (JCPDS no. 21-1276) of the Degussa P25 TiO2 nanoparticles (Fig. 1(a)). As Fig. 1(b) shows after Ag loading into TiO2, the 2θ positions of major diffraction peaks in AT6 have similar values with pristine TiO2, except the additional peak at 2θ = 44.2° which can be attributed to the (200) crystalline plane of metallic silver (JCPDS no. 04-0783) thus presence of Ag don't interfere in the crystal structure of base TiO2 and as the TEM results show (as will be discussed later), Ag atoms form separate Ag nanoparticles at the TiO2 surface. Fig. 1(c) depicts the XRD pattern of the AT6-G1 nanocomposite. Again the characteristic peaks of TiO2 can be seen in this pattern without any significant change in 2θ position, except that the relative intensity of the peak attributed to Ag metal that was decreased in this pattern in comparison with Fig. 1(b). Due to the formation of Ag–O bond between Ag and oxygen functional groups of GO after solvothermal process, the peak assigned to the Ag metal at 2θ = 44.2° in the XRD pattern of AT6-G1 sample was decreased. According to the literatures, the main characteristic peak of Ag2O must be appeared in 2θ ∼ 38° (ref. 25) but in the case of AT6-G1 sample no peak associated to this compound was observed which could be related to the low concentration of this compound or overlapping of its characteristic peak with TiO2 peaks, however, other characterization methods such as XPS (as will be discussed in later sections) demonstrated the presence of this compound. A separate peak for GO at 2θ value of 25° was not observed, which is presumably due to the reduction of GO to graphene. Notably, no typical diffraction peaks belonging to the graphene separate sheets are observed in the AT6-G1 nanocomposite diffraction pattern. The reason could be related to the fact that the main characteristic peak of graphene at 24.5° may be shielded by the main peak of anatase TiO2 at 25.4°.26
image file: c6ra19478h-f1.tif
Fig. 1 XRD patterns of (a) P25, (b) AT6, and (c) AT6-G1.
DRS. The optical absorption characteristic of TiO2 (P25), AT6, and AT6-G1 samples were demonstrated in Fig. 2. In comparison with absorption spectra of P25, a considerable red shift to visible region was clearly observed in absorption spectra of AT6, and AT6-G1 samples indicating narrowing of P25 band gap with compositing with Ag and graphene. An absorption band about 500 nm was observed for AT6, and AT6-G1 samples which according to literatures is related to the surface plasmon resonance absorption of Ag nanoparticles.27 In comparison with AT6, the relative intensity of this absorption band in AT6-G1 was decreased that may be related to the formation of Ag–O bond between Ag and oxygen functional groups of GO. The band-gap energy (Eg) values for all samples can be estimated by using Tauc's equation:
 
αhν = A(Eg)n/2 (1)
where α, h, ν, A, and Eg are the absorption coefficient, Planck's constant, light frequency, constant value, and band-gap energy, and n is 1 and 4 for a direct- and indirect-band-gap semiconductor, respectively.28 The plot of (αhν)1/2 versus hν for TiO2 base semiconductor (indirect-band-gap semiconductor) is shown in inset of Fig. 2, and the Eg values are calculated by estimating the intercept of the tangent to the plot. The estimated band-gap energy (Eg) of TiO2 (P25), AT6, and AT6-G1 samples are 3.3, 2.69 and 2.64 eV respectively. Therefore addition of graphene to AT6 has slight effect on the band gap narrowing of base semiconductor.

image file: c6ra19478h-f2.tif
Fig. 2 UV-Vis absorption spectra of P25, AT6, and AT6-G1 samples (inset: band gap energy measurements of P25, AT6, and AT6-G1 samples from Tauc plot).
SEM and TEM images. Scanning electron microscopy (SEM) was used to investigate the surface morphology of the as-prepared photocatalysts (TiO2-P25, AT6, GO samples) as shown in Fig. 3. As Fig. 3(a) shows TiO2-P25 nanoparticles has spherical morphology with size in range of 30–70 nm. Compositing of TiO2 with Ag cause the increasing of particles size. As shown in Fig. 3(b), surface morphology of P25 and AT6 samples are the same (spherical) without significant change. As reported in previous works, acidic condition and increasing of the ionic strength of solution may lead to decreasing of the thickness of electrical double layer (EDL), which nanoparticles agglomeration and particle size growth increases in such condition.29,30 Because of the preparation of AT6 sample in acidic condition (pH = 2), size of AT6 sample has been increased in comparison with size of P25. The surface morphology of GO sample was depicted in SEM image of Fig. 3(c). According to this image GO sample are formed from the large, smooth and thin sheets. SEM image of AT6-G1 (Fig. 3(d)) depicts attachment of AT6 nanoparticles to the graphene sheets, which this process causes agglomeration of the AT6 nanoparticles to some extent.
image file: c6ra19478h-f3.tif
Fig. 3 SEM images of (a) P25, (b) AT6, (c) GO, and (d) AT6-G1 samples.

Transmission electron microscopy have been used for measurement particle size of AT6-G1 nanocomposite and also for surveying presence of Ag nanoparticles and graphene sheets in this sample. As depicted in Fig. 4 the average particle size of AT6 particles is 70 nm. Graphene sheets clearly could be seen in this image. As this figure shows AT6 particles are agglomerated on the surface of graphene sheet and therefore graphene sheets could act as agglomeration agent, to some extent. Some fine particles could be seen on the surface of AT6 nanoparticles which in magnified image clearly could be seen and we think that they are Ag nanoparticles with size in the range of 5–10 nm. In bright-field TEM image, because of the mass contrast, particles with high atomic number (Ag) are observed darker.31


image file: c6ra19478h-f4.tif
Fig. 4 TEM image of AT6-G1 sample (inset: Ag nanoparticles at the surface of AT6-G1).

Energy-dispersive X-ray spectroscopy (EDS) elemental analysis was used for determination the presence of Ti, O, Ag and C elements in AT6-G1 nanocomposite (Fig. 5). The co-existence of Ti, O, Ag and C elements in the AT6-G1 nanocomposite proves successful compositing of Ag and graphene with TiO2 nanoparticles.


image file: c6ra19478h-f5.tif
Fig. 5 EDS elemental analysis of AT6-G1 sample.
N2 adsorption–desorption isotherms. To investigate the surface area of AT6 NPs and AT6-G1 nanocomposites nitrogen adsorption–desorption isotherms was used. The results this test have been illustrated in Fig. 6. Both AT6 NPs and AT6-G1 nanocomposites show the type ІІІ isotherm features with H3 hysteresis loop which according to the IUPAC classification in materials with this type isotherm, there is a weak interaction between adsorbent and adsorbate and these materials are mesoporous.32 By compositing of AT6 with graphene in AT6-G1 nanocomposite, the hysteresis loop becomes larger, indicating decreasing of average pore-size and increasing of average pore-volume. For specific surface area determination of these two samples, the BET plots of them have been shown in Fig. 6(b). The measured specific surface area AT6 NPs and AT6-G1 nanocomposites were 48.31 and 67.72 m2 g−1, respectively. So incorporating of 1 wt% graphene in AT6 NPs causes about 40% increment in its specific surface area. Increasing of the effective surface area of photocatalyst has a vital role in decreasing of mass transfer limitation of pollutant to its surface and by decreasing of mass transfer limitation, the photocatalytic activity of photocatalyst could be improved. This effect is another merit of the graphene incorporating in photocatalysts.
image file: c6ra19478h-f6.tif
Fig. 6 (a) N2 adsorption–desorption isotherm, and (b) BET plot of AT6, and AT6-G1 photocatalysts.
Photoluminescence (PL) spectroscopy. Photoluminescence (PL) spectroscopy provides useful information about the charge separation and recombination rate of photo-generated electron and holes.39 The intensity of the fluorescence is directly proportional to the electron–hole recombination rate, that is, the faster the recombination rate, the greater the fluorescence intensity, and vice versa. As the results of the PL spectroscopy of the as prepared photocatalysts in Fig. 7(a) indicates, with increasing the Ag contents of AT samples, the fluorescence intensity and, consequently, the electron–hole recombination rates decreases. However, increasing the Ag contents up to the 6 wt% has a negligible effect on the electron–hole recombination rate. As reported in the literatures, in high loading of metals in to the TiO2, the metal atoms can act as a recombination center and thereby enhance the recombination rate of photo-generated electron hole pairs.40 In the case of graphene addition in to the TiO2 or AT structures (Fig. 7(b)), presence of graphene at 0.5 and 1 wt% decreases the electron–hole recombination rate. However, increasing of the graphene contents to 1.5 or 2 wt% increases the electron–hole recombination rate. As will be discussed in XPS section, formation of the Ag–O bond between Ag and unreduced GO, during the solvothermal treatments, could be the reason of this phenomenon.
image file: c6ra19478h-f7.tif
Fig. 7 Comparison the PL spectra of the different photocatalyst at λex = 300 nm.
XPS. The surface composition and chemical state of the AT6, AT6-G1 and AT6-G2 were further investigated using X-ray photoelectron spectroscopy. Fig. 8(a) represents the XPS survey spectrum of AT6, demonstrating the presence of Ag, Ti, and O elements in this nanocomposite and thus successful compositing of Ag with P25. Fig. 8(b) shows the XPS survey spectrum of AT6-G1 and the presence of C, Ag, Ti, and O elements again confirm successful compositing of graphene sheets with AT6 nanoparticles.
image file: c6ra19478h-f8.tif
Fig. 8 Survey XPS spectrum of (a) AT6 and (b) AT6-G1.

For precise analysis of chemical state(s) of each element, core level XPS spectrum of each element in different nanocomposites were shown in Fig. 9. Fig. 9(a) demonstrates the core level XPS spectrum of O 1s in AT6 nanocomposite which could be deconvoluted to two peaks located at 529.5 eV and 531.1 eV, attributed to the O in the Ti–O and Ag–O states respectively.33 The Ti core level XPS spectrum of AT6 (Fig. 9(b)) indicates two peaks centered at 459.5 eV and 464.97 eV, assigned to the Ti 2p3/2 and Ti 2p1/2, respectively confirming the existing of Ti mainly in the Ti(IV) state. According to the literatures, each silver species showed two peaks, owning to Ag 3d5/2 and Ag 3d3/2 transitions. The peaks related to the metallic silver (Ag) are centered at 368.3 and 374.3 eV,34 while the peaks related to the Ag–O bond are centered at 367.7 eV and 373.7 eV.35 Thus in AT6 metallic silver Ag is dominant with slight amount of Ag–O bond. Overall, according to the results of Fig. 9(a)–(c) Ag atoms bind to the surface of TiO2 trough Ag–O bond. Fig. 9(d) shows the C 1s core level XPS spectrum region of graphene in AT6-G1 sample. The peak at 284.5 eV is attributed to the sp2 carbon atom of graphene and the other peaks at higher binding energies are assigned to the oxygenated carbon species of GO, such as C–OH, C[double bond, length as m-dash]O, COOH, etc.36 Although, the Raman spectroscopy study demonstrates reduction of GO to graphene during compositing with AT6 in solvothermal process, however, the XPS result shows that GO reduction is not complete and there are some oxygen functional groups at graphene surface. If the Fig. 9(c), (e) and (f) (which are related to Ag 3d core level XPS spectrum of AT6, AT6-G1 and AT6-G2 samples, respectively) are compared with each other, it could be clearly proved that with increasing graphene (or GO) content in AT6-G nanocomposites, the formation of Ag–O bond between Ag and oxygen functional groups of GO increases.37 This effect was discussed by Kim et al. for Ag–GO composite.38 As the metallic Ag with its SPR effect plays the main role in band gap narrowing of TiO2 (Fig. 2), thus graphene (or GO) must be added in an optimum amount to AT6-G nanocomposites in order to get the benefits of Ag and graphene together.


image file: c6ra19478h-f9.tif
Fig. 9 (a), (b) and (c) Core level XPS spectrum of O 1s, Ti 2p, and Ag 3d of AT6 sample respectively. (d) and (e) Core level XPS spectrum of C 1s, and Ag 3d of AT6-G1 sample respectively. (f) Core level XPS spectrum of Ag 3d of AT6-G2 sample.

According to the results of ICP-AES and elemental analysis tests, AT6 contains 5.53% of Ag and 53.1% of Ti content, AT6-G1 contains 5.17% of Ag, 52.6% of Ti, and 0.72% of C content, and AT6-G2 contains 4.94% of Ag, 51.9% of Ti, and 1.31% of C content. As these results indicates, during the solvothermal process for preparation of the nanocomposite, and with increasing of the graphene content of the nanocomposite, some of the Ag atoms were released from the AT6 surface which this phenomenon could influence on the photocatalytic activity of this composite.

3.2. Photocatalytic activity and reaction pathway

Photocatalytic activity measurements. The adsorption of contaminates molecules is a prerequisite for good photocatalytic activity.41 Fig. S3 displays the remaining percentage of paraoxon after reaching the adsorption equilibrium in the dark condition over the different photocatalysts. The order of paraoxon adsorption on the samples is as follows: AT6-G2 > AT6-G1.5 > AT6-G1 > AT6-G0.5 > AT6 > TiO2. It can be observed that the adsorption capability of AT6-G nanocomposite is higher than that of AT6 and TiO2 and with increasing the graphene content in AT6-G nanocomposites the adsorption capacity increases. Graphene with its thin layer structure and also its large surface area increase the surface area of base absorbent for adsorption of contaminants. Furthermore, in presence of benzene aromatic rings and different function groups on the surface of graphene the π–π stacking and electrostatic interactions between graphene sheets and contaminants increases.42

Fig. 10 shows time profiles of C/C0 under visible light irradiation, where C is the concentration of paraoxon at the irradiation time of t and C0 is the concentration in the adsorption equilibrium of the photocatalysts before irradiation. The results show that there was a no degradation for the paraoxon under visible light irradiation in the absence of any photocatalysts. Under visible light irradiation, the photocatalytic activity of the bare TiO2-P25 was very low because the illumination energy is below the band-gap energy of TiO2. Surface modification with Ag nanoparticles induces a red shift in the light absorption of the TiO2-P25 creating an activity under visible light (Fig. 2). As Fig. 10(a) depicts in the case of AT8 high Ag loading decreases photocatalytic efficiency. According to the literature reports, in high loading contents of Ag, the Ag itself can acts as recombination center and thereby enhance the recombination rate of photo-generated electron hole pairs by this way decrease the photocatalytic activity.43 Fig. 10(b) demonstrates effects of graphene addition to the photocatalytic activity of AT6 nanocomposite.


image file: c6ra19478h-f10.tif
Fig. 10 Photocatalytic degradation of paraoxon over the prepared photocatalysts.

The pseudo first order kinetic model was used for determination of reaction rate constant (k) of paraoxon photodegradation which expressed by eqn (1):

 
image file: c6ra19478h-t1.tif(2)
where k is the first-order rate constant. This model is generally used for determination of the photocatalytic degradation reaction rate constant (k) if the initial concentration of the pollutant is low. Fig. 11(a) depicts the ln(C/C0) versus time for TiO2 and AT photocatalysts. TiO2 presents an apparent reaction rate constant k of 0.0123 min−1 under the irradiation of visible light. While among AT photocatalysts the AT6 with 0.0757 min−1 reaction rate constant (k) shows the highest reaction rate constant (k), which is 6.15 times that of TiO2. The reaction rate constant (k) of other samples was summarized in Table 1. Ag nanoparticles loaded on the surface of TiO2 can absorb the visible light irradiation by the SPR effect in which electrons transport from Ag to the conduction band of TiO2 and increase the photocatalytic activity under visible light irradiation. It has also been reported that Ag nanoparticles loaded on TiO2 surface act as electron sinks and reduce the recombination rate of photo-induced electrons and holes resulting in better charge separation than TiO2, and thus enhancing the photocatalytic activity of AT photocatalyst.44


image file: c6ra19478h-f11.tif
Fig. 11 The corresponding pseudo-first-order kinetics of the photocatalytic activity of as-prepared photocatalysts for paraoxon photodegradation under visible light radiation.
Table 1 Comparison of rate constants of paraoxon photodegradation reaction on the different photocatalysts
Sample P25 AT1 AT2 AT4 AT6 AT8 T-G1 AT6-G0.5 AT6-G1 AT6-G1.5 AT6-G2
K (min−1) × 10−2 1.23 ± 0.06 2.91 ± 0.11 4.22 ± 0.21 5.15 ± 0.14 7.57 ± 0.19 6.71 ± 0.23 1.86 ± 0.09 10.61 ± 0.32 12.31 ± 0.25 7.14 ± 0.21 3.54 ± 0.14


As Fig. 11(b) shows addition of graphene to AT6 in AT6-G nanocomposite at first enhance photocatalytic activity but more graphene loading has destruction effect on photocatalytic activity. Among all photocatalysts AT6-G1 has the best photocatalytic activity for degradation of paraoxon with reaction rate constant (k) of 0.1231 min−1 which is 10.01 times that of P25. But more graphene loading leads to a significant decrease of photocatalytic activity because of the tendency of graphene sheets for agglomeration of AT6 nanoparticles on its surface (Fig. 3(d)), which lead to decrease the available surface area for paraoxon adsorption. Clearly, when the weight ratio of graphene exceed from 1 wt%, the photocatalytic activity of the nanocomposites is deteriorated. Therefore, the AT6-G1 is the optimum weight ratio of graphene, and the higher content of graphene could be detrimental to the photocatalytic efficiency. Although, graphene is beneficial for charge separation and increasing surface area of the ATG photocatalyst, but it could shade AT6 in too much weight ratio content and also it could form Ag–O bond with Ag and by this way diminish benefits of Ag (such as SPR effect). Therefore, it must be balanced between good (increasing surface area, decreasing photogenerated electron hole recombination rate) and bad (shading, formation of Ag–O bond, and agglomeration of AT6 on graphene sheets) effects of graphene addition to AT6 nanocomposite. Comparison the photocatalytic activity of AT6-G1 with T-G1, clearly indicates that simultaneous presence of Ag and graphene in TiO2, has better effect on the photocatalytic activity of TiO2.

To evaluate the stability of AT6-G1, The recycling runs of the photocatalytic degradation of paraoxon by AT6-G1 were studied. For this purpose, after the photocatalytic reaction, the photocatalyst was recovered by centrifugation and used again. The result of this test was shown in Fig. S4. According to the results of this figure, AT6-G1 retains 89% of its initial efficiency for photocatalytic degradation of paraoxon after 5 run. Therefore, this photocatalyst has an acceptable stability.

Reaction pathway and intermediates. In order to determine the reaction pathway of paraoxon photodegradation on AT6-G1 photocatalyst, it is necessary determination of the active species (hvb+, OH˙ and O2˙ radicals) and the reaction intermediates. Fig. 12 depicts the photocatalytic activity results of AT6-G1 in presence of these scavengers, as the results shows in presence of hvb+ scavenger, the photocatalytic activity has been nearly maintained so role of hvb+ in the paraoxon photodegradation on AT6-G1 is negligible. However, in presence of tBuOH, the photocatalytic activity has been remarkably decreased. Also in presence of benzoquinone, the photocatalytic activity shows significant decrease. Due to the nearly vanishing of the photocatalytic activity of AT6-G1 in presence of mixture of tBuOH and benzoquinone scavengers, so OH˙ radicals together with O2˙ radicals play the main role in the photocatalytic degradation of paraoxon by AT6-G1 photocatalyst but presence of OH˙ radicals is more important.
image file: c6ra19478h-f12.tif
Fig. 12 Comparison the photocatalytic activity of AT6-G1 in absence and presence of different scavengers.

Table 2 summarized the results of GC-MS analysis for determination of the major intermediates of the paraoxon photodegradation reaction on AT6-G1. Fig. S5 shows the mass spectra of paraoxon and its photodegradation intermediates. So 4-nitrophenol, di-ethylphosphate, mono-ethylphosphate, hydroquinone and hydroxyhydroquinone were detected as major intermediates for this reaction. By combination the results of this test with the above results for active species one could predict a suitable reaction pathway for this reaction as shown in Fig. 13. As depicted in this proposed mechanism, photodegradation of paraoxon on AT6-G1 photocatalyst starts by attacking of hydroxyl radical to paraoxon which produces 4-nitrophenol and di-ethylphosphate as initial intermediates. Di-ethylphosphate itself undergoes subsequent degradation by hydroxyl radical and releases mono-ethylphosphate intermediate. Repeating of this reaction results complete degradation di-ethylphosphate and producing of carbon dioxide and phosphate ion. In first photodegradation step of 4-nitrophenol, reaction of this compound with hydroxyl radical produces nitrous acid and hydroquinone intermediate. According to the literatures, in oxidative media, hydroquinone can be oxidized to benzoquinone. However, benzoquinone, as a strong O2˙ radical scavenger, immediately reacts with this radical and undergoes more oxidation. For this reason, this compound was not detected in GC-MS analysis. Subsequent interaction of hydroquinone and benzoquinone with hydroxyl and superoxide radicals produces hydroxybenzoquinone. Hydroxyhydroquinone in reaction with O2˙ and OH˙ radicals undergoes more oxidation and ring opening reactions and produces 3-hydroxy-hexa-2,4-dienedioic acid, 4-hydroxy-pent-2-enedioic acid, and tartaric acid as intermediates, which subsequent interaction of these compounds with O2˙ and OH˙ radicals finely converts paraoxon and its photocatalytic degradation intermediates to carbon dioxide.45 Therefore final products of the paraoxon photodegradation on AT6-G1 photocatalyst are phosphate ion, nitrate ion, and carbon dioxide. Presence of phosphate ion can be confirmed by qualitative analysis of the final irradiated solution by acidifying the solution with nitric acid and then treating with ammonium heptamolybdate solution.46 By using this method the solution had turned to yellow precipitate due to the formation of ammonium molybdophosphoric acid thus confirming the presence of phosphate ions.

Table 2 The identified intermediates in photocatalytic degradation of naphthalene at the recent researches
Intermediates Retention time (min) Main characteristic ions (m/z)
4-Nitrophenol 9.76 39, 63, 65, 81, 93, 109, 139
Di-ethylphosphate 8.47 29, 45, 81, 99, 110, 127, 154
Mono-ethylphosphate 6.14 29, 45, 81, 99, 111, 126
Hydroquinone 14.34 27, 39, 53, 55, 81, 82, 110
Hydroxyhydroquinone 11.25 29, 39, 51, 52, 80, 97, 126
3-Hydroxy-hexa-2,4-dienedioic acid 7.65 29, 45, 55, 71, 87, 113, 158
4-Hydroxy-pent-2-enedioic acid 5.43 27, 45, 55, 71, 75, 101, 146
Tartaric acid 4.51 45, 57, 75, 105, 150


image file: c6ra19478h-f13.tif
Fig. 13 Proposed reaction mechanism of paraoxon photocatalytic degradation on AT6-G1 photocatalyst under visible light irradiation. (I = paraoxon, II = 4-nitrophenol, III = di-ethylphosphate, V = mono-ethylphosphate, VI = hydroquinone, VII = benzoquinone, VIII = hydroxyhydroquinone, IX = hydroxybenzoquinone, X = 3-hydroxy-hexa-2,4-dienedioic acid, XI = 4-hydroxy-pent-2-enedioic acid, and XII = 2,3-dihydroxy-succinic acid).
Mineralization. As discussed in the above section, during the photocatalytic degradation of paraoxon, some intermediates with high toxicity are produced, so it is necessary to evaluate the stability of intermediates. In this regard, the evolution of the reaction intermediates with the irradiation time was investigated and the results of this test, along with the results of TOC test, have been shown in Fig. 14. As could be seen in this figure, none of the reaction intermediates are not stable during the photocatalytic reaction, and these intermediates react with O2˙ and OH˙ radicals and finally convert to the mineral compounds. The trend of the TOC removal efficiency of AT6-G1 photocatalyst clearly shows that in first 5 min of the reaction time, there is no reduction in TOC value, in this step all of the produced radicals were consumed by paraoxon and its initial reaction intermediates (i.e. 4-nitrophenol and hydroquinone) to produce other intermediates. After 20 min of reaction time, there is a remarkable increment in the TOC removal efficiency, in this step all of the intermediates react with O2˙ and OH˙ radicals, and produce CO2. After 110 min, all of the organic compounds including paraoxon and its photocatalytic degradation intermediates, completely mineralized and converted to the inorganic one. Therefore, CO2, NO3, and PO43− are the final products of the paraoxon photodegradation by AT6-G1 photocatalyst, which, in comparison with paraoxon, have very low toxicity.
image file: c6ra19478h-f14.tif
Fig. 14 TOC removal efficiency (%) for paraoxon photodegradation under visible light irradiation on AT6-G1 photocatalyst.

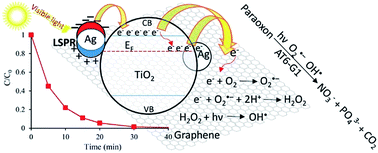
Scheme 1 summarized all of the obtained results. By visible light irradiation of AT6-G1 nanocomposite, based on localized surface plasmon resonance (LSPR) effect, the conduction electrons of Ag nanoparticles were excited and in the following, these electrons could transfer to the conduction bond (CB) of TiO2. Electrons in CB of TiO2 can directly move to the surface of graphene or can move to the Fermi level (EF) of Ag nanoparticles and then transfer to the graphene surface.47,48 These electrons at the surface of Ag, graphene, or TiO2 can react with dissolved oxygen and produce O2˙ radical. Peroxide radical itself can react with proton and another electron and produce hydrogen peroxide. Hydrogen peroxide is a major source of hydroxyl radical (OH˙). Reaction of O2˙ and OH˙ radicals with paraoxon and its photocatalytic degradation intermediates results in the complete mineralization of this poisonous pesticide. So Ag enhances photocatalytic efficiency of TiO2 via its LSPR effect and its high electric conductivity, and graphene sheets, because of the high mobility of electron on their surface, reduces electron–hole recombination rate and by this way improves photocatalytic activity of AT6-G1 nanocomposite.


image file: c6ra19478h-s1.tif
Scheme 1 Schematic illustration of the activation mechanism of Ag nanoparticle and graphene co-loaded TiO2 nanocomposite under visible light irradiation for paraoxon photocatalytic degradation.

In order to clarify the novelty of this work, it is necessary to compare this work with previous works in the context of photocatalytic degradation of organophosphorus pesticides. In Table 3 some of the most important works in this field are compared with our work. Despite the extensive researches on photocatalytic degradation of organophosphorus pesticides, there are a few study related to paraoxon and this makes it difficult to have a complete comparison. So we were forced to consider researches related to parathion (an organophosphorus pesticide with a very similar molecular structure to paraoxon) too. As the first two rows of Table 3 indicate, in absence of any catalyst photodegradation rate of parathion under sunlight is very low, however, UV radiation remarkably enhances this reaction. Although presence of TiO2 nanoparticles improves the photodegradation of parathion, due to the large intrinsic band gap energy (>3.2 eV) of TiO2, this nanoparticles don't have good performance under visible light radiation. Various strategies have been developed to resolve this problem such as doping and compositing of TiO2 or even using another visible light active photocatalysts. Table 3 shows effect of these approaches on photocatalytic degradation of pesticides. As can be seen, in comparison with other visible light active photocatalysts, our prepared AT6-G1 photocatalysts have an excellent performance toward photocatalytic degradation of paraoxon. Photocatalytic performance of AT6-G1 under visible light radiation is about that of TiO2 under UV radiation. Therefore, in this study, with optimum addition of Ag and graphene to the TiO2 nanoparticles, a high performance visible light active photocatalyst was prepared, and was used for the first time for photocatalytic degradation of paraoxon. By using suitable scavengers, the active species (hvb+, OH˙ and O2˙ radicals) were characterized and based on these active species and results of GC-MS analysis, for the first time the possible reaction pathway was proposed.

Table 3 Comparison the photocatalytic performance of AT6-G1 with other reported photocatalysts in photodegradation of pesticides
Photocatalyst Radiation K (min−1) Pesticide Ref.
Without photocatalyst Sunlight 1.36 × 10⁻⁵ Parathion 49
Without photocatalyst UV 1.89 × 10⁻² Parathion 50
TiO2 (P25) Visible 1.1 × 10⁻² Parathion 51
TiO2 (P25) Visible 1.1 × 10⁻² Parathion 52
TiO2 (P25) UV-visible 3.46 × 10⁻² Parathion 53
TiO2 (P25) UV 15.3 × 10⁻² Parathion 51
TiO2 (P25) UV 16.7 × 10⁻² Parathion 50
Bi3+-doped TiO2 UV 5.6 × 10⁻² Parathion 54
La-doped TiO2 UV 3.81 × 10⁻² Parathion 55
Ag/TiO2 nanofiber UV 3.44 × 10⁻² Parathion 56
N-doped TiO2 UV 2.3 × 10⁻² Parathion 51
ZnO UV 2.00 × 10⁻² Parathion 57
Ag–TiO2 film UV-visible 6.9 × 10⁻³ Parathion 58
H6P2W18O62/TiO2 Visible 7.70 × 10⁻² Parathion 52
ZnS/TiO2 Visible 6.56 × 10⁻² Parathion 59
N-doped TiO2 Visible 5.5 × 10⁻² Parathion 51
CoO–TiO2 Visible 3.51 × 10⁻⁴ Paraoxon 60
TiO2 film UV-visible 6.9 × 10⁻³ Paraoxon 61
Carbon/Cu2O/epoxy Sunlight 8.41 × 10⁻³ Paraoxon 62
AT6-G1 Visible 12.3 × 10⁻² Paraoxon  


Although, there are some reports which concerned with the photocatalytic activity of Ag/graphene/TiO2 ternary nanocomposite in photodegradation of organic dyes.63–67 However, at the present work, for the first time we surveyed the photocatalytic activity photodegradation pathway of this nanocomposite in photodegradation of organophosphorus pesticide and with optimizing of the Ag and graphene contents of the nanocomposite, a high performance photocatalyst was prepared.

4. Conclusions

In this study, the Ag nanoparticle and graphene co-loaded TiO2 nanocomposite was successfully synthesized via simple surfactant free solvothermal process, and was applied, for the first time, for photodegradation of paraoxon (as a model of organophosphorus compounds) under visible light irradiation. The results of DRS study showed that Ag nanoparticles in the surface of P25 (according to TEM image) has its original surface plasmon resonance (SPR) absorption band in wavelength of about 500 nm and therefore by its SPR and bond gap narrowing effects could enhances the photocatalytic activity of its embedded semiconductor. Incorporation of graphene in the structure of a photocatalyst can increase the surface area of the photocatalyst (facilitation of the contaminate adsorption), and because of high electron mobility on its surface, can decrease the recombination rate of photogenerated electron–hole pair, and by this way, can improve the photocatalytic activity of the photocatalyst. However, as the results of XPS demonstrated graphene oxide (is supposed to partially reduce to graphene), in high content in the structure of the AT6 photocatalyst, could form Ag–O bond with Ag, and formation of Ag–O decreases the SPR effects of Ag and by this way, the photocatalytic activity of its embedded photocatalysts was destructed. Therefore, in compositing of graphene with a photocatalyst, it must be balanced between bad and good effects of graphene. Our results showed that AT6-G1 with 6 wt% Ag and 1 wt% graphene content has the best photocatalytic activity among the surveyed photocatalysts.

GC-MS analysis results show that photodegradation of paraoxon on AT6-G1 photocatalyst produces 4-nitrophenol, di-ethylphosphate, mono-ethylphosphate, hydroquinone, hydroxyhydroquinone 3-hydroxy-hexa-2,4-dienedioic acid, 4-hydroxy-pent-2-enedioic acid, and tartaric acid as major intermediates. As the results of TOC tests indicates, these intermediates are not stable in the reaction solution and subsequent photodegradation of them, results in complete mineralization of paraoxon. Surveying the reaction active species indicated that hydroxyl and peroxide radicals play the main role in the photodegradation of paraoxon on this photocatalyst.

Notes and references

  1. P. Pavez, D. Millán, J. I. Morales, E. A. Castro, A. C. López and J. G. Santos, J. Org. Chem., 2013, 78, 9670–9676 CrossRef CAS PubMed.
  2. T. T. Marrs, R. L. Maynard and F. Sidell, Chemical warfare agents: toxicology and treatment, John Wiley & Sons, 2007 Search PubMed.
  3. B. Liu, L. McConnell and A. Torrents, Chemosphere, 2001, 44, 1315–1323 CrossRef CAS PubMed.
  4. M. B. Kralj, U. Černigoj, M. Franko and P. Trebše, Water Res., 2007, 41, 4504–4514 CrossRef PubMed.
  5. B. K. Singh and A. Walker, FEMS Microbiol. Rev., 2006, 30, 428–471 CrossRef CAS PubMed.
  6. G. R. M. Echavia, F. Matzusawa and N. Negishi, Chemosphere, 2009, 76, 595–600 CrossRef CAS PubMed.
  7. M. N. Chong, B. Jin, C. W. Chow and C. Saint, Water Res., 2010, 44, 2997–3027 CrossRef CAS PubMed.
  8. E.-H. Kong, J. Lim, J. H. Lee, W. Choi and H. M. Jang, Appl. Catal., B, 2015, 176, 76–82 CrossRef.
  9. T. Umebayashi, T. Yamaki, H. Itoh and K. Asai, Appl. Phys. Lett., 2002, 81, 454–456 CrossRef CAS.
  10. M. M. Khan, S. A. Ansari, D. Pradhan, M. O. Ansari, J. Lee and M. H. Cho, J. Mater. Chem. A, 2014, 2, 637–644 CAS.
  11. Z. Bian, T. Tachikawa, P. Zhang, M. Fujitsuka and T. Majima, J. Am. Chem. Soc., 2013, 136, 458–465 CrossRef PubMed.
  12. J. Chen, F. Qiu, W. Xu, S. Cao and H. Zhu, Appl. Catal., A, 2015, 495, 131–140 CrossRef CAS.
  13. Y. Ren, C. Sun, K. Li, L. Wang and M. Song, Ceram. Int., 2016, 42, 1339–1344 CrossRef CAS.
  14. T. Tanaka, K. Kadota, Y. Tozuka, A. Shimosaka and Y. Shirakawa, Ceram. Int., 2016, 42, 9963–9971 CrossRef CAS.
  15. R. Malik, V. Chaudhary, V. K. Tomer, P. S. Rana, S. Nehra and S. Duhan, Ceram. Int., 2016, 42, 10892–10901 CrossRef CAS.
  16. A. Nourbakhsh, S. Abbaspour, M. Masood, S. N. Mirsattari, A. Vahedi and K. J. D. Mackenzie, Ceram. Int., 2016, 42, 11901–11906 CrossRef CAS.
  17. O. Rosseler, M. V. Shankar, M. Karkmaz-Le Du, L. Schmidlin, N. Keller and V. Keller, J. Catal., 2010, 269, 179–190 CrossRef CAS.
  18. F. Zhang, Z. Cheng, L. Cui, T. Duan, A. Anan, C. Zhang and L. Kang, RSC Adv., 2016, 6, 1844–1850 RSC.
  19. K. Awazu, M. Fujimaki, C. Rockstuhl, J. Tominaga, H. Murakami, Y. Ohki, N. Yoshida and T. Watanabe, J. Am. Chem. Soc., 2008, 130, 1676–1680 CrossRef CAS PubMed.
  20. A. K. Geim, Science, 2009, 324, 1530–1534 CrossRef CAS PubMed.
  21. X. Huang, X. Qi, F. Boey and H. Zhang, Chem. Soc. Rev., 2012, 41, 666–686 RSC.
  22. Q. Xiang, J. Yu and M. Jaroniec, Chem. Soc. Rev., 2012, 41, 782–796 RSC.
  23. J. Hu, H. Li, Q. Wu, Y. Zhao and Q. Jiao, Chem. Eng. J., 2015, 263, 144–150 CrossRef CAS.
  24. M. Yin, Z. Li, J. Kou and Z. Zou, Environ. Sci. Technol., 2009, 43, 8361–8366 CrossRef CAS PubMed.
  25. T. Jiang, L. Zhang and J. Zhou, Analyst, 2014, 139, 5893–5900 RSC.
  26. L. Sun, Z. Zhao, Y. Zhou and L. Liu, Nanoscale, 2012, 4, 613–620 RSC.
  27. S. Feng, M. Wang, Y. Zhou, P. Li, W. Tu and Z. Zou, APL Mater., 2015, 3, 104416–104418 CrossRef.
  28. S. Li, Y.-H. Lin, B.-P. Zhang, Y. Wang and C.-W. Nan, J. Phys. Chem. C, 2010, 114, 2903–2908 CAS.
  29. A. M. E. Badawy, T. P. Luxton, R. G. Silva, K. G. Scheckel, M. T. Suidan and T. M. Tolaymat, Environ. Sci. Technol., 2010, 44, 1260–1266 CrossRef PubMed.
  30. J. Jiang, G. Oberdörster and P. Biswas, J. Nanopart. Res., 2009, 11, 77–89 CrossRef CAS.
  31. D. B. Williams and C. B. Carter, The transmission electron microscope, Springer, 1996 Search PubMed.
  32. K. S. W. Sing, D. H. Everett, R. A. W. Haul, L. Moscou, R. A. Pierotti, J. Rouquerol and T. Siemieniewska, Pure Appl. Chem., 1985, 57, 603–619 CrossRef CAS.
  33. Y. Yang, E. Liu, H. Dai, L. Kang, H. Wu, J. Fan, X. Hu and H. Liu, Int. J. Hydrogen Energy, 2014, 39, 7664–7671 CrossRef CAS.
  34. G. B. Hoflund, Z. F. Hazos and G. N. Salaita, Phys. Rev. B: Condens. Matter Mater. Phys., 2000, 62, 11126 CrossRef CAS.
  35. V. I. Bukhtiyarov, M. Hävecker, V. V. Kaichev, A. Knop-Gericke, R. W. Mayer and R. Schlögl, Phys. Rev. B: Condens. Matter Mater. Phys., 2003, 67, 235422 CrossRef.
  36. O. Akhavan, M. Abdolahad, A. Esfandiar and M. Mohatashamifar, J. Phys. Chem. C, 2010, 114, 12955–12959 CAS.
  37. S. I. Mogal, V. G. Gandhi, M. Mishra, S. Tripathi, T. Shripathi, P. A. Joshi and D. O. Shah, Ind. Eng. Chem. Res., 2014, 53, 5749–5758 CrossRef CAS.
  38. J. D. Kim, T. Palani, M. R. Kumar, S. Lee and H. C. Choi, J. Mater. Chem., 2012, 22, 20665–20670 RSC.
  39. J. Liqiang, Q. Yichun, W. Baiqi, L. Shudan, J. Baojiang, Y. Libin, F. Wei, F. Honggang and S. Jiazhong, Sol. Energy Mater. Sol. Cells, 2006, 90, 1773–1787 CrossRef.
  40. C. A. Emilio, M. I. Litter, M. Kunst, M. Bouchard and C. Colbeau-Justin, Langmuir, 2006, 22, 3606–3613 CrossRef CAS PubMed.
  41. M. T. Yagub, T. K. Sen, S. Afroze and H. M. Ang, Adv. Colloid Interface Sci., 2014, 209, 172–184 CrossRef CAS PubMed.
  42. G. Ramesha, A. V. Kumara, H. Muralidhara and S. Sampath, J. Colloid Interface Sci., 2011, 361, 270–277 CrossRef CAS PubMed.
  43. E. Grabowska, A. Zaleska, S. Sorgues, M. Kunst, A. Etcheberry, C. Colbeau-Justin and H. Remita, J. Phys. Chem. C, 2013, 117, 1955–1962 CAS.
  44. M. Ahmad, E. Ahmed, Z. Hong, N. Khalid, W. Ahmed and A. Elhissi, J. Alloys Compd., 2013, 577, 717–727 CrossRef CAS.
  45. X. Li, J. W. Cubbage, T. A. Tetzlaff and W. S. Jenks, J. Org. Chem., 1999, 64, 8509–8524 CrossRef CAS.
  46. P. P. Van Veldhoven and G. P. Mannaerts, Anal. Biochem., 1987, 161, 45–48 CrossRef CAS PubMed.
  47. V. Subramanian, E. E. Wolf and P. V. Kamat, J. Am. Chem. Soc., 2004, 126, 4943–4950 CrossRef CAS PubMed.
  48. Z. Chen, L. Fang, W. Dong, F. Zheng, M. Shen and J. Wang, J. Mater. Chem. A, 2014, 2, 824–832 CAS.
  49. T. M. Sakellarides, M. G. Siskos and T. A. Albanis, Int. J. Environ. Anal. Chem., 2003, 83, 33–50 CrossRef CAS.
  50. T. S. Kim, J. K. Kim, K. Choi, M. K. Stenstrom and K. D. Zoh, Chemosphere, 2006, 62, 926–933 CrossRef CAS PubMed.
  51. J. Senthilnathan and L. Philip, Chem. Eng. J., 2011, 172, 678–688 CrossRef CAS.
  52. B. Xin, L. Jing, Z. Ren, B. Wang and H. Fu, J. Phys. Chem. B, 2005, 109, 2805–2809 CrossRef CAS PubMed.
  53. I. K. Konstantinou, T. M. Sakellarides, V. A. Sakkas and T. A. Albanis, Environ. Sci. Technol., 2001, 35, 398–405 CrossRef CAS PubMed.
  54. S. Rengaraj, X. Z. Li, P. A. Tanner, Z. F. Pan and G. K. H. Pang, J. Mol. Catal. A: Chem., 2006, 247, 36–43 CrossRef CAS.
  55. H. Chen, M. Shen, R. Chen, K. Dai and T. Peng, Environ. Technol., 2011, 32, 1515–1522 CrossRef CAS PubMed.
  56. X. Li, F. Wang, Q. Qian, X. Liu, L. Xiao and Q. Chen, Mater. Lett., 2012, 66, 370–373 CrossRef CAS.
  57. E. Evgenidou, I. Konstantinou, K. Fytianos and I. Poulios, Water Res., 2007, 41, 2015–2027 CrossRef CAS PubMed.
  58. P. V. R. K. Ramacharyulu, J. Praveen Kumar, G. K. Prasad and A. R. Srivastava, RSC Adv., 2015, 5, 1309–1314 RSC.
  59. Y. Xiaodan, W. Qingyin, J. Shicheng and G. Yihang, Mater. Charact., 2006, 57, 333–341 CrossRef.
  60. A. K. P. D. Savio, J. Fletcher, K. Smith, R. Iyer, J. M. Bao and F. C. Robles Hernández, Appl. Catal., B, 2016, 182, 449–455 CrossRef CAS.
  61. G. Prasad, P. Ramacharyulu, J. P. Kumar, A. Srivastava and B. Singh, Thin Solid Films, 2012, 520, 5597–5601 CrossRef CAS.
  62. B. De, B. Voit and N. Karak, RSC Adv., 2014, 4, 58453–58459 RSC.
  63. L.-L. Tan, W.-J. Ong, S.-P. Chai and A. R. Mohamed, Appl. Catal., B, 2015, 166, 251–259 CrossRef.
  64. Z. Jafari, N. Mokhtarian, G. Hosseinzadeh, M. Farhadian, A. Faghihi and F. Shojaie, J. Energy Chem., 2016, 25, 393–402 CrossRef.
  65. E. Vasilaki, I. Georgaki, D. Vernardou, M. Vamvakaki and N. Katsarakis, Appl. Surf. Sci., 2015, 353, 865–872 CrossRef CAS.
  66. B. Pant, P. S. Saud, M. Park, S.-J. Park and H.-Y. Kim, J. Alloys Compd., 2016, 671, 51–59 CrossRef CAS.
  67. W. Zhao, Z. Zhang, J. Zhang, H. Wu, L. Xi and C. Ruan, Mater. Lett., 2016, 171, 182–186 CrossRef CAS.

Footnote

Electronic supplementary information (ESI) available. See DOI: 10.1039/c6ra19478h

This journal is © The Royal Society of Chemistry 2016
Click here to see how this site uses Cookies. View our privacy policy here.