Intelligent design of conducting network in polymers using numerical and experimental approaches

Nuha Al Habis*, Chang Liu, Jean-Baptiste Dumuids and Khalid Lafdi
University of Dayton, 300 College Park, Dayton, OH 45469, USA. E-mail: Alhabisn1@udayton.edu

Received 1st August 2016 , Accepted 28th September 2016

First published on 28th September 2016


Abstract

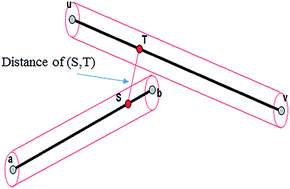
Traditionally, a conjugated polymer is used to constitute a conductive network. An alternative method currently being used is nano-fillers as additives in the polymer. The optimization of fillers/polymer is necessary to form a functional network and preserve the overall mechanical properties of the polymer. This current study consists of two tasks using both experimental and numerical simulation methods to examine the influence of concentration, properties and orientation of carbon nano-fillers. The first task allows for a quick parameter optimization. However in the second task, various experiments were conducted in order to examine the modeling algorithm. Results show that the design of conducting a network is highly dependent on the concentration, orientation, shape of nano-fillers, the nature of the mix of nano-fillers and their mutual interactions.


Introduction

Carbon nanomaterials exhibit extraordinary electrical, thermal, optical and mechanical properties because of their special allotropic forms. Carbon black shows relatively low electrical conductivity due to their onion like concentric structure.1 Carbon black is used for a variety of conducting applications such as electromagnetic shielding,2 UV absorption,3 antistatic applications.4–6 Conversely, carbon nanofiber (CNF) and graphene are made of graphene layers which is ether lamellar or cylindrical; both exhibit high electrical, thermal and mechanical properties. Carbon nanofibers is made using chemical vapor deposition with seed catalysts and reactive temperature above 600C. Depending on the thermodynamic conditions, such as time, temperature, gas concentration and catalyst type, the nanofiber configuration structures vary from Dixie cup, fish bone, bamboo, twisted or spiral.7 These various carbon nanofibers have been used for battery electrode,8 chemical absorption,9 nanocomposite reinforcement,10 thermal management and conductive nano-fillers.11 In contrast, graphene is made using two methods ether chemical vapor deposition or electro-chemical methods. Both lead to the formation of lamella platelets. The thickness varies between one to several graphene layers. This material is used extensively in a variety of applications such as electronics12,13 chemical absorption14,15 nano composites16 and energy harvest.17–19 As a nano-filler, graphene is a promising material to enhance the physical properties of polymeric nanocomposite. As an alternative to the traditional conjugated polymer, carbon nanomaterials can be a good candidate as a nano-filler to enhance polymer conductivities.20,21 CNFs, carbon black and graphene have been widely studied in this article. There have been different studies showing that there are various percolation threshold values and conductivity levels. The conductivity of the isothermal annealed polypropylene plates had threshold and conductivity differences based on the addition of carbon black (threshold conductivity of 10−7 S m−1 at 0.12%) and multi-wall carbon nanotube (threshold conductivity of 10−5 S m−1 at 0.015 wt%).22 Muñoz et al. and Skakalova et al. studied the conductivity of SWCNT based polymer nanocomposite23,24 they obtained the same electrical conductivity value (104 S m−1) but at different concentration (75 wt% and 13.5 wt%). These conflicting results might be caused by several factors such as nano-fillers' dispersion, shape, size, aspect ratio, orientation, and concentration.

With the development of supercomputers and new algorithms, the simulation method became a powerful method to solve scientific25,26 and engineering problems.27,28 In the last few decades, numerous modeling and simulations had been developed to predict physical properties of carbon nanocomposite. Chunyu et al. used the Monte Carlo method to verify that the tunneling resistance played a critical role in the electrical conductivity of carbon nanocomposite.29 Besides the basic parameters, a novel morphological model developed by Takuya Morishita et al., which provided a glimpse into the role of aggregation in nanocomposite.30 Additionally, the Florent et al. established carbon nanotube (CNT) based conductive network with a 3-dimensional multi-node method.31 Those modeling simulated a real phenomenon in a CNT based nanocomposite. The CNTs appear to be entangled with each other and form a network. Great improvements have been made which helped researchers to develop a better understanding of how the CNT forms a conductive network in a polymer matrix. However, most of the previous models considered the nature of the materials as an important parameter, fewer studies are concerned with the effects of the manufacturing process. One significant factor caused by the manufacturing process is the degree of dispersion or aggregation of nano-fillers in the polymer matrix. The agglomeration morphology of carbon nanotube has been described as a fractal geometric structure.32 The megahertz detection property of a SWCNT coupled with Sierpinski antenna was investigated numerically and experimentally. The experiment showed the SWCNT array to be a promising structure for bolometer.33 Yu-Chun et al. used the fractal analytical approach to study the surface properties of the modified multi-walled carbon nanotube.34 Yajun Yin et al. represented the design fractal of super carbon nanotubes with strict self-similarities depending on the geometric conditions and described the fractal dimensions of the super carbon nanotubes.35 Haibao Lu et al. studied the improvement of the electrical properties of the polymeric matrix by incorporating with carboxylic acid functionalized CNT and carbon fiber.36 The conductive carbon-based fillers combined with the polymeric composite was useful for electrical actuation.37

Conductive network is widely used in sensors for small molecular detection,38–40 pressure41 and temperature42 detection. The use of carbon nano-materials had a significant advantage because of their light weight and low concentration and their potential of functionalization with additional surface molecules. Generally, four processing methods were used in sensor fabrication: spin coating,43 deposition,44 casting and electrospinning. All these methods are used today in industries to make electronics,45 bio-sensing and bio-medical scaffolds.46

In this study, an experimental approach will be carried out to study the conductive behavior as a function of nano-filler type, concentration. With the help of numerical simulations an aggregation parameter will be developed to study the effect of nano-filler dispersion. Two basic polymers will be used and thin film membranes will be prepared using the spin coating method with a variety of concentration of carbon nanotube, carbon black and graphene. In addition, this article will include the significance and effect of aggregation of the nano-fillers.

Materials and experimental methods

Materials

PAN white powder (acrylonitrile-co-methyl acrylate copolymer, acrylonitrile content 94%, image file: c6ra19477j-t1.tif) was purchased from Scientific Polymer Inc. and used as received without any further purification. Polycaprolactone (PCL) image file: c6ra19477j-t2.tif, was purchased from Sigma Aldrich. Poly(methyl methacrylate) (PMMA) image file: c6ra19477j-t3.tif, by GPC was purchased from Sigma Aldrich. The carbon nanofiber (CNF) was provided by Pyrograf Products Inc. Physical properties are shown in Table 1. Graphene was exfoliated by thermal shock or rapid temperature change of the intercalated graphite compound, which was previously described.47 High conductive carbon black (CB) is Vulcan XC 72R, Cabot®. The physical properties of carbon black and exfoliated graphite are shown in Table 2. The solvents used in this study are DMF (N,N-dimethylformamide) and acetone. Before mixing with polymer, we have chosen either shear mixing (IKA® shear mixer, T25 digital, Ultra Turrax), sonication (Bransonic® 5800 sonicator) or both.
Table 1 The physical properties of CNF
Average bulk density of CNF (g cm−3) 0.019–0.048
Nanofiber wall density (g cm−3) 2.0–2.1
Nanofiber density (including hollow core) (g cm−3) 1.4–1.6
Average catalyst (iron) content (ppm) <14[thin space (1/6-em)]000
Average outer diameter (nm) 125–150
Average inner diameter (nm) 50–70
Average specific surface area (m2 g−1) 65–75
Total pore volume (cm3 g−1) 0.140
Average pore diameter (Å) 82.02


Table 2 The physical properties of carbon black (CB) & exfoliated graphite
Bulk density of CB (g cm−3) 0.02–0.38
Density of CB (g cm−3) 1.7–1.9
Particle size of CB (nm) 300
Volume conductivity @ 23C of CB (ohm cm) 1.9
Surface area of small exfoliated graphite (m2 g−1) 16.02
Surface area of medium exfoliated graphite (m2 g−1) 15.61
Surface area of large exfoliated graphite (m2 g−1) 15.35


Preparation of PAN nanocomposite

In order to obtain a well-dispersed and homogeneous mixture of CNFs and PAN in DMF, several significant steps were implemented. In order to prepare a 10 wt% mixture of CNFs to PAN by weight, 50 mg CNFs were dispersed into 5 mL DMF solution, and then, ultra-sonicated for 2 days. After 2 days of sonication, 0.5 g PAN powder was added to 5 mL DMF solution and stirred while maintaining a temperature of 65 °C. A homogenous solution was obtained and remind stable for weeks without any aggregation or precipitation. A Speed line P2604 spin coater (Speedline Technologies) was used for fabrication. Spin coating parameters for PAN based nanocomposites were set at 1000 rpm for 90 seconds. The thin film was transferred to a 70 °C oven in order to remove the solvent. The aim of this step was to avoid the porous or sponge structure during the drying process.48

Preparation of PCL nanocomposite

14 wt% of PCL of acetone solution was prepared at 65 °C and then mixed with carbon nanomaterials which was similar to the process described above. Spin coating parameters for PCL based nanocomposites were set at 3000 rpm for 90 seconds.

Preparation of the cocktail approach

We mixed different nanomaterials using the same processes described above.

Characterization

The thickness of all the samples was measured by a thermal mechanical analysis (TMA, Q400, TA universal) at room temperature (∼23 °C). Conductivity was tested by using a two-probe method with copper electrodes and a KEITHLEY 2700 multimeter/DATA acquisition system.

A Phenom Desktop SEM (Pro X, Phenom) was used to characterize the morphology of nano-fillers and samples.

Raman technique (Renishaw in-Via Raman Microscope, 633 nm laser) was used to characterize the raw materials.

Numerical method

The first step is to reconstruct the 3D geometry of the nano-fillers and the network inside the polymer. The second step involves analyzing the network and its properties. This simulation will focus on junction's resistances between nano-fillers, assuming that the conductivity is mainly dependent on the quantum tunneling effect. The length of the tunnel junction, the thin layer of non-conductive polymer, is the parameter that determine if the nano-filler is connected to the network. Some assumptions have been made for the simulation. The first assumption is that the nano-fillers cannot cross each other or cross the considered volume. The second assumption is that the junction resistance will be the only resistance taken into account for the resistance of the network. Since CNF shows the highest conductivity value then its resistance is ignored. Finally, CNF geometry is represented as a cylinder with a hemisphere at its extremities. The diameter of the cylinder will be 300 nm. The length of the CNF is randomly set in a range of 15 to 30 μm. The carbon black geometry is represented as a sphere of 300 nm.

In order to calculate the resistance of a junction, it is necessary to calculate the minimal length between two nano-fillers. The three outcomes using this simulation are the distance between two CNFs, between two carbon blacks and between one CNF and one carbon black. In the case of the two CNF's, the minimal distance was calculated by minimum distance function (eqn (1)).

a,b,u,v,S,T[Doublestruck R]n

s,t[Doublestruck R]

S = {s × b + (1 − s) × a|0 ≤ s ≤ 1}

T = {t × u + (1 − t) × v|0 ≤ t ≤ 1}
 
image file: c6ra19477j-t4.tif(1)

The function consists of two parameters S and T, which represent the two points on the segment of the CNF axis as depicted on Fig. 1.


image file: c6ra19477j-f1.tif
Fig. 1 Illustration of minimal distance calculation.

In the case of a CNF with a carbon black, one of the parameters is replaced by the coordinates of the carbon black center. For the carbon black to the carbon black the distance is a simple calculation of distance between the centers.

Process description

This simulation was an iterative process that had two main conditions.

1. In order to build the additive's network we have to test the hypothesis & rules applied to the current experiment. As the process of creation of nano-fillers is random, the tests (rhombus) on Fig. 2 were intended to validate every nano-fillers' compliance to the rules & hypothesis.


image file: c6ra19477j-f2.tif
Fig. 2 The flow chart of numerical process.

2. To analyze the network, we need to determine whether a conductive network was built. If the network exists, the related equivalent resistance can be calculated. Organize the nano-filler setting in order to determine the link between them which should lead to the creation of a percolation bath way. In the case of percolation, a matrix solving process is applied to calculate the network resistance.

Results

Simulation results

The network analysis code determines the percolation state of the experiment, if a percolation path exists, determine the equivalent resistance of the virtual sample. The simulation starts from one conductive edge and will follow the connections stored as a function of the quantum tunneling links to determine if the path leads to the other conductive edge. To prevent a closed-loop, it is essential that the same link is not counted twice. Additionally, we must ignore any dead ends.

Equivalent resistance solving

Solving the equivalent resistance is based on Kirchhoff's circuit laws. The circuits are arranged on a matrix equation based on a node method.49 The system of equations allows for the solving of the resistance value by inverting the system. For a system of N nano-fillers with L links between them and the conductive faces as depicted on Fig. 3, the system of equation can be written in a single matrix equation (eqn (2)):
R × V = Y
 
RMn+2,n+2([Doublestruck R]), (V,Y) ∈ Mn+2,1([Doublestruck R]) (2)

image file: c6ra19477j-f3.tif
Fig. 3 Illustration of network's different configuration.

The V matrix represents the potential precisely:

i ∈ [2,n + 1], Vi represents the additive i electrical potential. V1 and Vn+2 represents the electrical potentials of the two conductive faces. The matrix Y is null except from the Y1,1 and Yn+2,n+2 coefficients that have the value of the electrical potential of the two conductive faces.

The matrix R is depended on the distances of the functioning links under the following rule:

C[Doublestruck R], resistance coefficient.

Dl[Doublestruck R], distance of j functioning link.

For each Dl, realizing the link between the two entities (an additive or one of the conductive faces), x and y, the term image file: c6ra19477j-t5.tif will be added to the R matrix under the following rule:

image file: c6ra19477j-t6.tif

image file: c6ra19477j-t7.tif

image file: c6ra19477j-t8.tif

image file: c6ra19477j-t9.tif

To ensure a non-zero matrix determinant thus the reversibility of the matrix, if an R matrix line is null the coefficient Ri,j, with j = i, is set to 1. Finally, the first and the last line of rare set to null and the coefficient R1,1 and Rn+2,n+2 are set to 1. The simulation then proceeds in an inversion of the system (eqn (3)).

 
V = Y × R−1 (3)

This provides the electrical potential of each additive inside the calculation volume. The electrical current inside the calculation volume can be determined with the electrical potentials and then the equivalent resistance in the function of the voltage applied to the conductive faces.

Scaling & time

The scaling is a key parameter in this simulation. The setting of the nano-fillers inside the considered volume is a random process. Any results from the simulation has to come from a batch of experiences and the size of the volume impacts variance of the results. Fig. 4 shows the evolution of the variance from nearly 4 to under 0.01. The variance is divided 400 times by multiplying by a factor 5 the base volume. A larger variance will result in more computation time.
image file: c6ra19477j-f4.tif
Fig. 4 Variance variation vs. base volume.

Aggregation principle

The first simulation showed that a random distribution of nano-fillers would not permit the constitution of a network unless there is some kind of aggregation. Thus the idea for an aggregation of nano-fillers was added to the simulation. This approach allows the network analysis to determine the electrical conductivity trends. The aggregation process was implemented by using the following methods: nano-fillers were still placed randomly in a given volume, but after the distance calculations, the aggregation part was added before the storage of the quantum tunneling functioning links. The portion that will aggregate the new additive is ruled by one parameter known as the distance of aggregation. This parameter determines if the new additive is within the distance of aggregation. If several additives satisfy this requirement the closest one will be the new additive as depicted in Fig. 5.
image file: c6ra19477j-f5.tif
Fig. 5 Caption illustration of aggregation principle.

Influence of Dagr parameter

The influence of the distance of aggregation parameter (Dagr) which can be related to the trend for the nano-fillers to form aggregate will impact the overall conductivity of the samples. This influence was studied using carbon blacks for the concentration from 0.5 to 10 percent in weight regarding to the polymer and by step of 0.5 percent. The volume of the calculation is parallelepipedic in relation to experimental tests conducted on spin coating film. The simulation is a virtual representation of a sample at each value of percentage and Dagr. A batch of 48 simulations were conducted with the average of each batch shown in Fig. 6. This work represents 7680 simulations. Fig. 6a shows a clear increase of the conductivity along with the increase of the value of the parameter. Based on this information we conclude that the aggregate is useful to the creation of a conductive network. Fig. 6b shows the conductivity evolution for the 10 percent weight in the case of carbon blacks that the conductivity is converging.
image file: c6ra19477j-f6.tif
Fig. 6 (a) Evolution of conductivity vs. percentage (b) conductivity evaluation vs. Dagr.

Carbon black in the spin coating film

Carbon blacks inside the calculation volume represented in Fig. 7a is a 3D model. After solving the network, the simulation displays in red all the nano-fillers connected directly by the intermediary of others to the first conductive edge. The nano-fillers not belonging to the conductive network are shown in gray. Fig. 7b represents the output of 48 independent workers computing 20 different concentration levels. Thus 960 iterations of the simulation were performed to determine the influence of the concentration on the electrical conductivity. Fig. 7c which represents the evolution of the electrical conductivity mean value of the 48 workers bench shows three parts. After a slow start we have a rapid increase to finish with a slowdown in terms of conductivity gain.
image file: c6ra19477j-f7.tif
Fig. 7 (a) Example of a spin coating film with CB, (b) graphical view of the 48 simulations' results, (c) conductivity vs. carbon blacks percentage in weight, (d) percolation proportion vs. carbon black concentration.

Fig. 7d shows a fraction of simulation which achieved a conductive network. This can be seen as a probability of obtaining a conductive network regarding the concentration in weight of the carbon black used in the polymer.

Carbon nanofiber in the spin coating film

Carbon nanofiber inside the calculation volume were represented in Fig. 8a as 3D model. After solving the network, the simulation displays in red the functioning links between the nano-fillers connected directly by the intermediary of others to the conductive edge. Fig. 8b represents the output of 48 independent workers computing each 24 different concentration levels. Thus 1152 iterations of the simulation were performed to determine the influence of the concentration on the electrical conductivity. Fig. 8c shows a steady increase of conductivity as concentrations of carbon nanotubes rises. Fig. 8d shows a fraction of simulation which achieved a conductive network. This can be seen as a probability of obtaining a conductive network regarding the concentration in weight of the carbon nanotube used in the polymer.
image file: c6ra19477j-f8.tif
Fig. 8 (a) Example of a spin coating film with carbon nanofiber, (b) graphical view of the 48 simulations' results, (c) conductivity vs. carbon nanofiber percentage in weight, (d) percolation proportion vs. carbon nanofiber concentration.

The mix of carbon blacks and carbon nanofiber

Given the results of the two types of nano-fillers, the simulation was used to simulate a mix of the two nano-fillers to see if the conductivity would follow a simple mixture law. For this experiment the total weight percentage was fixed at 1 percent.

The mix was completed according to the following rules:

X = carbon nanofiber weight percentage, Y = carbon blacks weight percentage, Z = nano-fillers weight percentage.

image file: c6ra19477j-t10.tif

One of the challenges faced during the calculation of the mix was the difference between the sizes of the two nano-fillers; carbon nanofiber is more than 300 times longer than a carbon black sphere as shown in Fig. 9a. The calculation volume size must be set according to the nanotubes own size and will be larger than the carbon blacks spheres. Consequently, it requires a large number of sphere units to maintain the nano-fillers weight percentage which is constant during the mix calculation. Fig. 9b shows that the electrical conductivity does not follow the mixture law, and we can see a decrease in terms of conductivity regarding the mixture law. The mix of nano-filler is less effective in building a good conductive network.


image file: c6ra19477j-f9.tif
Fig. 9 (a) Example of a spin coating film with a mix of carbon nanofiber & carbon black, (b) CB/CNT mixture law for conductivity.

Experimental results

Raw materials in this study were characterized by SEM and Raman spectroscopy. The morphology of carbon black, CNF, and graphene were shown in Fig. 10 with different scale bars as well as the morphology of spin coating of PCL/nano-fillers and PAN/nano-fillers. The dimension of carbon black nanoparticles is about 300 nm based on the given information and observation.
image file: c6ra19477j-f10.tif
Fig. 10 SEM images of (a) carbon black, (b) CNTs, (c) graphene. SEM images of spin coating film of (d) CB/PAN, (e) CNT/PAN, (f) graphene/PAN. SEM images of spin coating film of (g) 10 wt% of CB/PCL, (h) 10 wt% of CNT/PCL (i) 10 wt% of graphene/PCL.

Carbon black used in this study was naturally aggregated. After sonication and spin coating process, there still remained some aggregation of CB/PAN which could be noticed in Fig. 10d. The aggregation size is not measurable. Different types of aggregation may have different effects on the conductive behavior of this nanocomposite. The smaller aggregation could be only several nanoparticles and the larger one could be a tenth of a micron. The diameter of CNF was confirmed by Fig. 10b and was around 150 nm. CNF showed a random dispersion in the polymer matrix in Fig. 10e. The same observation could be noted with CNF/PCL in Fig. 10h. In addition, there is a porosity structure observed for CB/PCL in Fig. 10g. Graphene material was produced by a process previously described. As a result, the graphene material used in this study was micro/nano-pellet. In Fig. 10c, the graphene pellets present a flame like feature which indicates the wide distribution of thickness. While multi-layers of graphene were embedded into the polymer matrix, the flame like feature disappeared which could be recognized in Fig. 10f and i. We believe that the edges of graphene might work as the connection in conductive network and interfaces. It was very interesting to see graphene pellets had the edge perpendicular to the thin film surface. Further study is needed to reveal the behavior of graphene in spin coating process.

In order to understand the state of nano-fillers, a Raman microscope was employed to study the identity of D band and G band. In Fig. 11, curves of normalized Raman shift present a clear ratio difference for each nano-additive and displayed two prominent peaks corresponding to G and D band. Peak width of carbon black used to be very broad due to the high amorphous phase50 and the grain size of the carbon black materials.51 This result agrees with the published report from Jawhari et al.52 The Raman spectroscopy result of CNF had a lower width for D band and G band. Normally, a well-organized structure (less disordered structure) could lead to a sharper peak. The graphene curve showed a high ratio of intensity of the G band against to D band. The large area of D band in graphene curve indicated that the material had more defects than perfect graphene and might be much thicker. As a consequence, we call it an exfoliated graphite.


image file: c6ra19477j-f11.tif
Fig. 11 Comparison of Raman spectra of CB, CNF and graphene.

The conductivity test was performed by using 2 copper plate probes, the test direction was perpendicular to the film plane. After compressing the film firmly, a stable value was recorded. Two polymers were used as matrices: PCL and PAN. PCL has a glass transition temperature about −60 °C, which for PAN is ∼90 °C. Due to the fact that PAN has a much higher Tg than PCL, PCL is much more elastic than PAN under room temperature. As a consequence, while testing, PCL nanocomposite films deformed much more than PAN. These differences in mechanical behavior led to a difference in conductive behavior. Fig. 12a and b shows the conductivity as a function of the concentration of nano-fillers. A conductive network formed at about 3–5 wt% transition region which led to an increase in conductivity by order of magnitude. Both figures indicate that a conductivity increased with each increase in the concentration.


image file: c6ra19477j-f12.tif
Fig. 12 Relationship between the conductivity & concentration of the nano-additive with (a) PCL systems & (b) PAN systems.

The conductivity behavior of the mixture of carbon black and CNF nanocomposite which is represented in Fig. 13 clarified that the conductivity increase with an increase in the amount of the CNF. We kept the concentration of the mixture constant at 5 wt%. The conductivity of the mixture did not follow the mixture law of composite.


image file: c6ra19477j-f13.tif
Fig. 13 The mixture law of 5% wt of CB & CNF/PAN nanocomposites.

Discussion and conclusions

The experimental result showed the conductivity increased with an increase in the amount of nano-fillers concentration. Regardless of the type of nano-filler used the trend remind the same. The percolation threshold is around 4–5 wt% of nano-additive. But at the same concentration, the conductivity is higher in graphene based nanocomposites than for CNF and carbon blacks based nanocomposites. This result is pretty much expected because the conductivity of carbon black is lower than that of CNF and graphene due to their spherical onion like geometry and their small grain size. The contact between two adjacent carbon black particles are controlled by van der Waals interaction. However, in the case of CNF and graphene, two modes of bonding interactions are assumed: covalent and van der Waals bonds which explains their value increase in conductivity.

One of the most useful properties of graphene is that it is a zero-overlap semimetal (with both holes and electrons as charge carriers) with lead to higher electrical conductivity. In graphene, each atom is connected to 3 other carbon atoms on the two-dimensional plane, leaving one electron freely available in the third dimension for electronic conduction. As compared three types of fillers, the electrical conductivity of graphene is higher than CNF and CB. The exfoliated graphite has electrical conductivity about 2.8–3.2 kS m−1.53 On the other hand the conductivity of carbon nanofiber and carbon black are 5 × 10⁻⁵ Ω cm, 9.30 S cm−1 respectively.54,55

For both PCL and PAN based systems, the numerical simulation and experimental measurement seem to be in agreement. The conductivity trend for carbon blacks and carbon nanotubes based composites are the same, this numerical modelling highlights the benefits of mixing different types of nano-filler to achieve better conductive network. The percolation proportion of the carbon nanotube in the simulation result was about 0.3 wt% which is equal to published data.56 It seems that the dispersion of nano-additives is the key parameter to be considered. In our scenario, as opposed to the aggregation phenomenon, dispersion had the opposite effect while mixing different types of nano-fillers such as carbon black and nanotubes. The nanotubes tend to aggregate the carbon blacks along their axis thus preventing them from forming a larger connecting aggregates, which are the necessary elements to build the conductive network.

Notes and references

  1. R. D. Heidenreich, W. M. Hess and L. L. Ban, J. Appl. Crystallogr., 1968, 1, 1–19 CrossRef.
  2. N. C. Das, D. Khastgir, T. K. Chaki and A. Chakraborty, Composites, Part A, 2000, 31, 1069–1081 CrossRef.
  3. C. D. Cappa, T. B. Onasch, P. Massoli, D. R. Worsnop, T. S. Bates, E. S. Cross, P. Davidovits, J. Hakala, K. L. Hayden, B. T. Jobson and K. R. Kolesar, et al., Science, 2012, 337, 1078–1081 CrossRef CAS PubMed.
  4. C. C. Hu, S. S. Chang and N. Y. Liang, J. Text. Inst., 2016, 107, 976–984 CAS.
  5. X. Yin, J. F. Capsal and D. Guyomar, Appl. Phys. Lett., 2014, 104, 052913 CrossRef.
  6. M. H. Al-Saleh, W. H. Saadeh and U. Sundararaj, Carbon, 2013, 60, 146–156 CrossRef CAS.
  7. N. M. Rodriguez, J. Mater. Res., 1993, 8, 3233–3250 CrossRef CAS.
  8. L. Fei, B. P. Williams, S. H. Yoo, J. M. Carlin and Y. L. Joo, Chem. Commun., 2016, 52, 1501–1504 RSC.
  9. Y. Li, B. Zou, C. Hu and M. Cao, Carbon, 2016, 99, 79–89 CrossRef CAS.
  10. L. Hongbing, R. H. Baughman, M. H. Haque and S. D. Fang, US Pat., US20160024262A1, 2016.
  11. A. D'Alessandro, A. L. Pisello, S. Sambuco, F. Ubertini, F. Asdrubali, A. L. Materazzi and F. Cotana, Proc. SPIE, 2016, 9800,  DOI:10.1117/12.2218680.
  12. K. S. Novoselov, A. K. Geim, S. V. Morozov, D. Jiang, Y. Zhang, S. V. Dubonos, I. V. Grigorieva and A. A. Firsov, Science, 2004, 306, 666–669 CrossRef CAS PubMed.
  13. H. Liu, J. Kameoka, D. A. Czaplewski and H. G. Craighead, Nano Lett., 2004, 4, 671–675 CrossRef CAS.
  14. S. H. Harfenist, S. D. Cambron, E. W. Nelson, S. M. Berry, A. W. Isham, M. M. Crain, K. M. Walsh, R. S. Keynton and R. W. Cohn, Nano Lett., 2004, 4, 1931–1937 CrossRef CAS.
  15. I. H. Chen, C. C. Wang and C. Y. Chen, J. Phys. Chem. C, 2010, 114, 13532–13539 CAS.
  16. J. N. Coleman, U. Khan, W. J. Blau and Y. K. Gun'ko, Carbon, 2006, 44, 1624–1652 CrossRef CAS.
  17. J. N. Wang, Y. Z. Zhao and J. J. Niu, J. Mater. Chem., 2007, 17, 2251–2256 RSC.
  18. M. Winter and J. O. Besenhard, Lithiated Carbons, Handbook of Battery Materials, ed. J. O. Besenhard, Wiley-VCH Verlag GmbH, Weinheim, Germany, 1998, p. 17,  DOI:10.1002/9783527611676.
  19. M. Hess, E. Lebraud and A. Levasseur, J. Power Sources, 1997, 68, 204–207 CrossRef CAS.
  20. I. Alig, D. Lellinger, M. Engel, T. Skipa and P. Pötschke, Polymer, 2008, 49, 1902–1909 CrossRef CAS.
  21. G. A. Gelves, M. H. Al-Saleh and U. Sundararaj, J. Mater. Chem., 2011, 21, 829–836 RSC.
  22. I. Alig, P. Potschke, S. Pegel, S. Dudkin and D. Lellinger, Gummi, Fasern, Kunstst., 2007, 60, 280–283 CAS.
  23. E. Muñoz, D. S. Suh, S. Collins, M. Selvidge, A. B. Dalton, B. G. Kim, J. M. Razal, G. Ussery, A. G. Rinzler, M. T. Martínez and R. H. Baughman, Adv. Mater., 2005, 17, 1064–1067 CrossRef.
  24. V. Skakalova, U. Dettlaff-Weglikowska and S. Roth, Synth. Met., 2005, 152, 349–352 CrossRef CAS.
  25. C. Feng and L. Jiang, Composites, Part A, 2013, 47, 143–149 CrossRef CAS.
  26. G. D. Seidel and D. C. Lagoudas, J. Compos. Mater., 2009, 43, 917–941 CrossRef CAS.
  27. Z. Wang and X. Ye, Nanotechnology, 2013, 24, 265704 CrossRef PubMed.
  28. R. Vargas-Bernal, G. Herrera-Pérez, M. E. Calixto-Olalde and M. Tecpoyotl-Torres, Journal of Electrical and Computer Engineering, 2013, 179538 Search PubMed.
  29. C. Li, E. T. Thostenson and T. W. Chou, Appl. Phys. Lett., 2007, 91, 223114 CrossRef.
  30. T. Morishita, M. Matsushita, Y. Katagiri and K. Fukumori, J. Mater. Chem., 2011, 21, 5610–5614 RSC.
  31. F. Dalmas, R. Dendievel, L. Chazeau, J. Y. Cavaillé and C. Gauthier, Acta Mater., 2006, 54, 2923–2931 CrossRef CAS.
  32. A. L. Tripol'skii, T. G. Serebrii, N. V. Lemesh, T. S. Ivashchenko and P. E. Strizhak, Theor. Exp. Chem., 2009, 45, 103–107 CrossRef.
  33. G. Vera-Reveles, J. Simón, E. Briones and F. J. González, Microw. Opt. Technol. Lett., 2012, 54, 1251–1253 CrossRef.
  34. Y. C. Chiang and C. Y. Lee, J. Mater. Sci., 2009, 44, 2780–2791 CrossRef CAS.
  35. Y. Yin, T. Zhang, F. Yang and X. Qiu, Chaos, Solitons Fractals, 2008, 37, 1257–1266 CrossRef CAS.
  36. H. Lu and W. A. Huang, Appl. Phys. Lett., 2013, 102, 231910 CrossRef.
  37. H. Lu, Y. Yao and L. Lin, Pigm. Resin Technol., 2013, 43, 26–34 CrossRef.
  38. L. Liu, Z. Wang, J. Feng and X. Ye, J. Nanosci. Nanotechnol., 2013, 13, 989–992 CrossRef CAS PubMed.
  39. E. J. Severin, B. J. Doleman and N. S. Lewis, Anal. Chem., 2000, 72, 658–668 CrossRef CAS PubMed.
  40. J. F. Feller, H. Guézénoc, H. Bellegou and Y. Grohens, Macromol. Symp., 2005, 222, 273–280 CrossRef CAS.
  41. Z. F. Wang, J. M. Yang, X. Y. Ye, L. T. Liu and X. M. Xie, Key Eng. Mater., 2011, 483, 537–541 CrossRef CAS.
  42. S. Ansari and E. P. Giannelis, J. Polym. Sci., Part B: Polym. Phys., 2009, 47, 888–897 CrossRef CAS.
  43. F. Wang, H. Gu and T. M. Swager, J. Am. Chem. Soc., 2008, 130, 5392–5393 CrossRef CAS PubMed.
  44. H. A. Becerril, J. Mao, Z. Liu, R. M. Stoltenberg, Z. Bao and Y. Chen, ACS Nano, 2008, 2, 463–470 CrossRef CAS PubMed.
  45. Y. Hu, T. Zhao, P. Zhu, Y. Zhu, X. Shuai, X. Liang, R. Sun, D. D. Lu and C. P. Wong, J. Mater. Chem. C, 2016, 4, 5839–5848 RSC.
  46. V. Georgakilas, J. N. Tiwari, K. C. Kemp, J. A. Perman, A. B. Bourlinos, K. S. Kim and R. Zboril, Chem. Rev., 2016, 116, 5464–5519 CrossRef CAS PubMed.
  47. B. Debelak and K. Lafdi, Carbon, 2007, 45, 1727–1734 CrossRef CAS.
  48. M. S. Park, W. Joo and J. K. Kim, Langmuir, 2006, 22, 4594–4598 CrossRef CAS PubMed.
  49. S. Kirkpatrick, Rev. Mod. Phys., 1973, 45, 574 CrossRef.
  50. Y. Wang, D. C. Alsmeyer and R. L. McCreery, Chem. Mater., 1990, 2, 557–563 CrossRef CAS.
  51. F. Tuinstra and J. L. Koenig, J. Chem. Phys., 1970, 53, 1126–1130 CrossRef CAS.
  52. T. Jawhari, A. Roid and J. Casado, Carbon, 1995, 33, 1561–1565 CrossRef CAS.
  53. P.-H. Chen and D. D. L. Chung, Carbon, 2014, 77, 538–550 CrossRef CAS.
  54. M. Endo, T. Koyama and Y. Hishiyama, Jpn. J. Appl. Phys., 1976, 15, 2073 CrossRef CAS.
  55. N. Rey-Raap, E. G. Calvo, J. M. Bermúdez, I. Cameán, A. B. García, J. A. Menéndez and A. Arenillas, Measurement, 2014, 56, 215–218 CrossRef.
  56. L. Guadagno, M. Raimondo, V. Vittoria, L. Vertuccio, K. Lafdi, B. De Vivo, P. Lamberti, G. Spinelli and V. Tucci, Nanotechnology, 2013, 24, 305704 CrossRef PubMed.

Footnote

Aggregation part means the same process in flow chart (aggregation).

This journal is © The Royal Society of Chemistry 2016
Click here to see how this site uses Cookies. View our privacy policy here.