Self-assembly and controllable synthesis of graphene hydrogel adsorbents with enhanced removal of ciprofloxacin from aqueous solutions

Jie Ma*ab, Yiran Suna and Fei Yu*ab
aState Key Laboratory of Pollution Control and Resource Reuse, School of Environmental Science and Engineering, Tongji University, 1239 Siping Road, Shanghai 200092, P. R. China. E-mail: jma@tongji.edu.cn; Tel: +86-21-6598-1831
bCollege of Chemistry and Environmental Engineering, Shanghai Institute of Technology, Shanghai 2001418, China. E-mail: fyu@vip.163.com

Received 1st August 2016 , Accepted 29th August 2016

First published on 30th August 2016


Abstract

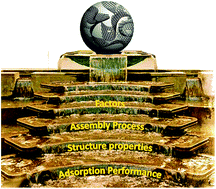
A convenient and efficient approach was applied for the assembly of graphene hydrogel (GH) adsorbents for the enhanced removal of ciprofloxacin (CIP) from an aqueous solution. Different structures and adsorption properties of the GH were obtained by adjusting the controlling factors, including the reductants, temperature, pH, and capping reagents. The physicochemical properties of the GH were systematically characterized by transmission electron microscopy (TEM), scanning electron microscopy (SEM), X-ray diffraction (XRD), X-ray photoelectron spectroscopy (XPS) and the Brunauer–Emmett–Teller (BET) method. The reductant, higher temperature and lower pH enhance the structural properties but reduce the adsorption performance. The capping reagent improves both structural and adsorption properties. The structural properties of the GH, including the specific surface area, adsorption sites, and hydrophobicity, are crucial for the adsorption performance of CIP onto GH. The adsorption mechanism is attributed to hydrogen bonding, π–π electron donor–acceptor (EDA) interaction and other interactions between CIP and GH. The best adsorption capacity in this paper can reach 312 mg g−1. These findings provide a reference for adjusting the structure and adsorption properties of GH, which could provide practical applications by controlling the assembly process and parameters.


1. Introduction

Antibiotics, a type of effective antimicrobial agent, have been used extensively worldwide in human disease and infectious disease therapy.1 China has been a major area of antibiotics abuse because of insufficient understanding and regulatory policy.2–4 Due to their poor metabolism and slow degradation, large amounts of antibiotics are discharged into surface and underground waters from metabolic products and hospital effluents, which results in increases of bacterial resistance and negative effects on water quality.5–7 Therefore, antibiotics are regarded as a persistent pollutant that harms water ecosystems even at low concentrations.8

Ciprofloxacin (CIP) is one of the most frequently detected quinolone antibiotics in the aquatic environment. CIP has high solubility in water and soil as well as good stability at different pHs. CIP can cause the diffusion of bacterial resistance and cause serious threats to human health and ecosystems.9,10 Thus, wastewater should be disposed of before it is discharged into the environment. Many methods, such as chemical oxidation,11 adsorption,12 and membrane technology,13 have been used to remove CIP from water. Of all the chemical, physical, and biological methods, adsorption is one of the most efficient ways to remove CIP from water due to its low cost, high efficiency, simplicity, and insensitivity to toxic substances.14,15

Due to their high specific surface area (SSA) and many oxygen-containing functional groups, carbon nanomaterials, such as graphene, carbon nanotubes, and fullerene, have been commonly used to absorb dyes,16 heavy metals,17 and organic pollutants18 as well as antibiotics, including CIP, from aqueous solutions.19–21 However, the adsorption process cannot completely remove pollutants but only transfers and concentrates them on the solid phase.9 Hence, separation and recycling costs are crucial for large-scale applications. Strong aggregation and stacking of carbon nanomaterials reduce their adsorption ability. Moreover, the difficulty in separating and recycling powder-like materials can cause secondary pollution to the environment.22 These issues restrict the application of nanomaterials for the removal of antibiotics from aqueous solutions. Scientists hope to overcome these problems by modifying carbon nanomaterials or recombining them with other materials to enhance their SSA and operability.23 The successful macroscopic three-dimensional (3D) self-assembly of carbon nanomaterials has become a trend in recent years.24 Macroscopic materials have high SSA and structural operability.25 Macroscopic structures not only reduce the difficulty of separating and recycling powder-like materials, but the 3D structures also maintain the stability of layers and prevent aggregation and invalid stacking, and the interconnections of the structures maintain or strengthen the excellent performance of carbon nanomaterials.26

Several macroscopic 3D graphene materials, such as foams,27 films,28 scaffolds,29 and hydrogels,30 have been developed in recent years. Based on their morphologies, we classify macroscopic 3D graphene materials into aerogels and hydrogels, both of which have 3D interconnected network structures. However, the space in the network structure of aerogel is filled with gas, while hydrogel's space is filled with water. Numerous adsorption studies have concentrated on applications of aerogels.31 However, the SSA of graphene aerogel decreases due to the surface tension of water in the freeze-drying process. Furthermore, the hydrophobicity of graphene aerogel reduces the contact with adsorbates in the water, which decreases the adsorption capacity. Therefore, we focus on graphene hydrogel (GH). The phenomenon of GH exhibiting excellent adsorption performance for antibiotic pollutants was identified in our previous studies.32 GH has a higher adsorption capacity and good adaptability under different conditions. In addition, the water within GH can enhance its adsorption properties.32 However, how to control the structural and adsorption properties of GH were still insufficient and the assembly process of GH hasn't been systematically studies, either.

Many methods, such as adding reductants, linkers, and other assistant agents, are currently used in the fabrication of GH. Adding chemical reducing agents, such as ascorbic acid and HI, and adding cross-linkers, such as polyvinyl alcohol (PVA), proteins, and metal ions, can both obtain GH efficiently.30,33,34 However, hydrogels obtained using different preparation methods or parameters have different structures and properties. In addition, no systematic study of the assembly process of GH has been performed, and the adsorption mechanism of antibiotics is still unclear. Moreover, most have poor mechanical properties and adsorption capacities, which makes them difficult to separate and recycle and prevents their use for water treatment applications. Therefore, it is important to obtain GH with excellent mechanical properties and adsorption capacity by controlling the preparation methods and parameters and better understanding the assembly process of GH and the adsorption mechanism of antibiotics.

In this paper, the reductants, temperature, pH, and capping reagents were regarded as controlling factors. An in-depth and detailed study of the structure and adsorption properties of GH obtained using different synthesis parameters was performed, and the effects of the four parameters on the GH were analyzed based on the assembly and adsorption mechanisms. The results provide a reference for the adjustment of the structures and adsorption properties of GH to meet the needs of practical applications by controlling the assembly process and parameters.

2. Experimental

2.1 Material and chemicals

All of the chemicals, such as ascorbic acid (VC), glutathione (GSH), oxidized glutathione (GSSG) and sodium bicarbonate (VC-Na), were purchased from Chemical Reagent Co., Ltd (Shanghai, China). They were analytical grade and were used directly without further purification. Graphite oxide (GO) was obtained using the modified Hummers' method.32 Aqueous suspensions of GO at concentrations of 2.0 mg ml−1 were prepared by dispersing GO in deionized water and sonicating it in an ultrasound bath for 6 h. Appropriate reducing agents were then added. The parameters are shown in Table 1. After intensive mixing, the mixed suspension was heated at a constant temperature in a glass vial for 12 h without stirring. The as-prepared GH was then dialyzed against deionized water for 12 h to remove residual compounds. The as-prepared GHs were freeze-dried to obtain graphene aerogels.
Table 1 Synthesis parameters of GHs
Adsorbent Concentration of GO (mg L−1) Reductant Quality ratio of GO to reductant Temperature (°C)
GSSG-G 2 GSSG 0.5 95
GSH-G 2 GSH 0.5 95
VC-G-1 2 VC 1.7 95
VC-G-2 2 VC 1 80
VC-G-3 2 VC 1 95
VC-Na-G 2 VC-Na 1 95


2.2 Characterization methods

The microstructure and morphology of the graphene aerogels were analyzed by high-resolution transmission electron microscopy (HRTEM; JEOL 2100F, Japan) and scanning electron microscopy (SEM; JSM-6400F). The structural phases and the average size of the aerogels were characterized by X-ray diffraction (XRD) experiments using a Siemens D5000 X-ray diffractometer (Cu Kα radiation, λ = 1.5406 Å) over a range of 10 ents with a rate of 1° min−1 and a step size of 0.02°. The BET isotherms were measured by an Accelerated Surface Area and Porosimetry system (Micromeritics, ASAP 2020). The surface functional groups were observed by X-ray photoelectron spectroscopy (XPS) analysis, which was performed on a Kratos Axis Ultra DLD spectrometer using monochromatic Al Ka X-rays at a base pressure of 1 × 10⁻⁹ Torr. Survey scans between 1100 and 0 eV revealed the overall elemental compositions of the samples, and regional scans were performed for specific elements. The peak energies were calibrated by placing the major C1s peak at 284.6 eV.

2.3 Batch adsorption experiments

Batch adsorption experiments were conducted in 25 ml headspace bottles equipped with Teflon-lined screw caps with 5 GH and 20 ml CIP solutions of different initial concentrations. The sample bottles were shaken on a shaker (TS-2102C, Shanghai Tensuclab Instruments Manufacturing Co., Ltd., China) and operated at a constant temperature of 25 °C and 150 rpm for 120 h. All the adsorption experiments are conducted at least in duplicate, and only the mean values have been reported. The maximum deviation for the duplicates is usually less than 5%. Blank experiments without the addition of adsorbent were analyzed to ensure that the decrease in the concentration was due to the adsorbent rather than by adsorption on the wall of the glass bottle or via volatilization. After adsorption, the samples were filtered and diluted for ultraviolet-visible (UV-vis) measurements.

The absorption capacity of the CIP (qe, mg g−1) was calculated using the following equation:

 
image file: c6ra19474e-t1.tif(1)
where C0 and Ce are the initial and residual concentrations of CIP (mg L−1), respectively, V is the initial volume of the solution (L), and m is the adsorbent weight (g).

The adsorption equilibrium data of the CIP on the adsorbents were fitted by the Langmuir model and the Freundlich model to assess their efficacies. All of the adsorption isotherms were nonlinear.

The Langmuir model can be expressed by the following equation:

 
image file: c6ra19474e-t2.tif(2)
where qe is the amount of CIP adsorbed per gram of adsorbent (mg g−1), C denotes the equilibrium concentration of CIP in the solution (mg L−1), KL represents the Langmuir constant (L mg−1), which is related to the affinity of the binding sites, and qm is a theoretical limit of the adsorption capacity when the monolayer surface is fully covered with dye molecules to assist in the comparison of the adsorption performance (mg g−1).

The Freundlich equation can be expressed by the following equation:

 
qe = KFC1/n (3)
where qe is the amount of CIP adsorbed per gram of adsorbent (mg g−1), C is the CIP equilibrium concentration in the solution (mg L−1), and KF and n are the Freundlich constants, which represent the adsorption capacity and the adsorption strength, respectively. The magnitude of 1/n quantifies the favorability of adsorption and the degree of heterogeneity of the adsorbent surface.

3. Results and discussion

3.1 Morphology and structure of the adsorbents

Fig. 1a shows the benign contact between the GH and water and the graphene aerogel floating on water, which reduces its contact with contaminants in the water and thus is unfavorable for the removal of contaminants from aqueous solutions. Fig. 1b shows the excellent mechanical performance of the GH structure. Fig. 1c shows an HRTEM image of a graphene aerogel, which illustrates a mixture of several graphene layers and their amorphous structure. Fig. 1d and e show SEM images of graphene aerogel. The surface microtopography of the VC-G aerogels shows a rough, porous structure that consists of graphene sheets.
image file: c6ra19474e-f1.tif
Fig. 1 Digital photographs of (a) GH and graphene aerogel in water; (b) GH pressed by weight; (c) HRTEM image of graphene aerogel; and (d, e) SEM images of graphene aerogel.

The structural properties of GO and the GHs were also studied by XRD. The XRD patterns of the GHs are shown in Fig. 2a–d, and the peaks and interlayer spacing of the GHs are summarized in Table S1. Based on the XRD patterns of the GHs, GO and natural graphite (Fig. 2e), GO has a large interlayer spacing of 0.807 nm (2θ = 11.0°) due to the presence of many oxygen-containing functional groups, such as hydroxyl, epoxy, and carboxyl groups. However, graphite has an interlayer spacing of 0.345 nm (2θ = 26.5°), within which the oxygen-containing functional groups are removed. A broad peak is centered around 2θ = 24°, which corresponds to an interlayer distance of 0.380 nm; this suggests poor ordering of the graphene sheets in their stacking direction in the GH and that some of the oxygen-containing groups are removed during the assembly process of GH.


image file: c6ra19474e-f2.tif
Fig. 2 Comparison of the XRD patterns of GSSG-G and GSH-G (a); GSH-G and VC-G-1 (b); VC-G-2 and VC-G-3 (c); VC-G-3 and VC-Na-G (d); and graphite, GH, and GO (e).

A comparison of the XRD patterns shows the following significant results. First, as shown in Fig. 2a, the patterns indicate that the peak of GSSG-G is at 2θ = 23.0°, while that of GSH-G is at 2θ = 24.6°, which indicates that the interlayer spacing of GSSG-G is greater than that of GSH-G. Thus, the addition of the reductant makes the GH's structure more compact. Second, the XRD patterns of GSH-G and VC-G-1 (Fig. 2b) show that the peak of GSH-G is at 2θ = 24.6°, while that of VC-G-1 is at 2θ = 25.0°, which illustrates that the interlayer spacing of GSH-G is greater than that of VC-G-1. This difference demonstrates that the addition of the capping reagent decreases the compactness of the GH structure. Third, the XRD patterns of VC-G-2 and VC-G-3 (Fig. 2c) show that the peak of VC-G-3 is at 2θ = 25.5°, and that of VC-G-2 is at 2θ = 24.0°, which indicates that the interlayer spacing of VC-G-2 is greater than that of VC-G-3. This result indicates that a higher temperature enhances the compactness of the GH structure. Finally, as shown in the XRD patterns of VC-G-3 and VC-Na-G (Fig. 2d), the peak of VC-G-3 is at 2θ = 25.5°, while that of VC-Na-G is at 2θ = 23.0°, which indicates that the interlayer spacing of VC-Na-G is greater than that of VC-G-3. These results show that the structure of GH obtained at lower pHs is more compact, while the structure is looser at higher pHs.

3.2 Physical properties of the adsorbents

Fig. 3a–d show the N2 adsorption/desorption isotherms of the GHs, and the detailed features are given in Table S2. A comparison of the SSAs of the GHs with the different synthesis parameters shows several results. First, the addition of the reductants enhances the SSA of the GHs. The SSA of GSH-G is much greater than that of GSSG-G, and they have nearly the same average pore size. Thus, the increase of the SSA is mainly due to the increase of the pore volume. Second, the addition of the capping reagent decreases the SSA of the GH. The SSA of VC-G-1 is significantly greater, which is closely related to the increases in both the average pore size and the pore volume. Third, the temperature contributes to the SSA of the GHs; the SSA of VC-G-3 is greater than that of VC-G-2. Moreover, the average pore size decreases at higher temperatures, while the pore volume increases significantly. Finally, the SSA of VC-G-3 is far greater than that of VC-Na-G, which indicates that lower pHs increase the SSA of the GH. This result is mainly caused by the increase in the pore volume. In conclusion, reductants, higher temperatures, and lower pHs enhance the SSA of GHs, primarily through the increase of pore volume, while the capping reagent decreases the SSA of GHs via the increases of the pore volume and the average pore size.
image file: c6ra19474e-f3.tif
Fig. 3 Comparison of N2 adsorption/desorption isotherms of GSSG-G and GSH-G (a); GSH-G and VC-G-1 (b); VC-G-2 and VC-G-3 (c); and VC-G-3 and VC-Na-G (d).

3.3 Composition of the adsorbents

Fig. 4a shows the wide scan XPS spectra of the GH, and Fig. 4b–g show the core-level spectra of C1s in each sample. The wide scan XPS spectra of GSSG-G and GSH-G (Fig. 4a and Table S3) show that the C/O ratios of GSSG-G and GSH-G are significantly different (3.24 and 4.89, respectively), which indicates that many oxygen-containing functional groups are removed during the reduction process. Second, the XPS spectra of GSH-G and VC-G-1 show that their C/O ratios are similar. However, GSH-G has additional peaks of S and N, which indicate that the GH contains GSSG. Third, the C/O ratios of VC-G-2 and VC-G-3 are 7.06 and 4.80, respectively, which indicates that higher temperatures enhance the reduction of GO. Finally, the C/O ratios of VC-G-3 and VC-Na-G are significantly different (7.06 and 6.24, respectively), which shows that higher pHs weaken the reduction of GO.
image file: c6ra19474e-f4.tif
Fig. 4 XPS spectra of the GHs: survey scans (a); C1s deconvolutions of GSSG-G (b); GSH-G (c); VC-G-1 (d); VC-G-2 (e); VC-G-3 (f); and VC-Na-G (g).

4. Assembly mechanism of GH

GO dispersion is always regarded as the precursor for the synthesis of GHs. GO acts as an amphiphilic molecule with a hydrophobic conjugate basal plane and hydrophilic edges that consist of –OH, –COOH and other oxygen-containing functional groups. GO sheets disperse stably and homogeneously due to the balance between π–π stacking, hydrophobic interaction between basal planes, and hydrogen-bond interactions between the functional groups. When reductants or other chemicals are added to the dispersion, some of the oxygen-containing functional groups are removed, which simultaneously recovers some of the aromatic structure and enhances the hydrophobicity. GO sheets tend to separate with a solution and reform a 3D GH due to π–π stacking and hydrogen bond interactions. The parameters described above, such as pH and temperature, influence the structure and adsorption properties of GH by controlling the assembly process.

We attempted to analyze the effects of the synthesis parameters on the GH structure from the assembly process of GH based on the assembly mechanism. We can understand the effect of reductants from the following aspects. First, the wide scan XPS spectra of GSSG-G and GSH-G (Fig. 4a) show that the C/O ratios of GSSG-G and GSH-G are significantly different (3.24 and 4.89, respectively). This indicates that many oxygen-containing functional groups are removed when GO is reduced. As a result, the electrostatic repulsion that is caused by these functional groups weakens, which recovers the aromatic structure of the carbon framework, enhances the degree of interaction and makes the region between the sheets more compact. The reduction of the oxygen-containing functional groups also weakens the hydrophilicity, namely the dispersity of the GO sheets in water, which provides more opportunities for interactions between the GO sheets. Therefore, reductants make the GH structure more compact.

Because VC-G-1 and GSH-G have the same degree of reduction, we attempt to explain the difference in the interlayer spacing by the effect of the capping reagent on the assembly process of GH. First, GSH plays a significant role as a capping reagent to stabilize graphene sheets because the terminal carboxylic acids may supply a sufficient negative charge, and the electrostatic repulsion can give the graphene nanosheets a stable dispersion in both aqueous solutions, which prevents their agglomeration and precipitation.35 Second, the additional S and N peaks in the XPS results indicate that GSH acts as a spacer during the assembly process, which prevents the contact and agglomeration of the graphene sheets. Therefore, the addition of the capping reagent enhances the mechanical properties.

The effect of temperature can also be understood from the reduction process. The wide scan XPS spectra (Fig. 4a) show that there is a clear difference in the C/O ratios of VC-G-3 and VC-G-2 (7.06 and 6.40, respectively), which indicates that higher temperatures increase the degree of reduction of GO. Subsequently, more oxygen functional groups are removed, which weakens the electrostatic repulsion. Thus, the combination of GO sheets is more compact. Therefore, higher temperatures can improve the mechanical properties of GH. In particular, higher temperatures are beneficial to the formation of wrinkles during the synthesis of GH.36 The disturbance is caused by the heat generated by the evaporation of water; the wrinkles form from the uneven traction of the GO sheets. Higher temperatures generate more and larger wrinkles. This indicates that the total SSA increases.

The effect of pH on the GH structure can be partially understood from the degree of reduction. First, the wide scan XPS spectra (Fig. 4a) show that the C/O ratios of VC-G-3 and VC-Na-G are significantly different (7.06 and 6.24, respectively). This indicates that higher pHs weaken the degree of reduction of GO. The analysis of the reduction process shows that the lower degree of reduction caused by the higher pH weakens the mechanical properties of the GH. Furthermore, at lower pHs, the –COOH tends to be protonated, and the electrostatic repulsion between the GO sheets weakens, which promotes interactions between them. Conversely, at higher pHs, deprotonation of –COOH enhances the electrostatic repulsion. The dispersion system tends to be stable, which weakens the reactions between layers. Thus, the structure of the GH is looser, and the mechanical properties are weaker than that at a lower pH. Therefore, lower pH conditions make the GH structure more compact.

5. Adsorption properties

5.1 Effect of the reductant

To more easily obtain GH, reductants are added to the GO dispersion to obtain chemically reduced GO. Several types of reductants, such as HI, NaHSO3, ascorbic acid, and metals, have been used to prepare GH.37,38 The addition of reductants can remove some oxygen-containing functional groups from the GO sheets, but several points remain unclear. How does the reduction influence the assembly process and structures of the GH? Whether reduction affects the adsorption performance of CIP onto GH has not been investigated. Moreover, we still do not understand whether different reductants may introduce different impurities into the hydrogel and whether impurities have an effect on the GH. Therefore, it is necessary to explore the impacts of reductants on the structure and adsorption performance of GH.

GSH and GSSG are two forms of glutathione. When two molecules of GSH are oxidized, one GSSG is obtained through the formation of S–S and the removal of H in the sulfhydryl of GSH. Both can intercalate during the assembly of GH, but GSH can simultaneously reduce GO. GSH and GSSG were chosen to avoid interference of impurities during the assembly of GH. Therefore, contrast experiments were performed using two GSHs and one GSSG to react with the GO dispersion to analyze the structure and adsorption performance of GH at different degrees of reduction.

Adsorption equilibrium isotherm experiments were designed to evaluate the adsorption characteristics of CIP onto GH. Fig. 5 shows the Langmuir and Freundlich fits, and the regression data for GSSG-G or GSH-G and the parameters of the two models are tabulated in Table 2. In the Freundlich model, the values of 1/n are all less than 1, which indicates favorable adsorption. The coefficients of determination (R2) of the Langmuir model are higher than those of the Freundlich model for CIP. Therefore, the Langmuir model is more suitable to simulate the CIP adsorption isotherms. This shows that there are homogeneous adsorption sites in GH. Moreover, the maximum adsorption capacity (qe) of GSSG-G is greater than that of GSH-G, which indicates that reductants reduce the adsorption performance.


image file: c6ra19474e-f5.tif
Fig. 5 Equilibrium adsorption isotherms of CIP on GSSG-G and GSH-G.
Table 2 Langmuir and Freundlich model parameters of CIP adsorption on GSSG-G and GSH-G
Adsorbents Langmuir Freundlich
KL (mg−1) Qm (mg g−1) R2 KF N R2
GSH-G 0.272 243 0.967 102 5.36 0.870
GSSG-G 0.233 312 0.974 112 4.46 0.914


According to the results in the previous section, the reduction process decreases the adsorption capacity of CIP onto GH. The following factors can explain these results. First, a comparison of the BET surface areas shows that the surface area significantly increases after reduction, which is beneficial for the adsorption capacity. However, hydrogen bonds play a significant role in the adsorption of CIP by GH at this time. The –C[double bond, length as m-dash]O, –NH2 and –OH in the CIP acted as electron donors, and the –COOH in the GH took on electron acceptors. A comparison of Fig. 1c and d shows that a significant amount of COOH is removed after the reduction process, which reduces the number of adsorption sites in the GH and decreases the adsorption capacity. In addition, many hydrophilic oxygen-containing functional groups are removed during the reduction process, which increases the hydrophobicity of the GH surface. This reduces the contact between the GH and CIP in the solutions, which decreases the adsorption capacity of the GH. We infer that adsorption sites play a greater role than BET in the adsorption process of CIP because only adsorption sites are available for the adsorbate.

In conclusion, after the reduction process, in addition to the decrease of adsorption sites and hydrophilicity, GH's adsorption performance was weakened despite the increase of the SSA. However, the graphene sheets became compacted, and GH's mechanical properties were enhanced, which improved the separation and recycling performance of the adsorbents.

5.2 Effect of the capping reagent

Adding chemical reductants to the GO dispersion is a common approach to produce GH. However, during the formation process, chemically reduced GO sheets are likely to irreversibly form agglomerates. Under these conditions, adding capping reagents is an easy way to assist the formation of the 3D GH structure. Many capping reagents have been applied in the assembly process of GH, such as polymers and surfactants.39 The main effect of a capping reagent is to stabilize the graphene sheets and prevent agglomeration. However, it is still unclear whether capping reagents have an effect on the adsorption performance of GH.

Both GSH and VC can reduce GO during the synthesis of GH. However, as a tripeptide, GSH can also be used as a capping reagent of GO sheets. Therefore, we chose 2 GSH and 1 VC to react with GO and obtained GSH-G and VC-G-1 to investigate the structure and adsorption performance of GH with and without a capping reagent at the same degree of reduction.

As shown in Fig. 6, the adsorption isotherms of GSH-G and VC-G-1 are calculated by the Langmuir and Freundlich models. The model parameters are listed in Table 3. The R2 values show that the adsorption isotherms are fitted well by both the Langmuir and the Freundlich models. The adsorption capacity of CIP on GSH-G is 243 mg g−1, which is higher than that of VC-G-1 (219 mg g−1). Both values of RL are between 0 and 1, and the n values are between 1 and 10, which indicate that the adsorption is favorable. The maximum adsorption capacity (qe) of CIP onto GSH-G is greater than that of VC-G-1, which illustrates that the capping reagent can enhance the adsorption capacity of GH.


image file: c6ra19474e-f6.tif
Fig. 6 Equilibrium adsorption isotherms of CIP on VC-G-1 and GSH-G.
Table 3 Langmuir and Freundlich model parameters of CIP adsorption on VC-G-1 and GSH-G
Adsorbents Langmuir Freundlich
KL (mg−1) Qm (mg g−1) R2 KF N R2
GSH-G 0.272 243 0.967 102 5.36 0.870
VC-G-1 0.117 219 0.950 62.9 3.71 0.966


The result that the capping reagent can improve the adsorption capacity of GH can be understood from the change in the GH's structure that is caused by the capping reagent. Several factors could cause this result. The comparison of the BETs shows that the SSA of VC-G-1 is greater than that of GSH-G, which indicates that the capping reagent can decrease the SSA of GH, which decreases the adsorption capacity of the hydrogel. We attribute the improvement of the adsorption capacity to the additional GSSG, which contains many oxygen functional groups, such as –COOH and –C[double bond, length as m-dash]O. These groups provide more adsorption sites for CIP. This is shown in Fig. 4c and d and Table 4, where GSH-G and VC-G-1 have significantly different –COOH contents. In addition, the capping reagent makes the combination between the graphene sheets more stable and enhances its mechanical properties, which is favorable for the separation and recycling of the GH adsorbent.

Table 4 Langmuir and Freundlich model parameters of CIP adsorption on VC-G-2 and VC-G-3
Adsorbents Langmuir Freundlich
KL (mg−1) Qm (mg g−1) R2 KF N R2
VC-G-2 0.126 214 0.949 62.0 3.60 0.963
VC-G-3 0.144 199 0.970 59.8 3.64 0.949


In conclusion, the capping reagent improves the adsorption performance by providing more adsorption sites and enhancing the separation and recycling properties. Moreover, the capping reagent enhances the mechanical properties of the GH by preventing agglomeration of the graphene sheets and supporting and separating the graphene sheets.

5.3 Effect of temperature

Temperature is another important factor in the assembly process of GH. It has been reported that GH can be obtained by hydrothermal reduction.40 Heating is also widely used to assist in the assembly of GH.41 However, different temperatures have been used in various preparation methods, which has resulted in different 3D GHs with different structures and properties.37,38 Few studies have analyzed the effect of temperature on the assembly process, structure and adsorption performance of GH.

We chose VC as a reductant to assemble GH; comparative experiments were performed at 80 °C and 95 °C. VC-G-2 and VC-G-3 were obtained to evaluate the structure and adsorption performance of GH at different temperatures.

Fig. 7 shows the equilibrium isotherms for the adsorption of CIP onto VC-G-2 and VC-G-3. The equilibrium adsorption characteristics are analyzed by the Langmuir and Freundlich isotherm models. The parameters obtained from nonlinear regressions by both models are shown in Table 4. The coefficients of determination show that both models fit the adsorption isotherm well. Both values of RL are between 0 and 1, and the n values are between 1 and 10, which indicates that the adsorption is favorable. However, the adsorption capacity of CIP onto VC-G-2 is greater than that onto VC-G-3, which shows that higher temperatures have an unfavorable influence on the adsorption capacity of GH. The difference in the adsorption performance can be understood from the difference of the GH's structure that is caused by temperature. As shown in the wide scan XPS spectra of VC-G-2 and VC-G-3 (Fig. 4a), the C/O ratios of VC-G-2 and VC-G-3 are significantly different (4.97 and 7.06, respectively). This indicates that the higher temperature enhanced the degree of reduction of GO. Based on the analysis in the first section, we conclude that the higher degree of reduction caused by the higher temperature weakens the adsorption performance of the GH. The comparison of the BETs (Table 3) shows that the SSA increases with higher temperatures, which enhances the adsorption capacity of CIP onto GH. However, because more oxygen-containing functional groups were removed in VC-G-3 (Table 4), fewer adsorption sites are available for CIP, which is equivalent to a decrease in the adsorption capacity of GH. In addition, the removal of more hydrophilic functional groups enhances the hydrophobic properties of the GH. This decreases the contact area of the CIP and GH. Therefore, higher temperatures decrease the adsorption capacity of GH.


image file: c6ra19474e-f7.tif
Fig. 7 Equilibrium adsorption isotherms of CIP on VC-G-2 and VC-G-3.

In conclusion, higher temperatures weaken the adsorption capacity by increasing the degree of reduction during the assembly of GH and enhancing the mechanical properties. Higher temperatures also promote the formation of wrinkles.

5.4 Effect of pH

The pH is a significant indicator of GO dispersion. GO sheets exhibit different surface properties at different pH values. Shih et al. observed GO dispersion at different pHs by adjusting the dispersion from pH 1 to pH 14 using HCl and NaOH solutions and found that GO does not behave like conventional surfactants in pH 1 and 14 aqueous solutions.42 Understanding the pH-dependent behavior of GO dispersion is important for the assembly and application of GH. Shin and his group introduced an ice template approach to assembling 3D graphene networks and controlled their morphology by varying the pH during the ice template process.43 They showed that 3D porous graphene microfoams formed below pH 8 and that hierarchically porous graphene nanoscroll networks formed at pH 10. Therefore, it is important to understand the effect of pH on the assembly process of GH and its structure and adsorption performance.

In contrast to a previous study, which adjusted the pH using HCl, NaOH or NH3·H2O,43 we chose VC-Na and VC to conduct comparative experiments. We chose these compounds because the addition of HCl, NaOH or NH3·H2O may introduce impurities, and because the addition of NaOH solution may cause precipitation from the solution due to the salting out effect.44

VC-Na is an alkaline form of VC. It is fairly reducible, but it has a different pH; the pH of VC is 5.8–6.2, while that of VC-Na is 7.0–8.0. Based on these properties, both can act as reductants in the preparation of GH, but the pH of the solution is different. Moreover, unlike adjusting pH using HCl or NH3·H2O, the change of pH does not have other unknown effects. Therefore, VC-G-3 and VC-Na-G, which were prepared by the reaction of graphene oxide with VC and VC-Na, respectively, were used to investigate the structure and adsorption performance of GH at different pHs.

Fig. 8 shows the equilibrium isotherms and the regressions of the Langmuir and Freundlich models for the adsorption of CIP onto VC-G-3 and VC-Na-G. Table 5 summarizes the parameters and the coefficients of determination (R2) of the Langmuir and Freundlich isotherms of VC-G-3 and VC-Na-G. The R2 values indicate that the Langmuir model fits the adsorption data better than the Freundlich model. The applicability of the Langmuir model suggests that homogeneous adsorption sites are involved in the GH. The qe values of VC-G-3 and VC-Na-G show that the maximum adsorption capacity of VC-Na-G is greater than that of VC-G-3, which indicates that higher pHs enhance the adsorption property.


image file: c6ra19474e-f8.tif
Fig. 8 Equilibrium adsorption isotherms of CIP on VC-G-3 and VC-Na-G.
Table 5 Langmuir and Freundlich model parameters of CIP adsorption on VC-G-3 and VC-Na-G
Adsorbents Langmuir Freundlich
KL (mg−1) Qm (mg g−1) R2 KF N R2
VC-G-3 0.144 199 0.970 59.8 3.64 0.949
VC-Na-G 0.103 274 0.973 66.8 3.14 0.930


The difference in the adsorption performance can be understood from the difference of the GH's structure that is caused by the pH. We conclude that the following factors caused this result. First, a higher pH decreases the SSA, which decreases the adsorption capacity of GH (Table 3). However, π–π electron donor–acceptor (EDA) interaction plays an important role in the adsorption of CIP by GH. The –OH in the GH acts as electron donors, while the nitrogen-containing heterocyclic rings and fluorine-containing benzene rings in the CIP and –COOH in the GH take on electron acceptors. As shown in Fig. 4f and g and Table 4, at higher pHs, more –COOH in the hydrogel tends to be deprotonated, which reduces the acceptance of electrons and weakens the competition with CIP. The π–π EDA interaction between CIP and GH strengthens, which increases the adsorption capacity of CIP by GH. Moreover, lower pHs increase the degree of reduction of GO sheets (Table 4). According to the discussion of the reduction, higher pHs result in a lower degree of reduction, which results in a higher adsorption capacity.

In conclusion, a higher pH enhances the adsorption capacities by weakening the degree of reduction and enhancing the deprotonation of –COOH during the assembly of GH. At the same time, a higher pH loosens the GH structure, weakens the mechanical properties, and thus decreases the separation and recycling properties.

6. Adsorption mechanism

The adsorption performance of adsorbents depends on the SSA, the adsorption sites, and the hydrophobicity of the materials. SSA is a regarded as an important indicator to evaluate the adsorption capacity of adsorbents. However, the adsorption capacity is also related to the pore size distributions and the size of the adsorbate. The size of CIP is approximately 1.5 nm. Thus, mesopores with sizes between 2 and 50 nm are suitable for CIP adsorption. The adsorption sites are another important indicator for adsorbents. Only adsorption sites are available for pollutants to be removed by adsorbents. Therefore, the content of adsorption sites on GH is a controlling factor for the adsorption capacity of CIP. There are main two pathways in the adsorption process of CIP onto GH: π–π EDA interaction and hydrogen bonding between CIP and GH. The mechanisms are as follows. (a) In π–π EDA interaction, the –OH in the GH acts as electron donors, while the nitrogen-containing heterocyclic rings and fluorine-containing benzene rings in the CIP and the carboxyl groups in the GH simultaneously take on electron acceptors. (b) In the formation of hydrogen bonding, the C[double bond, length as m-dash]O, NH2, and –OH in the CIP act as electron donors, and the COOH in the GH takes on electron acceptors. The contents of the oxygen-containing functional groups in the GH structure, especially –OH and –COOH, are crucial for CIP adsorption. The analysis of the XPS spectra indicated that the –COOH content varies with changes in the synthesis parameters. For example, –COOH decreases when reductants are added, and the electron acceptors during the formation of hydrogen bonding decrease, which weakens the adsorption capacity. In addition, the hydrophobicity of GH plays a significant role in CIP removal due to the contact between the GH and CIP adsorbate. The lower the GH's hydrophobicity, the easier the CIP in the aqueous solution can contact the adsorbent. Therefore, the SSA, adsorption sites and hydrophobicity of GH play significant roles during the adsorption of CIP.

7. Conclusion

GHs were synthesized under different conditions using VC-Na, VC, GSH and GSSG. The effects of the parameters, including the reductants, pH, temperature and capping reagents, on the assembly process, structure and adsorption properties were discussed. The reductant, higher temperature, and lower pH make graphene sheets more compact and thus enhance the mechanical properties of GH, but they reduce the adsorption performance of CIP onto GH. However, the capping reagent not only enhances the mechanical properties by preventing aggregation and combining the graphene sheets but also improves the adsorption performance of CIP onto GH due to its supporting and separating role. Comparative experiments were also performed to analyze the assembly process and adsorption mechanism of GH adsorbents. The adsorption mechanism of CIP onto GH mainly includes hydrogen bonding and π–π EDA interaction. Some structural properties of GH, namely SSA, adsorption sites, and hydrophobicity, play significant roles in the adsorption performance. Therefore, based on the assembly process and adsorption mechanism, GH with an excellent structure and adsorption performance can be obtained by controlling the synthesis parameters, which allows GH adsorbents to be adjusted for practical applications.

Acknowledgements

This research was supported by the National Natural Science Foundation of China (grant no. 21577099 and 51408362).

References

  1. P. A. Segura, M. François, C. Gagnon and S. Sauvé, Environ. Health Perspect., 2009, 117, 675 CrossRef CAS PubMed.
  2. L. Zhao, Y. H. Dong and H. Wang, Sci. Total Environ., 2010, 408, 1069–1075 CrossRef CAS PubMed.
  3. G. Na, X. Fang, Y. Cai, L. Ge, H. Zong, X. Yuan, Z. Yao and Z. Zhang, Mar. Pollut. Bull., 2013, 69, 233–237 CrossRef CAS PubMed.
  4. J. Currie, W. Lin and W. Zhang, J. Health Econ., 2011, 30, 933–949 CrossRef PubMed.
  5. R. Wei, F. Ge, S. Huang, M. Chen and R. Wang, Chemosphere, 2011, 82, 1408–1414 CrossRef CAS PubMed.
  6. I. Michael, L. Rizzo, C. McArdell, C. Manaia, C. Merlin, T. Schwartz, C. Dagot and D. Fatta-Kassinos, Water Res., 2013, 47, 957–995 CrossRef CAS PubMed.
  7. P.-Y. Hong, N. Al-Jassim, M. I. Ansari and R. I. Mackie, Antibiotics, 2013, 2, 367–399 CrossRef CAS PubMed.
  8. W. Li, Y. Shi, L. Gao, J. Liu and Y. Cai, Environ. Pollut., 2012, 162, 56–62 CrossRef CAS PubMed.
  9. V. Homem and L. Santos, J. Environ. Manage., 2011, 92, 2304–2347 CrossRef CAS PubMed.
  10. N. Genç, E. C. Dogan and M. Yurtsever, Water Sci. Technol., 2013, 68, 848–855 CrossRef PubMed.
  11. B. De Witte, J. Dewulf, K. Demeestere and H. Van Langenhove, J. Hazard. Mater., 2009, 161, 701–708 CrossRef CAS PubMed.
  12. Y. Sun, Q. Yue, B. Gao, Y. Gao, X. Xu, Q. Li and Y. Wang, J. Taiwan Inst. Chem. Eng., 2014, 45, 681–688 CrossRef CAS.
  13. F. Zaviska, P. Drogui, A. Grasmick, A. Azais and M. Héran, J. Membr. Sci., 2013, 429, 121–129 CrossRef CAS.
  14. V. Gupta, B. Gupta, A. Rastogi, S. Agarwal and A. Nayak, J. Hazard. Mater., 2011, 186, 891–901 CrossRef CAS PubMed.
  15. F. Yu, J. Ma and D. Bi, Environ. Sci. Pollut. Res., 2015, 22, 4715–4724 CrossRef CAS PubMed.
  16. J. Ma, F. Yu, L. Zhou, L. Jin, M. X. Yang, J. S. Luan, Y. H. Tang, H. B. Fan, Z. W. Yuan and J. H. Chen, ACS Appl. Mater. Interfaces, 2012, 4, 5749–5760 CAS.
  17. F. Yu, Y. Q. Wu, J. Ma and C. Zhang, J. Environ. Sci., 2013, 25, 195–203 CrossRef CAS.
  18. F. Yu, J. Ma, J. Wang, M. Z. Zhang and J. Zheng, Chemosphere, 2016, 146, 162–172 CrossRef CAS PubMed.
  19. H. Chen, B. Gao and H. Li, J. Hazard. Mater., 2015, 282, 201–207 CrossRef CAS PubMed.
  20. H. Li, D. Zhang, X. Han and B. Xing, Chemosphere, 2014, 95, 150–155 CrossRef CAS PubMed.
  21. F. Yu, S. N. Sun, S. Han, J. Zheng and J. Ma, Chem. Eng. J., 2016, 285, 588–595 CrossRef CAS.
  22. K. Yang, Y. Li, X. Tan, R. Peng and Z. Liu, Small, 2013, 9, 1492–1503 CrossRef CAS PubMed.
  23. S. Wang, H. Sun, H.-M. Ang and M. Tadé, Chem. Eng. J., 2013, 226, 336–347 CrossRef CAS.
  24. S. Kumar and K. Chatterjee, Nanoscale, 2015, 7, 2023–2033 RSC.
  25. H. Sehaqui, Q. Zhou and L. A. Berglund, Compos. Sci. Technol., 2011, 71, 1593–1599 CrossRef CAS.
  26. H. Jo, H. Noh, M. Kaviany, J. M. Kim, M. H. Kim and H. S. Ahn, Carbon, 2015, 81, 357–366 CrossRef CAS.
  27. X. Cao, Y. Shi, W. Shi, G. Lu, X. Huang, Q. Yan, Q. Zhang and H. Zhang, Small, 2011, 7, 3163–3168 CrossRef CAS PubMed.
  28. L. Estevez, A. Kelarakis, Q. Gong, E. H. Da'as and E. P. Giannelis, J. Am. Chem. Soc., 2011, 133, 6122–6125 CrossRef CAS PubMed.
  29. M. Jahan, Q. Bao and K. P. Loh, J. Am. Chem. Soc., 2012, 134, 6707–6713 CrossRef CAS PubMed.
  30. H. Bai, C. Li, X. Wang and G. Shi, Chem. Commun., 2010, 46, 2376–2378 RSC.
  31. X. Mi, G. Huang, W. Xie, W. Wang, Y. Liu and J. Gao, Carbon, 2012, 50, 4856–4864 CrossRef CAS.
  32. J. Ma, M. Yang, F. Yu and J. Zheng, Sci. Rep., 2015, 5, 13578 CrossRef PubMed.
  33. C. Huang, H. Bai, C. Li and G. Shi, Chem. Commun., 2011, 47, 4962–4964 RSC.
  34. K.-x. Sheng, Y.-x. Xu, L. Chun and G.-q. Shi, New Carbon Mater., 2011, 26, 9–15 CrossRef CAS.
  35. T. A. Pham, J. S. Kim, J. S. Kim and Y. T. Jeong, Colloids Surf., A, 2011, 384, 543–548 CrossRef CAS.
  36. L. Qiu, X. Zhang, W. Yang, Y. Wang, G. P. Simon and D. Li, Chem. Commun., 2011, 47, 5810–5812 RSC.
  37. X. Zhang, Z. Sui, B. Xu, S. Yue, Y. Luo, W. Zhan and B. Liu, J. Mater. Chem., 2011, 21, 6494–6497 RSC.
  38. W. Chen, S. Li, C. Chen and L. Yan, Adv. Mater., 2011, 23, 5679–5683 CrossRef CAS PubMed.
  39. S. Niyogi, E. Bekyarova, M. Itkis, J. McWilliams, M. Hamon and R. Haddon, J. Am. Chem. Soc., 2006, 128, 7720 CrossRef CAS PubMed.
  40. Y. Xu, K. Sheng, C. Li and G. Shi, ACS Nano, 2010, 4, 4324–4330 CrossRef CAS PubMed.
  41. W. Chen and L. Yan, Nanoscale, 2011, 3, 3132–3137 RSC.
  42. C.-J. Shih, S. Lin, R. Sharma, M. S. Strano and D. Blankschtein, Langmuir, 2011, 28, 235–241 CrossRef PubMed.
  43. Y.-E. Shin, Y. J. Sa, S. Park, J. Lee, K.-H. Shin, S. H. Joo and H. Ko, Nanoscale, 2014, 6, 9734–9741 RSC.
  44. R. L. Whitby, V. M. Gun’ko, A. Korobeinyk, R. Busquets, A. B. Cundy, K. László, J. Skubiszewska-Zięba, R. Leboda, E. Tombácz and I. Y. Toth, ACS Nano, 2012, 6, 3967–3973 CrossRef CAS PubMed.

Footnote

Electronic supplementary information (ESI) available. See DOI: 10.1039/c6ra19474e

This journal is © The Royal Society of Chemistry 2016
Click here to see how this site uses Cookies. View our privacy policy here.