
Mesoporous graphitic carbon nitride functionalized iron oxides for promoting phenol oxidation activity†
Lei Luoa,
Anfeng Zhanga,
Michael J. Janikb,
Chunshan Song*ab and
Xinwen Guo*a
aState Key Laboratory of Fine Chemicals, PSU-DUT Joint Center for Energy Research, School of Chemical Engineering, Dalian University of Technology, Dalian 116024, P. R. China
bEMS Energy Institute, PSU-DUT Joint Center for Energy Research, Department of Energy & Mineral Engineering, Pennsylvania State University, University Park, Pennsylvania 16802, USA
First published on 20th September 2016
Abstract
Mesoporous graphitic carbon nitride was found to be a superior support of iron oxides, improving the dispersion, adjusting the iron oxidation state, and promoting the catalytic oxidation of phenol. The physicochemical characteristics of the as-prepared FeOx/g-C3N4 were evaluated by XRD, FT-IR, TEM, N2 sorption and XPS, which together revealed the influence of the g-C3N4 support on the physicochemical properties of FeOx. The catalytic activity was evaluated by phenol oxidation reaction under ambient condition. Importantly, FeOx are highly dispersed and due to the large SBET and the support's amino group's adjusting the crystallization process of Fe(III). The carbon nitride supported catalyst attained 80% conversion in 30 minutes for phenol oxidation under equivalent conditions to which a SBA-15 supported Fe catalyst only achieved 3% conversion within 60 minutes. We speculate that the partial pyrolysis of g-C3N4 leads to the formation of carbon and nitride fragments that alter the redox properties during the formation of FeOx, therefore, producing more Fe(II) species, which contributes to enhanced Fenton activity. The strategy of using mesoporous g-C3N4 as a support is a reliable method for preparing highly dispersed transition metal oxides with adjustable physicochemical state.
1 Introduction
Catalytic wet Fenton oxidation is an effective method for the destruction of water pollution through strong oxidation by hydroxyl radicals (·OH).1–4 Compared with the conventional homogeneous Fenton process, a heterogeneous Fenton system can operate outside the homogeneous system's limited pH range of 2–4, including near neutral pH.3–5 The heterogeneous Fenton system, however, has limited activity and stability.5–7 As hydroxyl radicals are generated by Fe(II) induced peroxide decomposition, increasing the Fe(II) content8,9 and promoting the redox cycle of Fe(II) species10–13 will enhance the activity. In parallel, metal dispersion also affects the activity.14,15 Preparation of an iron-based catalyst with high Fe(II) species content and high dispersion is necessary to improve the catalytic activity of heterogeneous Fenton catalysts.Iron oxide is one of the most common active components of heterogeneous Fenton catalysts. Compared with hematite (α-Fe2O3), magnetite (Fe3O4) shows higher initial reactant conversion due to its higher Fe(II) content. Bimetallic catalysts, such as Fe–Cu11,16 and Fe–Ce,17 show enhanced activity because the second metal component reduces the oxidation–reduction potential of Fe3+ → Fe2+ and therefore promotes the catalytic cycle process of Fe(II) species. As higher dispersion usually leads to the better performance,18 high surface area supports are typically used to improve the dispersion. Many materials, including alumina, ordered mesoporous silica, zeolites, and MOFs, have been used as iron oxide Fenton catalyst supports. These supports, however, cannot effectively stabilize a high content of Fe(II) species.
Recently, graphitic carbon nitride (g-C3N4) has been studied for a number of applications including photocatalytic water splitting,19–21 CO2 capture,22,23 metal ion detection,24 and photocatalytic pollutant degradation.25 Generally, g-C3N4 is synthesized by the thermal condensation of nitrogen-rich precursors, such as urea,26 cyanamide,27–29 thiourea,30 dicyandiamide,31 and melamine,32 and is nonporous making it not useful as a catalyst support. Mesoporous g-C3N4 can be synthesized by nanocasting onto a mesoporous sacrificial agent. Vinu33–35 synthesized ordered mesoporous g-C3N4 with carbon tetrachloride and ethylenediamine as precursors and mesoporous siliceous materials (SBA-15, SBA-16, and KIT-6) as sacrificial templates. Much emphasis is given on the synthesis of mesoporous g-C3N4 using a sacrificial silica gel template and various nitrogen and carbon precursors including guanidine hydrochloride, urea, and ammonium thiocyanate.26,36,37 To the best of our knowledge, synthesis of iron oxides supported mesoporous g-C3N4 for phenol oxidation has not been previously reported.
In this work, mesoporous g-C3N4 synthesized from colloidal silica and melamine was used as the support to improve the iron dispersion as well as to increase the Fe(II) content. N2 physical adsorption was used to characterize the mesopores of the g-C3N4, and HRTEM and XPS were applied to identify the metal dispersion and Fe(II) species, respectively. The catalytic performance of FeOx/g-C3N4 were evaluated by phenol oxidation under ambient condition. The structure–activity relationship was examined based on our analytical characterization.
2 Experimental
2.1 Chemicals and materials
Melamine (C3H6N6), ferric nitrate (Fe(NO3)3·9H2O), colloidal silica (30 wt% SiO2), phenol (C6H6O), peroxide (H2O2) and distilled water were used. All above materials are used without further purification.2.2 Preparation of g-C3N4 and mesoporous g-C3N4 support
g-C3N4 was synthesized by a thermal condensation route. 50 g of melamine was placed in a crucible and calcinated at 550 °C for 3 h at a heating rate of 10 °C min. Mesoporous g-C3N4 was synthesized similarly to a procedure in the literature29 except that melamine was used as the carbon and nitrogen source and colloidal silica as the template. After removal of SiO2, the as-prepared mesoporous g-C3N4 is noted as Mx, where x represents the mass ratio of SiO2 to melamine in the synthesis procedure. For example, the M30 sample was prepared with 10.0 g melamine mixed with 10.0 g silica gel (30 wt% SiO2) and 50 mL methanol. The obtained mixture was stirred at 35 °C for 1 h and heated to 80 °C for drying. The dried products were calcined at 550 °C for 3 h at a heating rate of 10 °C min. Mesoporous g-C3N4 were recovered by centrifugation after dissolution of SiO2 nanoparticles in 40 wt% HF aqueous solution, washed with ethanol and distilled water several times, and dried at 100 °C.2.3 Preparation of iron-based catalysts
Iron-based catalysts were prepared by incipient wetness impregnation by supporting 5 wt% ferric nitrate on the as-prepared g-C3N4. This specific weight loading was chosen to allow direct comparison with our previous studies of Fe catalysts for the same reaction.18 The iron-based mesoporous g-C3N4 are labeled as FeMx, where x represents the mass ratio of SiO2 to melamine. For preparation of FeM30, 1.0 g sample M30 was mixed with Fe(NO3)3 aqueous solution which contains 0.05 g iron and left at ambient conditions for 12 h. After drying at 100 °C, the powder was ground and calcined at 450 °C for 3 h at a heating rate of 2 °C min−1. We also prepared physical mixtures of Fe2O3 with g-C3N4 as well as including Fe2O3 with the melamine precursor and calcining, however, these materials did not show interesting Fenton activity or physical properties and are not reported in detail herein.2.4 Catalytic testing
Phenol oxidation was performed at ambient conditions to evaluate the catalytic performance of the FeMx catalysts. During the evaluation process, 20 mg of catalyst was first mixed with 50 mL of aqueous phenol solution (1 g L−1) and 9.97 mL of H2O2 (0.76 M). The mixture was maintained at 35 °C for a certain time and 3 mL of solution was sampled every 15 minutes and centrifuged immediately to separate the catalyst and the reaction solution. The supernatant was used for further liquid chromatography (Agent 1200 series) to analyze the concentration of remaining phenol, therefore, calculating the phenol conversion according to the equation:C0, Ct: the concentration of phenol at 0 and t time; S0, St: the area of phenol in liquid chromatography at 0 and t time.

2.5 Characterization
X-ray diffraction (XRD) patterns were recorded on a Rigaku D/Max 2400 diffractometer using nickel-filtered CuKα radiation. Textural properties of the as-prepared catalysts were measured on a Quantachrome autosorb-iQ2 gas adsorption analyzer at 77 K. The samples were pre-degassed in vacuum at 423 K for 10 h. The Brunauer–Emmett–Teller (BET) method was used to calculate the total surface area (SBET). Ultraviolet-visible diffuse reflectance (UV-Vis) spectra were recorded on a Jasco UV-550 spectrometer with pure BaSO4 used as the reference. X-ray photoelectron spectra (XPS) were acquired on a Thermo VG ESCALAB250 instrument equipped with AlKα radiation. Thermal gravimetric analysis (TGA) under air was performed on a SDT Q600 (TA Instruments, U.S.A.) with a heating rate of 10 °C min from room temperature to 800 °C.3 Results and discussion
3.1 Material synthesis and characterization
XRD and FT-IR spectroscopy were used to characterize the structure of mesoporous g-C3N4. Fig. 1 shows the XRD patterns of mesoporous g-C3N4, with the intensity of the main (002) peak given in Table 1. All six samples showed intense diffraction peaks at 2θ ≈ 27.5°, which is attributed to the inter-layer stacking of the aromatic planes in the graphitic carbon nitride structure with an interlayer distance of 0.324 nm, consistent with the value reported for g-C3N4.26,38 With the increase of the amount of the silica gel, there was no detectable shift of this peak but the intensity of the peak at 27.5° gradually decreased. This decreasing intensity is an indication of the particle diameter decreasing. Fig. 2 shows the FT-IR spectra of the Mx samples and presents typical IR patterns of g-C3N4. The broad absorption bands in the 3000–3500 cm−1 region are attributed to the absorbed O–H and N–H bands,39 and the bands between 1200 cm−1 and 1700 cm−1 are assigned to the typical stretching vibrational modes of heptazine-derived repeat units.38 The band at 812 cm−1 corresponds to the out-of-plane bending vibration characteristic of heptazine rings.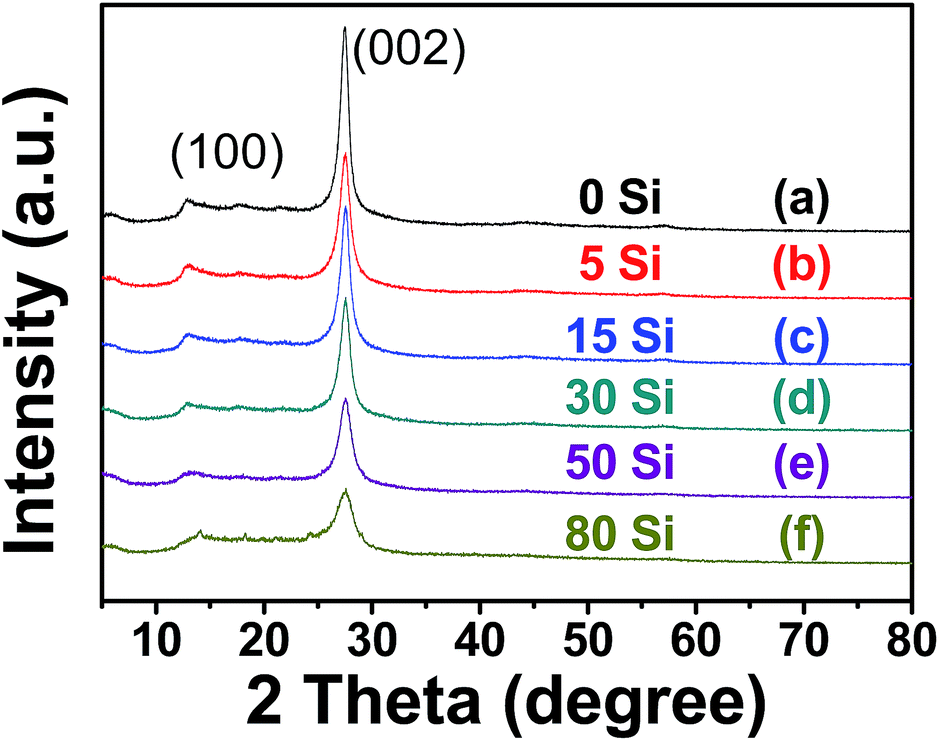 | ||
| Fig. 1 XRD patterns of (a) M0, (b) M5, (c) M15, (d) M30, (e) M50, (f) M80. | ||
| Sample | Intensity of 002 (%) |
|---|---|
| M0 | 100 |
| M5 | 71.8 |
| M15 | 77.8 |
| M30 | 64.9 |
| M50 | 49.3 |
| M80 | 37.7 |
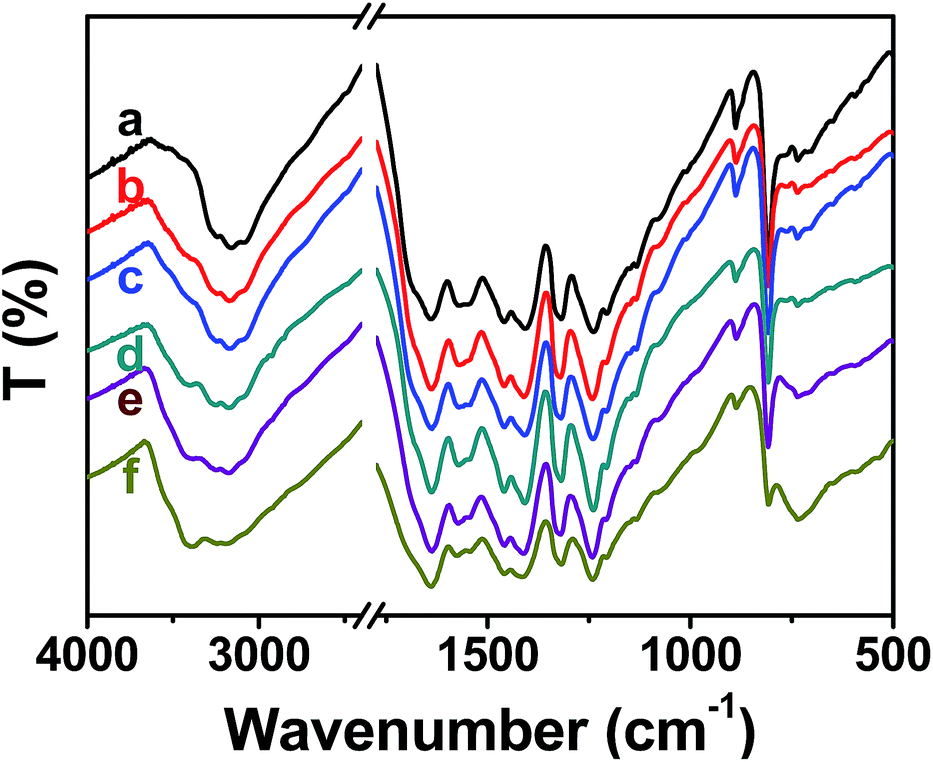 | ||
| Fig. 2 FT-IR spectra of (a) M0, (b) M5, (c) M15, (d) M30, (e) M50, (f) M80. | ||
The textural properties of the supports were characterized by N2 physical adsorption. Fig. 3 and Fig. 4 shows the N2 adsorption–desorption isotherms and pore size distribution of Mx samples, with their textural properties given in Table 2. Except for sample M80, all samples exhibited type IV isotherms indicating the existence of a mesoporous system. As shown in Table 2, the surface areas of Mx maximized at 59.5 m2 g−1 for the 30 wt% SiO2 sacrificial template. The mesopores arise due to the inclusion of the silica nanoparticles during synthesis. Too much silica template, however, leads to framework collapse26 that reduces the surface area.
 | ||
| Fig. 3 N2 adsorption–desorption isotherms of (a) M0, (b) M5, (c) M15, (d) M30, (e) M50, (f) M80. | ||
 | ||
| Fig. 4 Pore size distribution of (a) M0, (b) M5, (c) M15, (d) M30, (e) M50, (f) M80. | ||
| Sample | SBETa (m2 g−1) | Smicrob (m2 g−1) | Smesob (m2 g−1) | Vporec (cm3 g−1) | Average pore widthd (nm) |
|---|---|---|---|---|---|
| a Specific surface area (SBET) was determined by the BET equation.b Determined by t-plot method.c Total pore volume was determined at P/P0 = 0.99.d Average pore width was determined by the BJH method. | |||||
| M0 | 15.7 | 4.9 | 10.9 | 0.08 | 2.2 |
| M5 | 16.9 | 2.8 | 14.1 | 0.09 | 2.2 |
| M15 | 34.0 | 3.4 | 30.6 | 0.13 | 2.5/9.5 |
| M30 | 59.5 | 1.7 | 57.8 | 0.15 | 2.5/9.5 |
| M50 | 59.5 | 1.0 | 58.5 | 0.14 | 2.7/8.8 |
| M80 | 9.1 | 0 | 9.1 | 0.02 | 2.2 |
XRD was used to analyze the crystalline structure of the Fe-based catalysts (Fig. 5). The six FeMx samples retain the characteristic diffraction peak of the g-C3N4 (002) facet at 2θ ≈ 27.5°. For FeM0 (iron on the bulk g-C3N4), diffraction peaks at 2θ ≈ 18.6° and 2θ ≈ 34.1° are observed and can be associated with the iron species.40,41 As a contrast, Fe supported on mesoporous g-C3N4 did not show diffraction peaks associated with iron species due to their high dispersion. As shown in the TEM images in Fig. 6, all six 5 wt% iron samples show noticeable differences. The FeM0 image has easily recognizable iron-species nanoparticles. As more sacrificial template is used, iron species tend to higher dispersion and the Fe-species nanoparticle/g-C3N4 boundary disappeared in FeM30. XRD patterns and the TEM images lead us to conclude that mesoporous g-C3N4 can promote the dispersion of iron species.
 | ||
| Fig. 5 XRD patterns of (a) FeM0, (b) FeM5, (c) FeM15, (d) FeM30, (e) FeM50, (f) FeM80. | ||
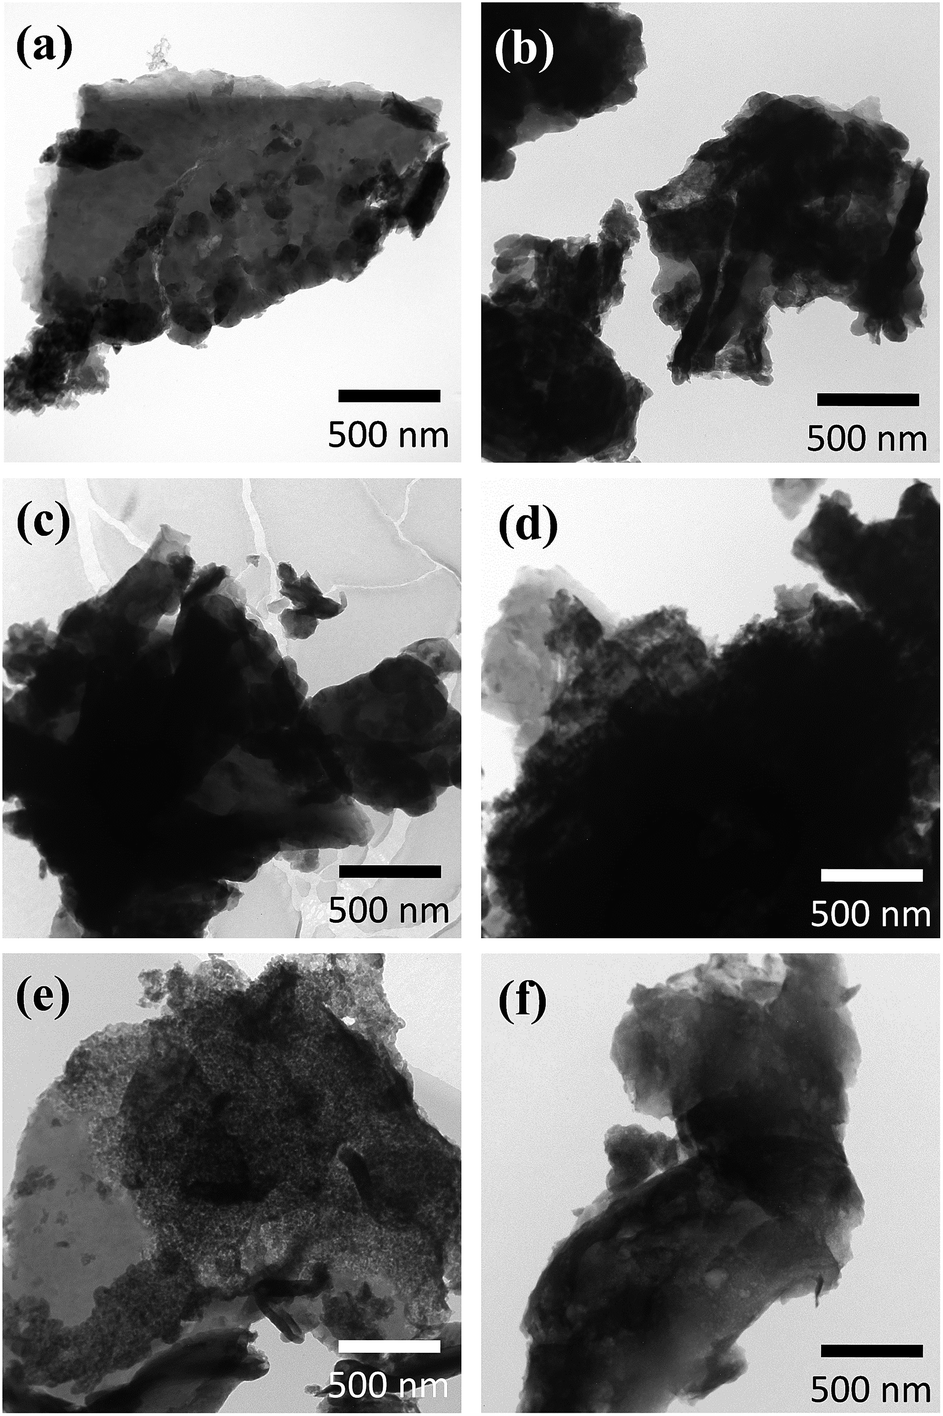 | ||
| Fig. 6 TEM images of (a) FeM0, (b) FeM5, (c) FeM15, (d) FeM30, (e) FeM50, (f) FeM80. | ||
The as-prepared iron-based catalysts were also characterized by N2 physical adsorption to analyze their textural properties. Fig. 7 and Fig. 8 present the N2 adsorption–desorption isotherms of samples FeMx, with their textural properties shown in Table 3. Total specific surface areas follow the same order Mx samples in Table 2. A maximum surface area of 58.6 m2 g−1 for FeM30 is almost unchanged compared with the bare support. Increased SBET after supporting iron, for low SiO2 amount supports, can be attributed to the strong interaction between iron and g-C3N4 which results in the etching of the support. With more than 30 wt% silica gel, the mesoporous system of is on the edge of framework collapse. After supporting iron nitrite and thermal treatment, the same etching effect makes the more fragile support collapse, and consequently decreases the SBET of the FeM (x > 30).
 | ||
| Fig. 7 N2 adsorption–desorption isotherms of (a) FeM0, (b) FeM5, (c) FeM15, (d) FeM30, (e) FeM50, (f) FeM80. | ||
 | ||
| Fig. 8 Pore size distribution of (a) FeM0, (b) FeM5, (c) FeM15, (d) FeM30, (e) FeM50, (f) FeM80. | ||
| Sample | SBETa (m2 g−1) | Smicrob (m2 g−1) | Smesob (m2 g−1) | Vporec (cm3 g−1) | Average pore widthd (nm) |
|---|---|---|---|---|---|
| a Specific surface area (SBET) was determined by the BET equation.b Determined by t-plot method.c Total pore volume was determined at P/P0 = 0.99.d Average pore width was determined by the BJH method. | |||||
| FeM0 | 21.5 | 7.4 | 14.1 | 0.10 | 2.0 |
| FeM5 | 21.4 | 4.3 | 17.1 | 0.10 | 2.2 |
| FeM15 | 27.7 | 5.1 | 22.6 | 0.11 | 17 |
| FeM30 | 58.6 | 8.9 | 49.7 | 0.22 | 12–17 |
| FeM50 | 38.9 | 3.0 | 35.9 | 0.12 | 12 |
| FeM80 | 12.7 | 11.6 | 1.1 | 0.02 | 2.0 |
Fe2p XPS spectra were collected to evaluate the chemical valence state of the catalysts. Fig. 9 shows the XPS spectra of FeMx samples, with their surface composition obtained from XPS analysis shown in Table 4. Two dominant peaks centered at ca. 710.2 eV and ca. 723.3 eV are assigned to Fe 2p3/2 and Fe 2p1/2, respectively.41 From the deconvolution of the XPS spectra of Fe 2p3/2, the peaks centered at 708.9 eV and 710.8 eV are attributed to Fe2+ and Fe3+, respectively.42,43 The surface iron content of the as-prepared catalysts varied from 0.42 wt% to 2.04 wt%, however, we could not accurately quantify the relative composition of Fe3+ to Fe2+ due to the low iron content. The surface iron content first decreases from x = 0 to 30 and then increases up to x = 80. The surface iron content is lower than the ideal iron content (5 wt%), which suggests that the iron species may migrate to the inner mesopores of the composites during the preparation process. This migration is advantageous for dispersion and catalyst performance.
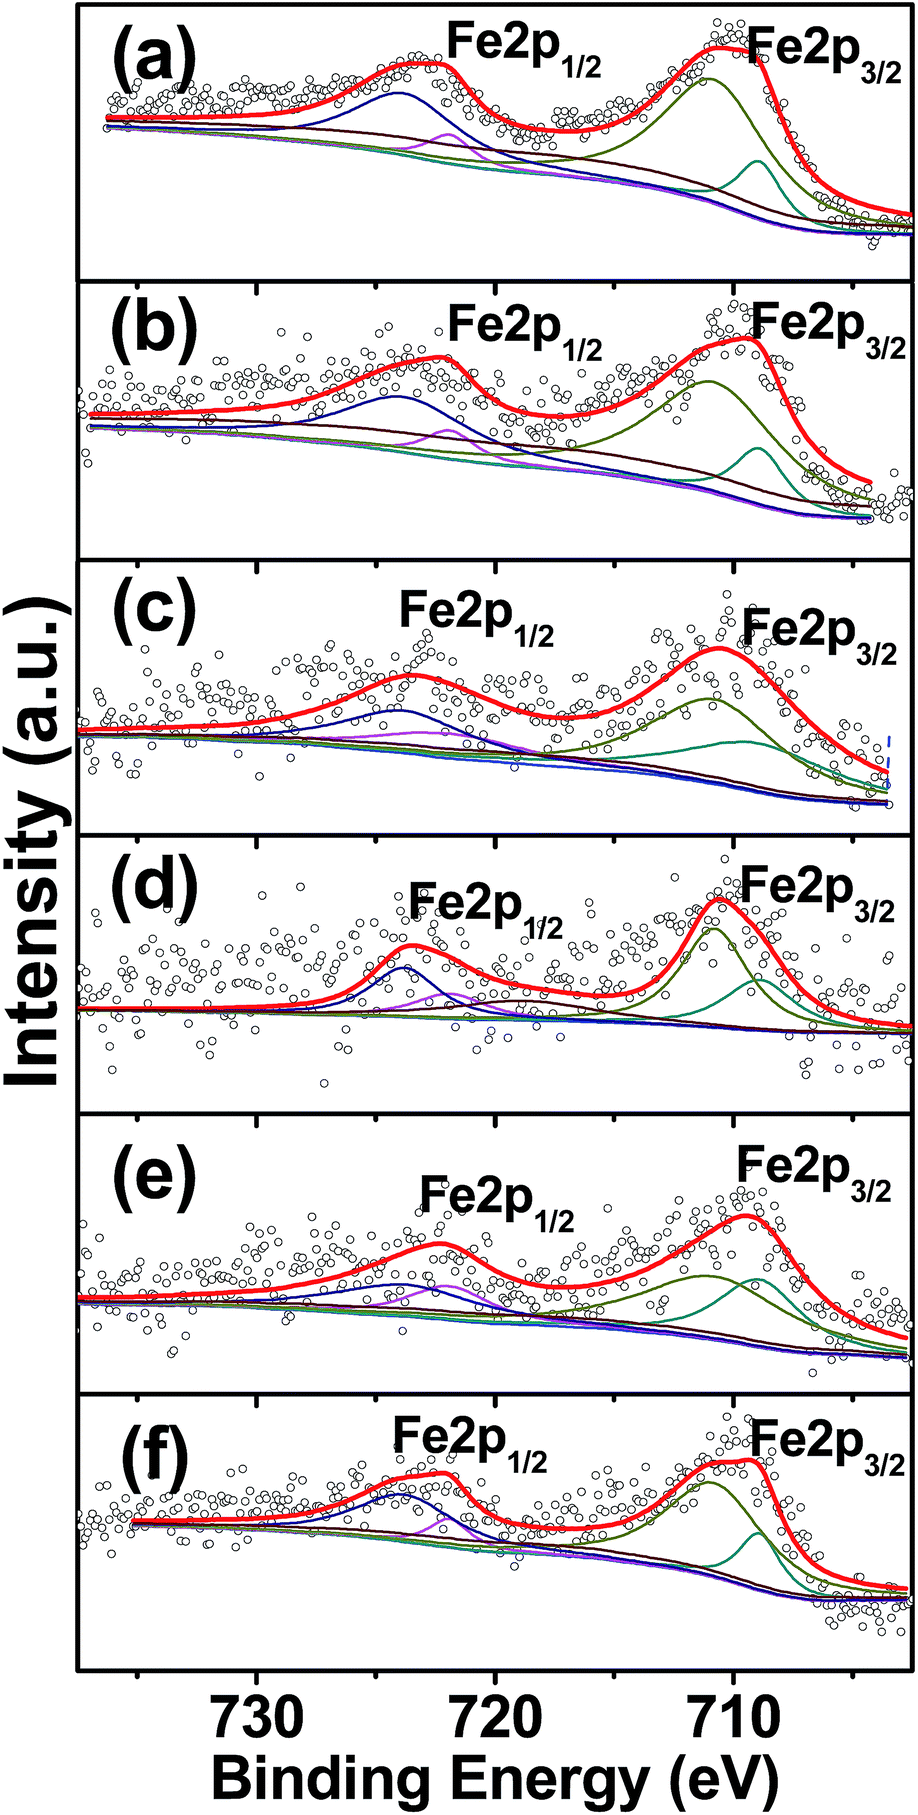 | ||
| Fig. 9 Fe2p XPS spectra of (a) FeM0, (b) FeM5, (c) FeM15, (d) FeM30, (e) FeM50, (f) FeM80. | ||
| Sample | Fe2p (at%) | C1s (at%) | N1s (at%) | O1s (at%) |
|---|---|---|---|---|
| a Surface composition was obtained from XPS analysis. | ||||
| FeM0 | 2.04 | 55.41 | 35.85 | 6.7 |
| FeM5 | 0.98 | 57.08 | 34.84 | 7.09 |
| FeM15 | 0.68 | 58.05 | 35.34 | 5.93 |
| FeM30 | 0.42 | 53.68 | 42.13 | 3.76 |
| FeM50 | 0.45 | 50.34 | 44.55 | 4.66 |
| FeM80 | 0.93 | 55.31 | 37.74 | 6.02 |
3.2 Catalytic performance
Phenol oxidation reaction under ambient condition was conducted to evaluate the catalytic performance of the FeMx samples, as shown in Fig. 10. Phenol conversion using the FeM0 catalyst can only reach 5% in 30 minutes, which indicates a low catalytic activity. Improving the SBET of the catalysts from sample FeM0 to FeM30, the initial phenol conversion gradually increases from 5% to 80% in 30 minutes, showing the highest catalytic activity for FeM30. Though more templates were used for preparation of FeM50 and FeM80, the SBET shows no corresponding increase, explaining the lack of further activity improvement. The SBET has a great influence not only on the dispersion of FeOx but also on the mass diffusion of the reactant during phenol oxidation. Besides impacting the dispersion of FeOx and diffusion of reactant, the increased content of Fe(II) species is another factor that contributes to the improved catalytic activity for sample FeM30. | ||
Fig. 10 Phenol oxidation in the presence of (a) FeM0, (b) FeM5, (c) FeM15, (d) FeM30, (e) FeM50, (f) FeM80. Reaction conditions: molar ratio: 14 H2O2![[thin space (1/6-em)]](https://www.rsc.org/images/entities/char_2009.gif) :1 phenol, 20 mg catalysts: 50 mL phenol (1 g L−1), temperature is 35 °C. :1 phenol, 20 mg catalysts: 50 mL phenol (1 g L−1), temperature is 35 °C. | ||
The impact of calcination temperature on phenol oxidation conversion is shown in Fig. S5,† indicating 450 °C as an optimal calcination temperature. As shown in Fig. S1,† unsupported Fe2O3, Fe3O4, 5%Fe/SBA-15, and 5%Fe/ZSM-5 all showed no or little (3%) conversion under equivalent reaction conditions to the g-C3N4 supported catalysts.
The stability of the as-prepared sample FeM30 was evaluated through three consecutive operations of phenol oxidation. As shown in Fig. S2,† with the reaction time prolonged, phenol still rapidly degraded in the presence of FeM30 within 60 minutes, and showed no obvious deactivation. This demonstrates the re-usability of FeOx/g-C3N4. The iron leaching content is 0.97 mg L−1 by liquid ICP analysis.
3.3 Discussion
The conversion from iron nitrite to active iron species is the key step for controlling the dispersion of the iron-based catalysts. De Jong and co-workers44–47 found that inert gas flow is beneficial for better metal oxide dispersion because of the timely removal byproducts. Li et al.48 found that simply pre-drying before calcination can prevent nanoparticle aggregation. The byproducts produced from the decomposition of nitrite precursor are NO2 and O2. When there are no alkali species to consume those NO2, those byproducts will react with water, and nitric acid is produced.49 This nitric acid converts the Fe2O3 to iron nitrite again, causing the eventual generation of Fe2O3 to occur at a higher temperature. At this higher temperature, the nitrite-to-oxide conversion turns to a liquid–solid process which involving continuous dissolution and regeneration of Fe2O3 and leads to larger nanoparticles compared with a solid–solid process in the absence of as-produced nitric acid.48 Therefore, the dispersion of iron oxide will be improved when introducing an alkali substance to consume NO2 byproducts.Based on our results, we provide a mechanism for controlling the dispersion of active iron species by supporting on mesoporous g-C3N4 rich with –NH2, as shown in Fig. 11. The precursor is first impregnated on the mesoporous surface of g-C3N4. During the calcination step, complicated changes occur for the iron nitrate precursor. When the temperature reaches 145–150 °C, iron nitrate first decomposes and crystalline α-Fe2O3 is formed. The byproducts, including NO2 and O2, may react with H2O and form nitrate acid. Generally, the produced nitrate acid will etch the as-formed crystalline α-Fe2O3, and delay the formation time, leading to the increased temperature at which the eventual particles are formed. As a consequence, turns the nitrite-to-oxide conversion into a liquid–solid process.
 | ||
| Fig. 11 Mechanism of the crystal formation and growth behavior of sample FeM30. | ||
If a material rich with basic groups is used as the support, the byproducts, especially nitrate acid, would be consumed before iron oxide is etched. As confirmed by others,19,20,50,51 the termination of g-C3N4 is rich with nitrogen atoms or amino groups that can serve as base sites to catalyze the Friedel–Crafts reaction.36,52 Therefore, the amino group on the mesoporous surface of the support could directly consume the acid byproducts. Larger mesoporous surface areas presents higher amino group content, and making the support more effective for minimizing the nanoparticle size.
Besides impacting the nanoparticle size, the support can affect the oxidation state of the active iron species. During thermal treatment in inert atmosphere, g-C3N4 will partially decompose to form –C3N4 or –C6N7, and these small molecules will reduce iron species to a lower valence state.
In summary, mesoporous g-C3N4 as a support can promote the Fenton activity due to the amino group's effect on adjusting the hydrolysis and crystallization process of Fe(III) to get superior physical dispersion and optimizing the valence state.
4 Conclusions
Mesoporous g-C3N4 was used as an iron support to fabricate highly dispersed iron-based catalysts. With 30 wt% silica gel serving as the sacrificial template, g-C3N4 exhibits the largest specific surface area and acts as the best iron support for promoting phenol oxidation. The mechanism of the FeOx formation and growth behavior is discussed. Importantly, FeOx are highly dispersed which is attributed not only to the large SBET but also to the amino group's effect on adjusting the crystallization process of FeOx. At the same time, during the thermal preparation, partial pyrolysis of g-C3N4 leads to the release of carbon and nitride fragment resulting in the redox effect on FeOx, therefore, producing more Fe(II) species, which largely contributes to the enhanced activity. Our work may provide a facile approach to prepare highly dispersed transition metal oxides with adjustable physicochemical state.Acknowledgements
This work was supported by the State Key Program of National Natural Science Foundation of China (grant no. 21236008, 21306018).Notes and references
- M. Hartmann, S. Kullmann and H. Keller, J. Mater. Chem., 2010, 20, 9002 RSC.
- F. C. Moreira, S. Garcia-Segura, R. A. R. Boaventura, E. Brillas and V. J. P. Vilar, Appl. Catal., B, 2014, 160–161, 492–505 CAS.
- A. D. Bokare and W. Choi, J. Hazard. Mater., 2014, 275, 121–135 CAS.
- P. V. Nidheesh, RSC Adv., 2015, 5, 40552–40577 CAS.
- W. R. P. Barros, J. R. Steter, M. R. V. Lanza and A. C. Tavares, Appl. Catal., B, 2016, 180, 434–441 CAS.
- M. B. Kasiri, H. Aleboyeh and A. Aleboyeh, Appl. Catal., B, 2008, 84, 9–15 CAS.
- Y. Lei, C. S. Chen, Y. J. Tu, Y. H. Huang and H. Zhang, Environ. Sci. Technol., 2015, 49, 6838–6845 CAS.
- X. Hu, B. Liu, Y. Deng, H. Chen, S. Luo, C. Sun, P. Yang and S. Yang, Appl. Catal., B, 2011, 107, 274–283 CAS.
- L. Xu and J. Wang, Appl. Catal., B, 2012, 123–124, 117–126 CrossRef CAS.
- Y. Wang, H. Zhao, M. Li, J. Fan and G. Zhao, Appl. Catal., B, 2014, 147, 534–545 CAS.
- Y. Wang, H. Zhao and G. Zhao, Appl. Catal., B, 2015, 164, 396–406 CrossRef CAS.
- X. Li, X. Liu, L. Xu, Y. Wen, J. Ma and Z. Wu, Appl. Catal., B, 2015, 165, 79–86 CrossRef CAS.
- L. Luo, C. Dai, A. Zhang, J. Wang, M. Liu, C. Song and X. Guo, Catal. Sci. Technol., 2015, 5, 3159 CAS.
- C. H. Christensen, I. Schmidt, A. Carlsson, K. Johannsen and K. herbst, J. Am. Chem. Soc., 2005, 127, 8098–8102 CAS.
- L. Li, J. Yan, T. Wang, Z. J. Zhao, J. Zhang, J. Gong and N. Guan, Nat. Commun., 2015, 6, 5881 Search PubMed.
- M. Xia, M. Long, Y. Yang, C. Chen, W. Cai and B. Zhou, Appl. Catal., B, 2011, 110, 118–125 CrossRef CAS.
- Y. Zhang, X. Dou, J. Liu, M. Yang, L. Zhang and Y. Kamagata, Catal. Today, 2007, 126, 387–393 CAS.
- L. Luo, C. Dai, A. Zhang, J. Wang, M. Liu, C. Song and X. Guo, RSC Adv., 2015, 5, 29509–29512 RSC.
- Y. Wang, X. Wang and M. Antonietti, Angew. Chem., Int. Ed., 2012, 51, 68–89 CAS.
- X. Wang, K. Maeda, A. Thomas, K. Takanabe, G. Xin, J. M. Carlsson, K. Domen and M. Antonietti, Nat. Mater., 2009, 8, 76–80 CrossRef CAS PubMed.
- D. J. Martin, P. J. Reardon, S. J. Moniz and J. Tang, J. Am. Chem. Soc., 2014, 136, 12568–12571 CrossRef CAS PubMed.
- Q. Li, J. Yang, D. Feng, Z. Wu, Q. Wu, S. S. Park, C.-S. Ha and D. Zhao, Nano Res., 2010, 3, 632–642 CrossRef CAS.
- F. Goettmann, A. Thomas and M. Antonietti, Angew. Chem., Int. Ed., 2007, 46, 2717–2720 CAS.
- S. Zhang, J. Li, M. Zeng, J. Xu, X. Wang and W. Hu, Nanoscale, 2014, 6, 4157–4162 RSC.
- X. Wang, X. Chen, A. Thomas, X. Fu and M. Antonietti, Adv. Mater., 2009, 21, 1609–1612 CrossRef CAS.
- S. C. Lee, H. O. Lintang and L. Yuliati, Chem.–Asian J., 2012, 7, 2139–2144 CrossRef CAS PubMed.
- K. Maeda, X. Wang, Y. Nishihara, D. Lu, M. Antonietti and K. Domen, J. Phys. Chem. C, 2009, 113, 4940–4947 CAS.
- X. Chen, Y.-S. Jun, K. Takanabe, K. Maeda, K. Domen, X. Fu, M. Antonietti and X. Wang, Chem. Mater., 2009, 21, 4093–4095 CrossRef CAS.
- F. Goettmann, A. Fischer, M. Antonietti and A. Thomas, Angew. Chem., Int. Ed., 2006, 45, 4467–4471 CrossRef CAS PubMed.
- G. Zhang, J. Zhang, M. Zhang and X. Wang, J. Mater. Chem., 2012, 22, 8083 RSC.
- J. Xu, T. Chen, Q. Jiang and Y. X. Li, Chem.–Asian J., 2014, 9, 3269–3277 CAS.
- S. C. Yan, Z. S. Li and Z. G. Zou, Langmuir, 2009, 25, 10397–10401 CrossRef CAS PubMed.
- A. Vinu, Adv. Funct. Mater., 2008, 18, 816–827 CrossRef CAS.
- A. Vinu, P. Srinivasu, D. P. Sawant, T. Mori, K. Rriga, J.-S. Chang, S.-H. Jhung, V. V. Balasubramanian and Y. K. Hwang, Chem. Mater., 2007, 19, 4367–4372 CrossRef CAS.
- S. N. Talapaneni, S. Anandan, G. P. Mane, C. Anand, D. S. Dhawale, S. Varghese, A. Mano, T. Mori and A. Vinu, J. Mater. Chem., 2012, 22, 9831 CAS.
- J. Xu, H. T. Wu, X. Wang, B. Xue, Y. X. Li and Y. Cao, Phys. Chem. Chem. Phys., 2013, 15, 4510–4517 CAS.
- Y. Cui, J. Huang, X. Fu and X. Wang, Catal. Sci. Technol., 2012, 2, 1396 CAS.
- J. Liu, T. Zhang, Z. Wang, G. Dawson and W. Chen, J. Mater. Chem., 2011, 21, 14398 RSC.
- L. Shi, L. Liang, F. Wang, M. Liu, T. Liang, K. Chen and J. Sun, RSC Adv., 2015, 5, 63264–63270 RSC.
- S. Bao, W. Qin, Q. Wu, G. Liang, F. Zhu and Q. Wu, Dalton trans., 2013, 42, 5242–5246 CAS.
- H. Park, D. H. Youn, J. Y. Kim, W. Y. Kim, Y. H. Choi, Y. H. Lee, S. H. Choi and J. S. Lee, ChemCatChem, 2015, 7, 3488–3494 CrossRef CAS.
- T. Yamashita and P. Hayes, Appl. Surf. Sci., 2008, 254, 2441–2449 CrossRef CAS.
- J. Gao, X. Ran, C. Shi, H. Cheng, T. Cheng and Y. Su, Nanoscale, 2013, 5, 7026–7033 CAS.
- G. Prieto, J. Zecevic, H. Friedrich, K. P. de Jong and P. E. de Jongh, Nat. Mater., 2013, 12, 34–39 CAS.
- P. Munnik, P. E. de Jongh and K. P. de Jong, J. Am. Chem. Soc., 2014, 136, 7333–7340 CrossRef CAS PubMed.
- Y. S. Au, M. K. Obbink, S. Srinivasan, P. C. M. M. Magusin, K. P. de Jong and P. E. de Jongh, Adv. Funct. Mater., 2014, 24, 3604–3611 CAS.
- G. Prieto, S. Beijer, M. L. Smith, M. He, Y. Au, Z. Wang, D. A. Bruce, K. P. de Jong, J. J. Spivey and P. E. de Jongh, Angew. Chem., Int. Ed., 2014, 53, 6397–6401 CrossRef CAS PubMed.
- B. Li, M. Li, C. Yao, Y. Shi, D. Ye, J. Wu and D. Zhao, J. Mater. Chem. A, 2013, 1, 6742 CAS.
- X. Sun, Y. Shi, P. Zhang, C. Zheng, X. Zheng, F. Zhang, Y. Zhang, N. Guan, D. Zhao and G. D. Stucky, J. Am. Chem. Soc., 2011, 133, 14542–14545 CAS.
- Y. Gong, M. Li, H. Li and Y. Wang, Green Chem., 2015, 17, 715–736 CAS.
- Y. Cui, Z. Ding, P. Liu, M. Antonietti, X. Fu and X. Wang, Phys. Chem. Chem. Phys., 2012, 14, 1455–1462 CAS.
- F. Goettmann, A. Fischer, M. Antonietti and A. Thomas, Chem. Commun., 2006, 4530 CAS.
Footnote |
| † Electronic supplementary information (ESI) available. See DOI: 10.1039/c6ra19455a |
| This journal is © The Royal Society of Chemistry 2016 |