Effect of incorporation of boron nitride nanoparticles on the oxygen barrier and thermal properties of poly(3-hydroxybutyrate-co-hydroxyvalerate)

M. Öner*a, A. A. Çöla, C. Pochat-Bohatierb and M. Bechelany*b
aYildiz Technical University Chemical-Metallurgical Faculty, Chemical Engineering Department, Istanbul, Turkey. E-mail: oner@yildiz.edu.tr; muallaoner@gmail.com
bInstitut Européen des Membranes, UMR 5635, Université de Montpellier, ENSCM, CNRS, Place Eugène Bataillon, F-34095 Montpellier Cedex 5, France. E-mail: mikhael.bechelany@univ-montp2.fr

Received 28th July 2016 , Accepted 8th September 2016

First published on 16th September 2016


Abstract

In this study poly(3-hydroxybutyrate-co-3-hydroxyvalerate) and boron nitride (PHBV/BN) nanobiocomposites were prepared by incorporating various percentages of boron nitride using extrusion processing. The oxygen permeation properties of the PHBV nanocomposites were examined to compare their oxygen-barrier performance as affected by temperature and nanoparticle content. The resulting PHBV nanocomposites showed an increase in oxygen permeability as temperature increased, with an Arrhenius behavior, and an activation energy of 54.1 kJ mol−1 and 57.5 kJ mol−1 for neat PHBV and PHBV3BN composites, respectively. The barrier properties of the composites decreased with BN addition and reached 1.22 ± 0.06 (cm3 mm m−2 per day per atm) at 3 wt%. Thermal stabilities of the prepared nanobiocomposites were measured by thermogravimetric analysis (TGA) and it was found that the thermal stability of the composites was higher than that of neat PHBV. The differential scanning calorimetry results indicated that the addition of BN nanoparticles to the composites increased their crystallinity.

1. Introduction

Currently, the plastics used in many industries are dominated by petroleum based plastic materials produced from fossil fuels since they are mass-produced, relatively cheap and convenient to use with excellent processability and durability. However, these petroleum-based materials are not environmentally friendly due to their very low degradation rates under typical disposal conditions and their solid waste problems.1,2 Therefore, recent research has been focused on the development of biodegradable materials using biopolymers to substitute petroleum based plastic materials because of the non-biodegradable nature of petroleum based plastic materials, the increasing price of oil, uncertainties associated with a reliable supply of crude oil and the concerns on the exhaust of natural resources.3,4

Polyhydroxyalkanoates (PHAs) are biodegradable and biosourced thermoplastic polyesters produced by a wide variety of bacteria from renewable resources like corn sugar and oil to store energy in conditions of physiological stress.5,6 PHAs has potential applications in biomedical, agricultural, and packaging products to replace conventional plastics because they need less energy for production, can reduce the greenhouse gas (GHG) emissions and can generate less landfill wastes.7,8 The homopolymer poly(3-hydroxybutyrate) (PHB), and the copolymer poly(3-hydroxybutyrate-co-3-hydroxyvalerate) (PHBV), are the most well-known types of PHAs. However, their brittle behaviour caused by high crystallinity, poor thermal stability and narrow processing windows limits their application.9–12

Recently, there is growing interest in developing of bionanohybrid materials or bionanocomposites, in order to replace conventional nonbiodegradable petroleum-based plastic materials due to their enhanced physical, thermal, mechanical and processing characteristics.13–16 These materials are of great interest due to their versatile applications in important areas with improved functional and structural properties. It is well known that the addition of small amounts of nanofillers (<5 wt%) can greatly enhance most properties of polymers.17–24 If the properties of the PHBV can be further improved by incorporation of functional additives into the polymer to form composites, this polymer will find applications in more special or severe circumstances.

Organically modified montmorillonite (OMMT) was introduced into PHBV through polymer intercalation from solution.25 With the incorporation of 3 wt% OMMT, the tensile strength of the hybrid was about 32% higher than that of the original PHBV and the tensile modulus was also increased. Sanchez-Garcia reported that PHBV/mica (5% wt) nanocomposites reduce the oxygen and water vapour permeability with 32% and 75%, respectively. For PHBV/mica (10%) the oxygen permeability increased and the water vapour permeability decreased with 47%.26 Nanocomposites of PHBV and multi-walled carbon nanotubes (MWNTs) were prepared using the polymer intercalation from solution.27 It was found that MWNTs made the composites more thermally stable than pure PHBV in nitrogen. Corrêa reported a 12% reduction in oxygen permeability for PHBV/Cloisite 30B nanocomposites.28 Zinc oxide (ZnO)/PHBV composite nanofibers were fabricated by an electrospinning method. It was found that ZnO was not nucleating or modifying agents but retarding agents for crystallization in the polymer matrix.29 PHBV/ZnO nanocomposites were prepared via simple solution casting method.30 A gradual rise in thermal stability was found with increasing ZnO loading. The improved barrier properties were also observed against water and water vapour for the nanocomposites in comparison to the neat biopolymer. Puente et al. was investigated the effect of boron nitride (BN) as a nucleating agent on the crystallization of commercial grade poly(3-hydroxybutyrate, PHB) and poly(3-hydroxybutyrate-co-3-hydroxyvalerate, PHBV).31,32 The composite samples were processed by twin-screw micro-compounder. It was found that the addition of BN to PHB and PHBV modifies the mechanisms of crystallization by starting it at lower supercooling degrees. It was reported that the coupling between the amorphous and the crystalline phase was modified in the presence of the BN particles. The permeation to water and gas molecules of films prepared from industrially available poly(3-hydroxybutyrate) (PHB) and poly(3-hydroxybutyrate-co-3-hydroxyvalerate) were analyzed by Follain et al.33 Water diffusivity was found to be dependent on water concentration as a result of the plasticization effect induced by water molecules. In terms of gas barrier properties, the results showed that the permeation parameter ranking was governed by the nature and size of the diffusing probes.

Composites made from biopolymers and ceramic-based inorganic nanoparticles have significant potential in many areas due to their enhanced properties and processing characteristics. In that respect hexagonal boron nitride (h-BN) is an analog of graphite, has many specific novel properties, such as high specific surface area, high melting and decomposition temperature, low density, chemically inertness, high thermal stability, conductivity, mechanical strength and oxidation resistance.34,35 The composite materials made of boron nitride have a lot of applications, such as raw material for super abrasives, cosmetic applications, in thermal management, functional coating in the automotive industry and releasing agent in glass industry.36,37

In this study, our main research has focused on the fabrication of PHBV/BN nanocomposite to understand the effect of different BN reinforcements on the oxygen barrier and thermal properties of PHBV composites. It is well known that incorporation of coupling agents such as silanes onto the filler surface is an efficient way of modifying the polymer matrix-filler interface.38 Silanization can greatly reduce the surface energy of nano particles and thus improve its dispersion in matrix material. On the other hand it is good to know how particles behave in the polymer matrix without using coupling agents. In this work our purpose is to investigate how properties of the PHBV are improved by using BN without surface modification. For this purpose, boron nitride (BN) has been dispersed into renewable biobased poly(3-hydroxybutyrate-co-3-hydroxyvalerate) (PHBV), by melt-extrusion using twin screw extruders and the resulting dried pellets were shaped into thin sheets. BN has been shown to contribute to an enhancement of nanocomposites properties. The present work is, to the best of our knowledge, the first study showing the barrier properties of PHBV nanocomposites by using BN without surface modification.

2. Experimental

2.1 Materials

PHBV was kindly supplied by ADmajoris Company, France under the trade name MAJ'ECO FN000HA in a pelletized form suitable for melt extrusion. The valerate content of the PHBV reported by the company is 8% by weight. BN was purchased from Bortek, Turkey.

2.2 Ultrasonic treatment of BN particles

BN nanoparticles were dispersed in ethanol/water solution by sonication in a cup-horn sonicator to reduce the size of nanoparticle aggregates. BN 1.5% (w/v) particles were added to the 90[thin space (1/6-em)]:[thin space (1/6-em)]10 (v/v) ethanol–water mixture and treated with an ultrasonic probe system (SONICS Vibra Cell) for 6 min with an amplitude of 40% in order to obtain a stable dispersion. The mixture was then centrifuged at 4000 for 15 min to isolate the stable BN dispersion. The resulting powder was dried in a vacuum drier at 50 °C for 24 h to evaporate excess water.

2.3 Preparation of nanocomposites

PHBV/BN nanobiocomposites were prepared by the melt mixing method. The greatest interest has involved melt processing because of its speed, simplicity and compatibility with current industrial practices. This method is also useful because it is free of solvents and contaminant. A twin-screw extruder (Rondol Microlab, England) with L/D ratio 20 was used for preparing nanocomposites. BN percentages in PHBV/BN nanocomposites were 0.5 wt%, 1 wt%, and 3 wt%. The screw speed was 80 rpm and the operating temperatures of the five extruder zones (from feed to die) were set to 90–135–160–160–150 °C. The extrudate was cooled in a water bath at about 25 °C, air dried, and pelletized for further use. Sheet samples were prepared using a hot-cold press machine (Gülnar Makine, Turkey). The sheet thickness of the prepared samples was around 0.75 mm. The samples have been drawing considerable industrial interest as candidates for biodegradable and/or biocompatible plastics for a wide range of applications such as various containers, disposable materials, and trays for holding food. It can be also used in biomedical area such as wound dressing, surgical pin.

2.4 Characteristic of BN nanoparticles and composites

For X-ray diffraction (XRD) pattern of the films, the square piece of film (2–2.5 cm) was placed on a glass slide and analyzed by X-ray diffractometer (PHILIPS diffractometer X'pert Pro (Pan Analytical)). The spectra were recorded using Cu Kα radiation (wavelength of 1.54 Å) and a nickel monochromator filtering wave at 40 kV and 20 mA. The diffraction pattern was obtained at diffraction angles between 2θ = 2–80° at room temperature. The samples were also tested by FTIR spectral analysis using a Thermo Electron Corporation Nicolet Nexus FTIR in the 4000–650 cm−1 region at a resolution of 4 cm−1. PHBV/BN nanocomposite sheet samples were analyzed by scanning electron microscopy (SEM, Hitachi S-4800) to evaluate the dispersion of the nanoparticles inside the PHBV matrix. EDX measurement was performed using a Zeiss EVO ED15 microscope coupled with an Oxford X-MaxN EDX detector.

2.5 Thermal properties of PHBV nanocomposites

Thermal transitions for neat PHBV and composites were measured by differential scanning calorimetry (DSC). TA Instruments differential scanning calorimeter (DSC 2920) was used to determine the thermal properties of the polymer composites. Polymer and composite samples were analyzed from 0 °C to 200 °C at a heating and cooling rate of 10 °C min−1 under 50 mL min−1 nitrogen. The samples were first heated from 0 °C to 200 °C at a rate of 10 °C min−1 (first heating scan). The samples were kept at 200 °C for 2 minutes to erase the thermal history and subsequently cooled to 0 °C at 10 °C min−1, equilibrated at 0 °C for 2 min. Then, the samples were re-heated to 200 °C at a rate of 10 °C min−1. The thermal parameters were obtained from the second heating scan.

Thermal stability of the films was determined using a thermogravimetric analyzer (TGA; TA Instrument, TGA Q500 V 20.13 Build 39). About 10 mg of each film sample was taken in a standard aluminum cup and heated in the temperature ranged from 20 to 800 °C with heating rate of 10 °C min under a nitrogen flow of 40 mL min−1.

2.6 Barrier properties of PHBV nanocomposites

Oxygen transmission rates (OTR) of neat PHBV and PHBV/BN composites films were measured using a Systech Illinois instruments Model 8001 oxygen permeation analyser, which employs the continuous-flow cell method approved by ASTM D3985-05. The tests were conducted at 23 °C, 0% relative humidity and 1 atm pressure with highly purified oxygen (99.99%) and nitrogen (99.99%) gases. We also performed tests at 30 °C, 40 °C, and 50 °C temperatures for neat PHBV and PHBV/3BN to see the effect of temperature on barrier properties. Tests were stopped when OTR graphics showed the steady condition. The permeability (OP) was calculated by multiplying the measured steady state transmission rate by the average sample thickness. At least two separate films were measured for each sample.

3. Results and discussion

3.1 Morphology of BN nanoparticles

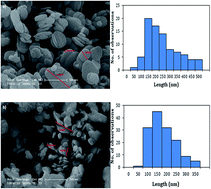
The SEM images (Fig. 1a and b) give the morphologies of the boron nitride nanoparticles before and after sonication. As observed from SEM, the shape of the BN nanoparticles was nearly hexagonal platelets. The size of the platelets was also measured from SEM images. The mean length of the longer side (L) was 225.01 ± 108.94 nm calculated from approximately 100 nanoparticles. The mean dimension of the other side (width, W) was 177.22 ± 83.95 nm.
image file: c6ra19198c-f1.tif
Fig. 1 SEM micrograph of BN before (a) and after 6 min ultrasonication (b).

The mean thickness of particles (T) was approximately 61.61 ± 25.70 nm. After sonication, the mean length (L), width (W) and thickness (T) of the particles were reduced to 152.99 ± 66.53 nm, 113 ± 60.83 nm and 37.86 ± 11.87 nm respectively. The standard deviation (σ) from the mean was calculated from size measurements of 100 particles. The large deviations from the mean size indicated the polydispersity in size distribution of nanoparticles. The aspect ratio (L/T) was calculated from the particle size measurement done on the SEM images. The mean aspect ratio before ultrasonication approximately 2.9 was increased to 4.0 after ultrasonic treatment.

3.2 XRD and FTIR results

In order to observe any changes to the crystalline structure of PHBV in the presence of BN nanoparticles, X-ray diffraction (XRD) was performed on neat PHBV and nanocomposites. Fig. 2 shows room-temperature XRD patterns of PHBV and PHBV/BN nanocomposites along with the diffraction patterns of boron nitride (BN) nanoparticles. The PHBV polymer exhibited prominent peaks at 2θ = 13.4°, 16.9°, 21.3° and 22.4° corresponding to (020), (110), (101) and (111), reflections.39 The peak at 2θ = 26.32°, 2θ = 41.691°, 2θ = 43.911°, 2θ = 50° and 2θ = 55° corresponding to the (002), (100), (101), (102) and (004) planes of the h-BN, respectively.40,41 Both PHBV and PHBV/BN shows reflections at the same values as for the neat biopolymer, indicating that the addition of BN nanoparticles does not change the unit cell of the PHBV polymer and it crystallized in its typical crystalline form. However, some variations in the intensity with nanoparticle concentration were also seen for the (020) reflection. It can be seen from Fig. 3 that peak at 13.4° become sharper and more intense with BN suggesting that nanoparticles induced ordering of PHBV molecular chains. The crystallite size L [nm] calculated for the (020) reflection peak using Scherrer's equation is 30.52 and 32.63 nm in neat PHBV and PHBV/3BN nanocomposite respectively. This increase in the crystallite size of (020) crystal plane with BN shows that nanoparticles provoke the increase in the degree of crystallinity. The peak at 26° corresponds to the (002) diffraction peak of h-BN and it is well defined in the composite samples.
image file: c6ra19198c-f2.tif
Fig. 2 The X-ray diffraction pattern of BN, neat PHBV and PHBV/BN nanocomposites.

image file: c6ra19198c-f3.tif
Fig. 3 The X-ray diffraction patterns of intensity versus 2-theta for PHBV and PHBV/3BN.

It is noticed that the intensity of h-BN peak increases with increase of h-BN content in the samples (Fig. 3).

The FTIR spectra of BN, PHBV and the nanocomposites are shown in Fig. 4. The FTIR spectra of the PHBV display the bands responsible for C[double bond, length as m-dash]O stretching at 1720 cm−1, various aliphatic C–H vibrational bands in the regions 1227–1478 cm−1 and 826–979 cm−1; –C–O–C stretching vibration at 800–900 cm−1 and C–O vibrational modes at 1183, 1133 and 1057 cm−1.42 BN exhibits characteristic absorption bands at B–N (1263 cm−1) and B–N–B (795 cm−1), which indicated the in-plane and transverse vibrations, respectively.43 The spectra for PHBV/BN composites show typical bands of PHBV. Boron nitride has a strong absorption band at 795 cm−1 due to bending vibration of B–N–B bond, which is also present around the same position in the spectra of PHBV/BN nanocomposites and intensity of the peak increases with BN content of the composites (Fig. 4b). These results confirmed the incorporation of the BN nanoparticles in PHBV.


image file: c6ra19198c-f4.tif
Fig. 4 The FTIR spectrum of (a) BN, neat PHBV and PHBV/BN nanocomposites (b) characteristic peak of BN.

3.3 SEM of nanocomposites

SEM (Fig. 5a) was employed to evaluate the morphological characteristics of PHBV/BN film nanocomposites. As can be seen from Fig. 5a, the BN were randomly dispersed in the matrix, showing typical characteristics of good compatibility between the BN and the PHBV matrix. In addition, the SEM EDX cross section mapping of the PHBV/BN nanocomposites (Fig. 5b) demonstrated that the graphene-like BN was homogeneously distributed on the PHBV matrix.
image file: c6ra19198c-f5.tif
Fig. 5 (a) SEM cross section images of PHBV/BN nanocomposites (b) EDX Boron element mapping.

3.4 TGA results

PHBV can be processed by conventional techniques such as extrusion, injection or compression molding. However, one of the major shortcomings of PHBV is its low thermal stability, since thermal degradation can take place during the polymer melt processing, which need to be overcome before converting it into useful products.44 Consequently, it is important to investigate the effect of BN nanoparticles on the thermal decomposition of PHBV. The thermal stability of the PHBV and PHBV/BN nanocomposite was measured using thermogravimetric analysis, and the resulting TGA are shown in Fig. 6. Thermogravimetric analysis was carried out under a nitrogen atmosphere in the temperature range 20–800 °C and the temperature corresponding to initial mass loss (Ti), the temperature of 10% weight loss (T10), the temperature of 50% weight loss (T50) and the temperature of maximum rate of mass loss (Tmax), are summarized in Table 1.
image file: c6ra19198c-f6.tif
Fig. 6 The TGA curves of BN, neat PHBV and PHBV/BN nanocomposites.
Table 1 TGA values of the samples
Sample Ti (°C) T10 (°C) T50 (°C) Tmax (°C)
PHBV 234.45 243.50 256.04 275.08
PHBV/0.5BN 248.30 259.75 272.52 283.72
PHBV/1BN 250.50 262.10 274.04 283.85


As shown in Fig. 6, a single-step degradation was observed in all samples and it shifted to the right with the addition of BN. This result showed that increasing filler loading leads to increased thermal behaviour of the composites due to the higher thermal stability of fillers compared with the matrix. The initial temperature of thermal decomposition is a very important parameter since it determines the maximum processing temperature which can be applied without thermally damage the material. Ti progressively rises upon increasing BN content, by up to 17 °C for the nanocomposite with 3.0 wt% loading.

3.5 DSC results

The thermal properties of nanocomposites were studied with DSC through nonisothermal experiments.

The thermograms are given in Fig. 7 and 8 and the derived data are summarized in Table 2. Neat PHBV and composites show double melting peaks in the first heating cycle. The melting temperature of the composites depended on various factors like morphology, crystallization and composite composition.45 The multiple melting peaks observed in semicrystalline polymers have been usually interpreted in terms of the melting, recrystallization, and remelting model during heating. Possibilities of double melting behaviour include: (a) reorganization during heating; (b) presence of more than one crystal modification; (c) different morphology; and (d) relaxation of the rigid amorphous fraction.46


image file: c6ra19198c-f7.tif
Fig. 7 DSC thermograms of neat PHBV and PHBV/BN nanocomposites from the first heating scan.

image file: c6ra19198c-f8.tif
Fig. 8 DSC thermograms of neat PHBV and PHBV/BN nanocomposites from the second heating scan.
Table 2 Thermal properties obtained from DSC heating curves for the first heating, first cooling and second heating scan for the neat PHBV and its nanocomposites
Sample code First heating scan First cooling scan Second heating scan
Tm1 (°C) Tm2 (°C) Tc1 (°C) ΔHc1 (J g−1) Tm2 (°C) ΔHm1 (J g−1) Crystallinity (%)
PHBV 165 ± 1 173 ± 1 116 ± 1 −84.6 ± 0.5 169 ± 1 95.2 ± 0.5 65 ± 0.5
PHBV/0.5BN 166 ± 1 173 ± 1 116 ± 1 −85.5 ± 0.5 167 ± 1 95.0 ± 0.5 65 ± 0.5
PHBV/1BN 166 ± 1 172 ± 1 117 ± 1 −87.2 ± 0.5 166 ± 1 97.2 ± 0.5 67 ± 0.5
PHBV/3BN 167 ± 1 172 ± 1 121 ± 1 −90.0 ± 0.5 167 ± 1 99.2 ± 0.5 70 ± 0.5


The peak maximum temperatures of first and the second melting peaks are given in Table 2 as Tm1 and Tm2. The presence of BN results in slight increase in the first melting temperature and does not affect the second melting temperature compared with neat PHBV sample. Crystallization temperature (Tc1) and heat of crystallization (ΔHc1) were determined from the DSC cooling runs of these samples. These are shown in Table 2 for composites with different BN contents. From Table 2, crystallization temperature and heat of crystallization of the nanocomposites are seen to increase with increasing BN loading. Tc1 values are in the range of 116–121 °C for composites as opposed to 116 °C for neat PHBV.

The second heating scan for neat PHBV and PHBV/BN composites showed unimodal endothermic melting peaks (Fig. 8). The second heating scan often reveals more thermal transitions in the material than the first heating scan since most of the thermal and stress histories are erased during the first heating scan. The Tm2 values are reported in Table 2 with a slight decrease when BN is added to the polymer, but no significant differences are observed as a function of the BN content.

For composite materials, the degree of crystallinity PHBV was calculated using the crystallization enthalpy of PHBV from the second DSC heating scans47

 
image file: c6ra19198c-t1.tif(1)
where ΔHf is the enthalpy of fusion of sample, WPHBV is the weight fraction of PHBV in the sample and ΔHreff is the enthalpy of fusion of 100% crystallized PHDV, 146 J g−1.47

The degree of crystallinity of the composite obtained by DSC was listed in the Table 2. It was found that the crystallinity of the PHBV increased in the composites when comparing the neat PHBV crystallinity. The addition of BN increased the degree of crystallinity PHBV from 65% to 70% at 3% wt BN loading. A change in the crystallization temperature and crystallinity values of the composite samples at lower concentrations indicated that the particles had a nucleating effect on the crystallization of the polymer matrix.

3.6 Oxygen barrier properties of the composites

The oxygen barrier properties of nanocomposites were determined by using the following equation,
 
OP = OTR × LP (2)
where OP is the rate of oxygen transmission through unit area of a flat material of unit thickness induced by unit vapour pressure difference across the material, (cm3 mm m−2 per day per atm), OTR is the oxygen transmission rate (cm3 m−2 per day), L is the film thickness (mm) and ΔP is the difference (atm) between oxygen partial pressure across the film. OP is defined as the quantity of oxygen molecules passing through a sheet surface area during a specific time at steady state under a partial pressure difference in oxygen between the two surfaces of the sample. As shown in Fig. 9, the OP of PHBV has a value of 1.47 ± 0.07 (cm3 mm m−2 per day per atm) at 23 °C and the incorporation of BN into polymer matrix decreases gas permeability. The OP of PHBV decreases from 1.39 ± 0.07 to 1.22 ± 0.06 (cm3 mm m−2 per day per atm) as the BN content of the composites increased from 0.5 to 3% wt as shown in Fig. 9. Barrier property of nanocomposite was also tested by using BN particles prepared without prior ultrasonication (sample PHBV/1BNnUS). The barrier properties (Fig. 9) show that ultrasonication decreases the OP values from 1.39 ± 0.07 to 1.24 ± 0.06 cm3 mm m−2 per day per atm for samples PHBV/1BNnUS and PHBV/1BN respectively.

image file: c6ra19198c-f9.tif
Fig. 9 Oxygen permeability (OP) of neat PHBV and PHBV/BN nanocomposites with different BN contents.

These results suggest that the incorporated BN nanoparticles create a barrier for the diffusing gas molecules. It is assumed that gas molecules can diffuse through free volumes at amorphous phase of a semi-crystalline material and no gas diffusion takes place in the crystalline phase.48 Therefore, a decrease in gas diffusion is expected with increasing crystallinity. The nanocomposite samples show improved barrier properties because nanoparticles dispersed in the biopolymer matrix create a tortuous pathway for the diffusion of gas out of the nanocomposite matrix. This increases the effective path length for diffusion of the gas, thereby reducing the rate of diffusion. The tortuous path is determined by the aspect ratio of the nanoparticles. Two-dimensional (2D) nanoplates, such as clays, have a higher aspect ratio than zero-dimensional (0) nanoparticles and one dimensional (1D) nanorods or nanotubes. So one would expect that using nanoclay within the polymer matrix gives better barrier properties. The effect of organomodified montmorillonite (C30B) on morphology, thermal and barrier properties of PHBV-based nanocomposites prepared by melt intercalation was investigated.49 The oxygen barrier properties of the polymer matrix were not improved in PHBV/C30B nanocomposites. Corrêa et al.28 have shown a slight improvement of oxygen barrier properties (about 12%) for a PHBV/C30B nanocomposite film. Sanchez-Garcia et al.26 have found that oxygen permeability of PHBV increases for 1 wt% and 10 wt% C30B content while a decrease was obtained for 5 wt%. Effect of addition of carbon nanofibers and carbon nanotubes on thermal, mechanical and gas barrier properties of PHBV biopolymers was investigated.50 Although the best reduction in the oxygen permeability occurs at low content of carbon nanotubes, the oxygen permeability decreases with increasing carbon nanofibers contents. Reductions in oxygen permeability of 14%, 5%, 21% and 58% for the film of PHBV with 1%, 3%, 5% and 10 wt% of carbon nanofibers, compared with the neat material were observed. Films of PHBV with 1%, 5% and 10 wt% carbon nanotubes reduce the oxygen permeability 62%, 10% and 33%, respectively, compared with the pure PHBV. The permeability of plastics depends on various factors such as functional additives, chemical nature of the polymer, free volume, crystallinity, co-polymerization, density, plasticizers and thickness. The permeability of the polymers is also affected by environmental conditions such as relative humidity and temperature. It was reported that oxygen permeability of amorphous polyamides decreases by increasing relative humidity.51 It has been suggested that it is energetically more favorable for water molecules to form hydrogen bonds with the polymer matrix of polyamide than to reside in free volume holes. The effect of humidity on the OP of polypropylene/clay nanocomposites was investigated.21 It was found the effect of humidity on OP of composites was very low. This was explained by the fact that interaction of water molecules with hydrophobic and semicrystalline polymer like PP is minimal due to low polarizability of water and very weak dispersion forces. Fabra et al. investigated the effect of incorporating electrospun whey protein isolate and pullulan nanofibres as interlayers on barrier and mechanical properties of PHBV3-based multilayer films.52 The oxygen permeability measurements were done at 80% relative humidity conditions. The addition of the electrospun pullulan and/or zein interlayers significantly improved oxygen barrier properties (up to 38–48%) of the PHBV3-based multilayer systems whereas whey protein beads did not affect oxygen permeability values of these multilayer films. This result was explained that proteins and polysaccharides were protected from humidity by the outer hydrophobic PHAs layers, thus displaying low oxygen permeability and, on the other hand, the bead morphology of the proteins did not improve oxygen barrier properties of multilayer systems.

The permeability is influenced by temperature. The diffusion rate increases exponentially with increasing temperature in accordance to Arrhenius law.53,54 The increase in diffusion rate can be explained by the greater mobility of polymer chains at higher temperature and with an increased free volume of the polymer. For packaging materials, it is interesting to know the influence of the temperature on the material. During transport temperature changes can occur when traveling through different climate zones. Currently no literature reports on the OP of PHBV as a function of temperature can be found. Therefore, it is important to determine the OP of PHBV at different temperatures.

It is possible to express OP, as a function of temperature by the following Arrhenius expression as shown below,

 
OP = P0[thin space (1/6-em)]e{−EP/RT} (3)
where P0 is the Arrhenius pre-exponential factor, EP is Arrhenius activation energy in J mol−1, R is the ideal gas law constant (8.314 J mol−1 K), and T is absolute temperature in kelvin (K). It is possible to arrange eqn (2) as shown below;
 
ln[thin space (1/6-em)]OP = ln[thin space (1/6-em)]P0EP/RT (4)

To evaluate the effect of BN on OP, Arrhenius plots of log(OP) versus 1/T for each type of sheet were made from the experimental data.

Arrhenius parameters were provided in order to allow estimation of OP values at desired temperatures. The PHBV sheets with and without BN showed increase in OP as the temperature increased from 23 °C to 50 °C (Fig. 10).


image file: c6ra19198c-f10.tif
Fig. 10 Oxygen permeability (OP) of neat PHBV and PHBV/3BN at different temperatures.

Good fit of the Arrhenius model for OP of the films was evidenced by the determination coefficient (R2), which ranged from 0.996 to 0.992 (Fig. 11). This correlation usually employed for synthetic polymer is also successfully used for a bio-based polymer. There was slight difference in the resulting activation energy between PHBV and PHBV/3BN samples. The activation energy values of PHBV/3BN were greater than PHBV, which indicates oxygen permeation through the composite sample is more sensitive to temperature changes than that of the PHBV, due to the presence of BN nanoparticles.


image file: c6ra19198c-f11.tif
Fig. 11 Arrhenius plot for neat PHBV and PHBV/3BN.

4. Conclusions

Boron nitride reinforced PHBV nanocomposites were prepared for the first time by melt processing method without using coupling agents. Their morphology, thermal and barrier properties were investigated. SEM morphology showed good dispersion of BN in the PHBV matrix without using coupling agent. The interaction between PHBV and boron nitride was evidenced by FTIR and XRD. XRD and DSC studies showed increase in crystallinity due to the addition of BN. TGA analysis showed that the thermal decomposition of PHBV was retarded by the interaction between BN and PHBV. BN addition tends to reinforce the oxygen barrier property of PHBV in relation with the crystallinity enhancement. It is also important to note that improving the BN organization in the PHBV matrix may add tortuosity and could lead to increase gas barrier properties.

Acknowledgements

M. Öner thanks the Scientific and Technological Research Council of Turkey (TÜBİTAK, Project No. 215M355), and M. Bechelany thanks the Campus France (PHC Bosphore No. 35211XD) for funding this work under a Bilateral Cooperation Program between Turkey and France. A. Çöl gratefully acknowledges TÜBİTAK for a scholarship. The authors wish to thank Dr Ali Koray of ADmajoris Turkey for the donation of PHBV.

References

  1. C. K. Williams and M. A. Hillmyer, Polym. Rev., 2008, 48, 1–10 CrossRef .
  2. A. Shah, F. Hasan, A. Hameed and S. Ahmed, Biotechnol. Adv., 2008, 26, 246–265 CrossRef CAS PubMed .
  3. R. W. Lenz and R. H. Marchessault, Biomacromolecules, 2005, 6, 1–8 CrossRef CAS PubMed .
  4. S. Philip, T. Keshavarz and I. Roy, J. Chem. Technol. Biotechnol., 2007, 82, 233–247 CrossRef CAS .
  5. G. Braunegg, L. Gilles and F. G. Klaus, J. Biotechnol., 1998, 65(2), 127–161 CrossRef CAS PubMed .
  6. W. J. Page, FEMS Microbiol. Rev., 1992, 9(2–4), 149–157 CrossRef .
  7. M. Akiyama, T. Tsuge and Y. Doi, Polym. Degrad. Stab., 2003, 80, 183–194 CrossRef CAS .
  8. I. Noda, P. R. Green, M. M. Satkowski and L. A. Schechtman, Biomacromolecules, 2005, 6, 580–586 CrossRef CAS PubMed .
  9. N. Grassie, E. J. Murray and P. A. Holmes, Polym. Degrad. Stab., 1984, 6, 47–61 CrossRef CAS .
  10. N. Grassie, E. J. Murray and P. A. Holmes, Polym. Degrad. Stab., 1984, 6, 95–103 CrossRef CAS .
  11. N. Grassie, E. J. Murray and P. A. Holmes, Polym. Degrad. Stab., 1984, 6, 127–134 CrossRef CAS .
  12. G. R. Saad and H. Seliger, Polym. Degrad. Stab., 2004, 83, 101–110 CrossRef CAS .
  13. J. M. Raquez, Y. Habibi, M. Murariu and P. Dubois, Prog. Polym. Sci., 2013, 38, 1504–1542 CrossRef CAS .
  14. N. Tenn, N. Follain, J. Soulestin, R. Cretois, S. Bourbigot and S. Marais, J. Phys. Chem. C, 2013, 117(23), 12117–12135 CAS .
  15. V. Siracusa, P. Rocculi, S. Romani and M. D. Rosa, Trends Food Sci. Technol., 2008, 19, 634–643 CrossRef CAS .
  16. J. W. Rhim, H. M. Park and C. S. Ha, Prog. Polym. Sci., 2013, 38, 1629–1652 CrossRef CAS .
  17. M. I. Marius, P. Yoann, M. Oltea, R. J. Marie, B. Leila and D. Philippe, J. Appl. Polym. Sci., 2015, 132, 1–11 Search PubMed .
  18. S. Spinella, L. R. Giada, B. Liu, J. Dorgan, Y. Habibi, L. Philippe, R. J. Spinella, D. Philippe and R. A. Gross, Polymer, 2015, 65, 9–17 CrossRef CAS .
  19. N. Lepot, N. M. K. Van Bael and H. Van den Rul, J. Appl. Polym. Sci., 2011, 120, 1616–1623 CrossRef CAS .
  20. K. Elen, M. Murariu and R. Peeters, Polym. Adv. Technol., 2012, 23, 1422–1428 CrossRef CAS .
  21. P. Atayev and M. Öner, J. Plast. Film Sheeting, 2014, 30(3), 248–265 CrossRef CAS .
  22. N. Pramanik, J. De, R. K. Basu, T. Rath and P. P. Kundu, RSC Adv., 2016, 6(52), 46116–46133 RSC .
  23. P. Dhar, D. Tarafder, A. Kumar and V. Katiyar, RSC Adv., 2015, 5(74), 60426–60440 RSC .
  24. H. Lu, S. A. Madbouly, J. A. Schrader, M. R. Kessler, D. Grewell and W. R. Graves, RSC Adv., 2014, 4(75), 39802–39808 RSC .
  25. G. X. Chen, G. J. Hao, T. Y. Guo, M. D. Song and B. H. Zhang, J. Mater. Sci. Lett., 2002, 21, 1587 CrossRef CAS .
  26. M. D. Sanchez-Garcia and J. M. Lagaron, J. Appl. Polym. Sci., 2010, 118(1), 188–199 CrossRef CAS .
  27. M. F. Lai, J. Li, J. Yang, J. J. Liu, X. Tong and H. M. Cheng, Polym. Int., 2004, 53, 1479 CrossRef CAS .
  28. M. C. S. Corrêa, J. Polym. Environ., 2012, 20(2), 283–290 CrossRef .
  29. W. Yu, C. H. Lan, S. J. Wang, P. F. Fang and Y. M. Sun, Polymer, 2010, 51, 2403–2409 CrossRef CAS .
  30. A. M. Diez-Pascual and A. L. Diez-Vicente, ACS Appl. Mater. Interfaces, 2014, 6, 9822–9834 CAS .
  31. J. S. Puente, A. Esposito, F. Chivrac and E. Dargent, J. Appl. Polym. Sci., 2013, 128(5), 2586–2594 CrossRef CAS .
  32. J. S. Puente, A. Esposito, F. Chivrac and E. Dargent, Macromol. Symp., 2013, 328, 8–19 CrossRef CAS .
  33. N. Follain, C. Chappey, E. Dargent, F. Chivrac, R. Crétois and S. Marais, J. Phys. Chem. C, 2014, 118(12), 6165–6177 CAS .
  34. J. Biscarat, M. Bechelany, C. Pochat-Bohatier and P. Miele, Nanoscale, 2015, 7(2), 613–618 RSC .
  35. C. Raman and P. Meneghetti, Plast. Addit. Compd., 2008, 10(3), 26–31 CrossRef CAS .
  36. K. Kim, M. Kim and J. Kim, Ceram. Int., 2014, 40(7), 10933–10943 CrossRef CAS .
  37. W. Cheewawuttipong, D. Fuoka, S. Tanoue, H. Uematsu and Y. Iemoto, Energy Procedia, 2013, 34, 808–817 CrossRef CAS .
  38. R. Pantani, G. Gorrasi, G. Vigliotta, M. Murariu and P. Dubois, Eur. Polym. J., 2013, 49, 3471–3482 CrossRef CAS .
  39. N. Galego, C. Rozsa, R. Sánchez, J. Fung, A. Vázquez and J. Santo Tomás, Polym. Test., 2000, 19, 485–492 CrossRef CAS .
  40. N. Yang, C. Xu, J. Hou, Y. Yao, Q. Zhang, M. E. Grami and X. Qu, RSC Adv., 2016, 6(22), 18279–18287 RSC .
  41. S. K. Swain, S. Dash, C. Behera, S. K. Kisku and L. Behera, Carbohydr. Polym., 2013, 95(2), 728–732 CrossRef PubMed .
  42. J. Li, M. F. Lai and J. J. Liu, J. Appl. Polym. Sci., 2004, 92, 2514–2521 CrossRef CAS .
  43. R. N. Muthu, S. Rajashabala and R. Kannan, Renewable Energy, 2016, 85, 387–394 CrossRef .
  44. E. Ten, J. Turtle, D. Bahr, L. Jiang and M. Wolcott, Polymer, 2010, 51(12), 2652–2660 CrossRef CAS .
  45. T. Liu and J. Petermann, Polymer, 2001, 42(15), 6453–6461 CrossRef CAS .
  46. M. Avella, G. La Rota, E. Martuscelli and M. Raimo, J. Mater. Sci., 2000, 35, 829–836 CrossRef CAS .
  47. R. M. Thiré, L. C. Arrudaa and L. S. Barretoa, Mater. Res., 2011, 14(3), 340–344 CrossRef .
  48. M. Klopffer and B. Flaconneche, Oil Gas Sci. Technol., 2001, 56, 223–244 CAS .
  49. R. Crétois, N. Follain, E. Dargent, J. Soulestin, S. Bourbigot, S. Marais and L. Lebrun, J. Membr. Sci., 2014, 467, 56–66 CrossRef .
  50. M. D. Sanchez-Garcia, J. M. Lagaron and S. V. Hoa, Compos. Sci. Technol., 2010, 70(7), 1095–1105 CrossRef CAS .
  51. Y. Hu, S. Mehta, D. Schiraldi, A. Hitner and E. Baer, J. Polym. Sci., Part B: Polym. Phys., 2005, 43, 1365–1381 CrossRef CAS .
  52. M. J. Fabra, A. Lopez-Rubio and J. M. Lagaron, J. Food Eng., 2014, 127, 1–9 CrossRef CAS .
  53. M. Avella, G. Bruno, M. E. Errico, G. Gentile, N. Piciocchi, A. Sorrentino and M. G. Volpe, Packag. Technol. Sci., 2007, 20, 325–335 CrossRef CAS .
  54. P. Simon, Q. Chaudry and D. J. Bakos, Food Nutr. Res., 2008, 47(3), 105–113 CAS .

This journal is © The Royal Society of Chemistry 2016