An efficient method for tylosin removal from an aqueous solution by goethite modified straw mass

Yongyuan Yina, Xuetao Guo*a, Chen Yangb, Liangmin Gaoa and Youbiao Hua
aSchool of Earth and Environment, Anhui University of Science and Technology, Huainan 232001, China. E-mail: guoxuetao2005@163.com; Fax: +86-554-6668004; Tel: +86-554-6668004
bCollege of Environment and Energy, South China University of Technology, Guangzhou, 510006, China

Received 28th July 2016 , Accepted 22nd September 2016

First published on 23rd September 2016


Abstract

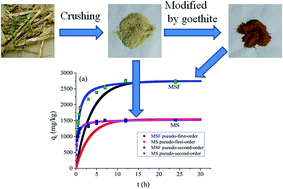
Renewable agricultural residues are produced in large quantities as waste, and their storage and management create environmental problems. Similarly, antibiotics could cause harm to the ecosystem and to the growth of plants and animals. As one of the widely used antibiotics in the world, the environmental risks of tylosin (TYL) are receiving increasing attention. In order to find a clean and effective method for TYL removal from an aqueous solution, maize straw (MS) is modified by goethite and the sorption capacity of the natural and modified forms (MSF) is determined for TYL removal. The characterisations of MS and MSF were carried out by XRD, FTIR, XPS and SEM-EDS. The characteristics of the sorption behavior of TYL on MS and MSF are systematically investigated. The results indicate that the sorption capacity of TYL on MSF is significantly higher than MS, and the sorption kinetics data of TYL on MS and MSF well fits the pseudo-second-order kinetics model and the sorption isotherms data well fits the linear model. Moreover, the sorption thermodynamics of TYL on MSF and MS indicate that a high temperature could favor the sorption of TYL on MS and MSF. In addition, the sorption of TYL on MS and MSF can be affected by pH and ionic strength of the solution. The sorption mechanisms of TYL on MS mainly involve electrostatic interactions and hydrophobic interactions, whereas electrostatic interactions, H bonding, hydrophobic interactions and surface complexation play a primal role in the sorption of TYL on MSF.


1. Introduction

Antibiotics have been widely used in healthcare, agriculture, aquaculture and livestock industry. However, more than 50–80% of their total parent compounds are excreted through urine and partially through feces as a mixture of metabolite conjugated compounds.1 Antibiotics and their metabolites are frequently detected in municipal sewage, surface water, groundwater, and soils/sediments.2,3 These antibiotics cause harm to the ecosystem and to the growth of plants and animals. Residual antibiotics may promote the development and spread of antibiotic resistant genes, which impact the health of animals and humans.4,5 Tylosin (TYL), which is a macrolide antibiotic produced by Streptomyces fradiae, is active against most Gram-positive bacteria, mycoplasma and certain Gram-negative bacteria, and is often added to feed additives in poultry and swine farms.5,6 Thus, removal of antibiotics from the environment is an important case study.7

Currently, many scholars have studied the removal of antibiotics from water, and the main methods for the removal of antibiotics include sorption, photodegradation, biodegradation and oxidation.1 Sorption, due to its simplicity, eco-friendliness and high efficiency, is one of the most important methods for antibiotics removal.8 Jia et al.9 reported oxytetracycline sorption on maize-straw-derived biochar, and their results showed that the sorption of oxytetracycline on biochar is highly pH-dependant and that surface complexation, π–π interaction and metal bridging were the most important sorption mechanisms. Zheng et al.10 studied sulfamethoxazole (SMX) sorption on biochars produced at 300–600 °C, and their results showed that biochars have the potential for remediation of soil or water containing sulfonamides in a wide range of pH and that hydrophobic interaction, π–π electron donor–acceptor interaction and pore-filling were the most important sorption mechanisms. Pezoti et al.11 reported NaOH-activated carbon of high surface area, which was produced from guava seeds, as an adsorbent for amoxicillin removal, and their results showed that the high-efficiency of the modified guava seeds for amoxicillin sorption was predominantly due to chemisorption. However, the process used to prepare biochars is mainly pyrolysis, which wastes lots of energy. Renewable agricultural residues are produced in huge quantities as waste, and their storage and management create environmental problems.12 Maize straw is very common in China and might be valuable for biomass production. However, it has not been paid much attention for the removal of antibiotics, which makes use of some of the more environmentally friendly ways that it can be modified.13

At present, there are many reports on the sorption of pollutants by modified biomass, for example Zhang et al.14 investigated the use of hexadecyl trimethyl ammonium bromide (HTAB) to modify rice straw by the grafting method. Zhou et al.15 reported novel carboxylate-rich wheat straw through surface graft modification for the efficient separation of Ce(III) from wastewater. However, the use of chemical methods to modify straw is not very good, since they are likely to produce secondary pollution. Goethite (a-FeOOH) is one of the most common and stable crystalline iron oxide in sediments and natural systems.16 This mineral has a relatively high surface area and high reactivity, which could be suitable for the sorption and deactivation of pesticides, nutrients, and hazardous compounds in natural conditions and might greatly affect the distribution and transport of contaminants in the environment.17 Previous studies have shown that goethite has the capacity to adsorb antibiotics, therefore the capacity of tylosin on biomass will be improved by using goethite to modify straw biomass, and not produce secondary pollution.4

In this study, the aim was to find an efficient method for TYL removal from aqueous solution by goethite modified maize straw, and understand the contribution of complexes on the aqueous solution fate of TYL and assess the sorption behavior and mechanism of TYL on complexes accurately. The influences of solution chemical factors (pH and ionic strength) on the sorption of TYL on straw biomass and goethite complexes are systematically investigated.

2. Materials and methods

2.1. Chemicals

TYL tartrate (purity > 95%) with a molecular weight of 916.14 g mol−1 was purchased from Sigma-Aldrich Corporation (St Louis, MO) and used as received. It has a solubility of slightly above 5000 mg L−1 in high-purity water. TYL is a weak base with a pKb of 7.1, at a solution pH lower than the pKb (7.1) of TYL, since the positively charged TYL+ is the dominant species in solution. However, when the solution pH is above the pKb, the relative concentration of TYL+ decreases and the neutral species of TYL becomes dominant. Acetonitrile and formic acid (high-performance liquid chromatography grade; Merck Chemicals Co. AQ5) were used as received. Milli-Q® water was produced by a purity water machine (Millipore Co., Guangzhou, China). Other chemicals were purchased from Guoyao Chemical Reagent Co. (Guang-zhou, China).

2.2. Maize straw, goethite and their complexes preparation and characterization

Maize straw was collected from Huainan City, Anhui Province, China. Protogenic maize-straw was smashed by a plant grinding machine and sieved to 40–100 mesh after washing and drying. Next, the maize straw was washed successively with alcohol and deionized water (DI water), which was repeated three times, then dried at 40 °C.

Goethite was synthesized according to the method introduced by Brigante et al.18 In brief, 5 M KOH was added to 0.5 M Fe(NO3)3 until a red colloid was generated. The resulting ferrihydrite dispersion was aged at 60 °C in a capped Teflon container for 60 h and then it was washed with double distilled deionized (DDI) water until the supernatant reached a pH close to the point of zero charge. Furthermore, the dispersion was freeze-dried to obtain a dry powder.

The MS–goethite (MSF) complexes were synthesized according to Guo et al.17 with minor modification. Briefly, 0.8 g bulk MS was added to 300 mL distilled water, and the suspension was sonicated for 10 min. Then, 0.8 g FeOOH was added to the suspension, and the suspension was successively sonicated for 30 min and stirred for 3 h. Then the mixture solution was poured into a Teflon crucible and placed inside an autoclave at 120 °C for 3 h, after which the suspensions were centrifuged at 3500 rpm for 30 min, then dried at 50 °C.19

Fourier transform infrared (FTIR) spectra were recorded with KBr pellets in the mid-infrared region using a Nicolet 6700 Infrared Detector (Thermo Fisher Scientific, USA). The constituents of the samples were identified using an X-ray powder diffractometer (XRD) (XD-2X/M4600, Beijing Purkinje General Instrument Co., Ltd, China). During the analysis, the samples were scanned from 20 to 70° at a speed of 4° min−1 using Cu Ka radiation at 40 kV. The microscopic features of the materials were recorded with an environmental scanning electron microscope (SEM) (XL-30-ESEM, Philips, Netherlands). X-ray photoelectron spectroscopy (XPS) data were obtained with an XSAM-800 spectrometer to study the elemental compositions. The point of zero charge (PZC) was measured by potentiometric titrations at three KCl concentrations.

2.3. Sorption experiments

Sorption experiments were conducted using the batch equilibrium technique. For the kinetic sorption experimental study, 0.5 g MS and MSF were added to 25 mL glass tubes containing each of the TYL at an initial concentration 20 ppm, and they were shaken horizontally at 150 rpm and 25 ± 2 °C. Samples were collected in a pre-weighed 1.5 mL amber glass vial at appropriate time intervals and filtered through a 0.45 μm membrane filter, then analyzed for their TYL concentration. Each time point, including blanks, was run in three parallels.

Sorption isotherm experiments for TYL were conducted at 25 ± 2 °C by adding adsorbent to 15 mL solutions with initial concentrations of TYL of 1 ppm, 5 ppm, 10 ppm, 20 ppm and 30 ppm with the adsorbent dosage of 0.02 g, 0.03 g, 0.03 g, 0.05 g and 0.07 g, respectively. The mixed solutions were shaken at a speed of 150 rpm for 12 h. After the sorption, the samples were collected in a pre-weighed 1.5 mL amber glass vial and filtered through a 0.45 μm membrane filter, and analyzed for the TYL concentration. Each concentration level, including blanks, was run in three parallels.

The pH effect experiments were carried out by adding a mass of 0.03 g sorbent to 25 mL solutions containing TYL with the initial concentration of 10 ppm. The mixed solutions were shaken at a speed of 150 rpm for 12 h. The solution pH was adjusted to different values between 3.0 and 11.0 using potassium hydroxide and HNO3 solution. After the sorption, the samples were filtered through a 0.45 μm membrane filter and analyzed, and each concentration level, including blanks, was run in three parallels.

For ionic strength experiments, a series of 10 ppm TYL solutions were prepared with ionic strengths from 0 to 0.1 M KNO3. The other sorption procedures were the same as that in the above pH effect experiments.

2.4. Chemical analysis

The concentrations of tylosin in an aqueous solution were measured by reverse-phase high-performance liquid chromatography (Hitachi D-2000 Elite-HPLC) with a C18 column (5 μm, 4.6 × 250 mm; Agilent) and a diode array UV detector (wavelength at 290 nm for tylosin). The mobile phase (at a flow rate of 1 mL min−1) for tylosin was a mixture of acetonitrile (35%) and an aqueous solution (65%) containing 0.01 mol L−1 KH2PO4 (pH = 2.0).

2.5. Sorption models

To investigate the sorption of TYL from aqueous solution onto the adsorbent surface, the widely used kinetics models, pseudo-first-order and pseudo-second-order models, are used to fit the sorption data. The equations are expressed as follows:20
 
image file: c6ra19172j-t1.tif(1)
 
image file: c6ra19172j-t2.tif(2)

The rate parameter ki for intraparticle diffusion model can be defined as:

 
qt = kit0.5 + constant (3)
where, qe and qt (mg kg−1) are the TYL sorption capacity of at equilibrium and time t, respectively, k1 is the pseudo-first-order rate constant, and k2 is the second-order rate constant.

The experimental isotherm data of TYL was correlated by the linear, Freundlich and Langmuir equations, which can be written as follows:2,7

 
qe = kdCe (4)
 
qe = kfCen (5)
 
image file: c6ra19172j-t3.tif(6)
where qe is the amount of adsorbate adsorbed (mg kg−1 adsorbent); Ce is the equilibrium concentration of TYL in the aqueous phase (mg L−1); kd (L kg−1) is the partition coefficient with the ratio of solid/solution; and kf ((mg kg−1) (L mg)−1/n) and n are Freundlich constants which give a measure of sorption capacity and sorption intensity. qm (mg kg−1) is the maximum uptake of TYL per unit mass of adsorbent, and b (L μg−1) is the Langmuir constant related to the rate of sorption.

The thermodynamic parameters (ΔH0, ΔS0, and ΔG0) can be determined from the temperature dependence. Free energy changes (ΔG0) are calculated from the following equations:

 
ΔG0 = −RT[thin space (1/6-em)]ln[thin space (1/6-em)]K0 (7)
 
image file: c6ra19172j-t4.tif(8)

The values of ΔS0 were calculated from:

 
image file: c6ra19172j-t5.tif(9)
where R is the universal gas constant, and T is the temperature in Kelvin. The equilibrium constant (K0) was obtained following the method used by Khan and Singh. In brief, the sorption data were plotted as ln[thin space (1/6-em)]kd vs. qe and qe was extrapolated to zero firstly; then, a linear regression was performed on the experimental data based on least-squares analyses and the intercept on the y-axis gives the value of ln[thin space (1/6-em)]K0. Its intercept with the vertical axis gives the value of ln[thin space (1/6-em)]K0. The ΔH0 values were calculated from the slopes of the linear variation of ln[thin space (1/6-em)]K0 versus 1/T.

3. Results and discussion

3.1. Characterization of the MS and MSF complexes

Scanning electron microscopy (SEM) was carried out in order to evaluate the morphology of the materials before and after goethite modification. SEM images of MS and MSF are shown in Fig. 1. As can be seen in Fig. 1a, MS has a smooth surface. The SEM images of MSF (Fig. 1b and c) clearly indicate surface alterations after the combining process, in which MSF has a slightly rougher and irregular surface. From this image, we can conclude that FeOOH was immobilized onto the surface of MS. The EDX cartograph of MSF reported in Fig. 1d shows that MSF contains C, O and Fe elements.
image file: c6ra19172j-f1.tif
Fig. 1 SEM images of MS and MSF.

Fig. 2 shows the X-ray diffractogram of the FeOOH, MS and MSF samples. The peak coincidence and the absence of extra peaks in the experimental diffractogram indicate that the studied FeOOH sample was a well-crystallized goethite, and that no other crystalline phases were detected by XRD. The goethite characteristic peaks are located at 20.92, 32.66, 35.96 and 53.06.18 Strong diffraction peaks are observed at the 2θ of 15.60 and 22.23 for MS. After combining MS and FeOOH, all the peaks of the as-prepared MS and FeOOH were still observed, although the intensity of the reflection peaks at the 2θ of 15.60 decreased, which imply that the MSF complexes retained the composition of both MS and FeOOH. This result indicates that the crystal structure of goethite was not changed after modification with MS.21


image file: c6ra19172j-f2.tif
Fig. 2 XRD patterns of FeOOH, MS and MSF.

Fig. 3 shows the FTIR spectra of the FeOOH, MS and MSF samples. For the goethite spectrum, the two index peaks at 3400 and 3150 cm−1 are assigned to the –OH vibration which is related to non-stoichiometric hydroxyl units (excess water) in the goethite structure. The band at 1634 cm−1 is assigned to the water bending vibration. The strong absorption peaks at 890 cm−1 and 790 cm−1 are caused by the in-plane bending of the surface hydroxyl of Fe–O–Fe, and 638 cm−1 is due to Fe–O stretching.18,22 For the MS spectrum, the band at 3450 cm−1 is assigned to the O–H stretching vibration of water or H-bonded hydroxyl groups. The band at 2920 cm−1 is assigned to –CH2 stretching. The bands at 1640 and 1380 cm−1 in the spectra MS and MSF can be assigned to C[double bond, length as m-dash]O axial deformation (aldehyde, lactone, ketone and carboxyl groups) and to oxygen functionalities such as highly conjugated C[double bond, length as m-dash]O stretching or C–O stretching in carboxyl groups, respectively. The peaks at 1560, 1510 and 1460 cm−1 are characteristic bonds of aromatic compounds, which represent the C[double bond, length as m-dash]O and C[double bond, length as m-dash]C stretching of conjugated ketones and quinines and aromatic skeletal C, respectively. The bands at 1160 cm−1 can be attributed to the C–O stretching vibration. The peak at around 890 cm−1 is assigned to –OH stretching.9,11 However, compared with the spectra of MS and FeOOH, the only difference in the MSF spectrum is that it has no band at 3150 cm−1. These results confirm that the addition of FeOOH has no effect on the crystal structure of MS. It is also indicated that the binding of FeOOH to the MS surface is mainly through ligand exchange.21


image file: c6ra19172j-f3.tif
Fig. 3 FTIR images of MS and MSF.

More quantitative information with respect to the chemical composition and functional groups were extracted from the XPS analysis. Fig. 4a shows the XPS spectra of MS and MSF, in which MS shows two dominant peaks at 286 and 533 eV, which correspond to the C1s and O1s bands, respectively. The MSF spectrum shows the same peaks in addition to a third peak at 726 eV, which corresponds to the Fe2p band. As shown in Fig. 4b, for the O1s spectra of MS and MSF, the peaks at 532.79 eV and 531.81 eV, respectively, correspond to the double bond of oxygen, and these peaks confirm the existence of carbonyl and carboxyl groups. The peaks at 534.54 eV and 533.46 eV can be attributed to the single bond of oxygen, and these peaks confirm the existence of epoxy and hydroxyl. However, the XPS spectrum of MSF exhibits a peak at 529.97 eV, which is attributed to the O ion in goethite. As shown in Fig. 4c, the XPS spectrum of MS exhibits three peaks at 284.57 eV, 286.08 eV and 287.34 eV, which are attributed to the C[double bond, length as m-dash]C bond, C–O bond and C[double bond, length as m-dash]O bond, respectively.23,24 Compared with MS, MSF only has two peaks at 284.6 eV and 286.76 eV, and it is also observed that MSF has no C[double bond, length as m-dash]O bond at 287.34 eV. Fig. 4d shows the XPS spectra of MSF, in which the peaks at 713.29 eV and 725.99 eV are due to the 2p3/2 and 2p1/2 transitions in goethite, respectively.25


image file: c6ra19172j-f4.tif
Fig. 4 XPS spectra of MS and MSF.

Fig. 5 shows the relationship between zeta potential and pH, and the iso-electric points (IEPs) of MS and MSF. The results indicate that the IEPs of MS and MSF approximately occur in the pH of 2.4 and 6.3, respectively. The IEPs of MSF are higher than that of MS, which suggest that the goethite modification caused MS to have more negative charge due to the introduction of a large amount of goethite.


image file: c6ra19172j-f5.tif
Fig. 5 Zeta potentials of MS and MSF.

3.2. Sorption kinetics of TYL on MS and MSF complexes

The effect of contact time on the amount of adsorbed TYL is presented in Fig. 6. The sorption increases with an increase in reaction time, where most TYL was adsorbed rapidly in 2.5 h, followed by a relatively slow process, and equilibrium was achieved within 24 h. In order to investigate the sorption process of TYL on the MS and MSF complexes, pseudo-first-order and pseudo-second-order kinetic models were used. Table 1 shows the kinetic parameters for the TYL adsorption process on all the studied materials. The theoretical qe values calculated from the pseudo-first-order kinetic model differ from the experimentally measured values, and the corresponding correlation coefficients are lower than those for the pseudo-second-order model. Thus, the sorption kinetics of TYL on MS and MSF fitted well into the pseudo-second-order kinetics model (R2 > 0.999) (Fig. 6b), which indicate that chemisorption might have been the major sorption mechanism.8 The sorption rate constant k2 followed the order of MS > MSF, thus suggesting that TYL was adsorbed onto MS more quickly. However, comparing the qe, the amount of TYL adsorbed on MSF is larger than MS, which indicates that FeOOH significantly enhances the sorption of TYL on MS.
image file: c6ra19172j-f6.tif
Fig. 6 Sorption kinetics of TYL on MS and MSF.
Table 1 Kinetic parameters of TYL sorption onto MS and MSF
Conditions qe exp (mg kg−1) Pseudo-first-order Pseudo-second-order
qe (mg kg−1) k1 (1/h) R2 qe (mg kg−1) k2 × 10−4 (g μg−1 h−1) R2
MS 1527 532 0.899 0.770 1530 26.07 0.999
MSF 2765 1867 0.962 0.793 2795 6.38 0.999


To reveal the relative contribution of surface and intraparticle diffusion to the entire kinetic sorption process, the experimental data were fitted with the intraparticle diffusion model. Intraparticle diffusion is presumed to be the rate-controlling step if the simulation curve is linear and the plot passes through origin. As seen from Fig. 7, the fact that the model curves did not pass through the origin with positive intercepts (C ≠ 0) indicates that both surface sorption and intra-particle diffusion contribute to the actual sorption process of TYL on MS and MSF.26 Subsequently, three successive sorption mechanisms were postulated to fit a linear model, as seen in Fig. 7. The first stage, in which about 68–80% of TYL is adsorbed on MS and MSF, is attributed to the occupation of exterior activated sites by various physicochemical interactions (such as hydrophobic interactions, covalent forces, and van der Waals forces). Moreover, the thickness of the boundary layer (C) for MS and MSF in this stage is more conspicuous, which indicates that surface sorption plays an important role for TYL sorption on MS and MSF. In the second stage, only 20–25% of the TYL adsorbed on the sorbents slowly diffused from liquid film into the microporous surface. In the third stage, the intra-particle diffusion rate was obviously lower than the former stage of surface diffusion due to the diameter of the micropore which was relatively small compared to the larger size of the TYL molecule.21


image file: c6ra19172j-f7.tif
Fig. 7 Intraparticle diffusion model with different initial concentrations of TYL on MS and MSF.

3.3. Sorption isotherms of TYL on MS and MSF complexes

The sorption isotherm is critical in the design of sorption systems. The sorption isotherms of TYL onto MS and MSF are plotted in Fig. 8. The sorption data were fitted by the linear, Langmuir and Freundlich equations, and the calculated parameters are summarized in Table 2.
image file: c6ra19172j-f8.tif
Fig. 8 Sorption isotherms of TYL on MS and MSF.
Table 2 List of TYL sorption isotherm parameters
Conditions Henry model Freundlich model Langmuir model
kd (L kg−1) R2 n kf (mg kg−1) (mg L)n R2 qm (mg kg−1) b R2
MS 31.4 0.987 0.705 72.2 0.963 497.5 0.218 0.959
MSF 125.2 0.998 0.694 281.9 0.966 1596.9 0.293 0.954


The linear isotherm characteristic suggests an apparent partition of organic pollutants between the two phases of the solids and the solution.2 It can be seen from Table 2 that the sorption data could be fitted well by the linear model (R2 = 0.987 for MS and R2 = 0.998 for MSF), and the kd were 31.4 and 125.2 (L kg−1) for TYL sorption on MS and MSF, respectively. In this matter, our results are in agreement with the studies investigating the sulfadimethoxine and sulfaguanidine sorption behavior on natural soils.27

The Freundlich model is a nonlinear sorption model, which suggests the heterogeneity of the surface and the exponential distribution of sites and their energies.28 It can be seen from Table 2 that the sorption data also could be fitted well by the Freundlich model (R2 = 0.963 for MS and R2 = 0.966 for MSF). The n values were below 1, which suggest a decreasing sorption tendency with an increase in initial concentration. This might be because the high energy sites of MS and MSF were occupied firstly, followed by the lower energy sites, which is an observation characteristic of heterogeneous media.29 The nonlinearity of the sorption behaviors indicates specific interactions with functional groups on MS and MSF.27 The kf for the Freundlich model obtained in this study were 72.2 and 281.9 (mg kg−1) (mg L)n for MS and MSF, respectively, which indicate that the sorption capacity of TYL on MSF is larger than MS (Table 3).

Table 3 Effect of temperature on the sorption isotherm parameters of TYL on MSF and MS
Conditions Henry model Freundlich model Langmuir model
kd (L kg−1) R2 n kf (μg g−1) (mg L)n R2 qm (mg kg−1) b R2
MSF 15 °C 75.8 0.987 0.711 183 0.978 1313 0.194 0.959
25 °C 123.3 0.998 0.703 278 0.971 1694 0.254 0.953
35 °C 148.9 0.994 0.627 424 0.986 2005 0.387 0.975
MS 15 °C 19.3 0.996 0.768 37 0.973 369 0.130 0.973
25 °C 31.5 0.996 0.723 71 0.982 552 0.187 0.978
35 °C 39.0 0.962 0.678 121 0.999 862 0.198 0.993


The Langmuir model suggests that uptake occurs on the homogeneous surface by monolayer sorption without interaction between the sorbed molecules.30 It assumes uniform sorption energies onto the surface and no transmigration of sorbate in the surface.2,31 It is clear from Table 2 that the saturate sorption amount of tetracycline on MS and MSF was 497.5 and 1596.9 mg kg−1, respectively. However, the suitability of the use of the Langmuir isotherm to describe the sorption behavior of the investigated TYL can be explained either by the low concentrations used in the experiments or probably by the homogeneity of the interaction sites.27 Nevertheless, the fitting to the Langmuir equation yielded results (R2 = 0.959 for MS and R2 = 0.954 for MSF) not as good as that obtained with the linear model and the Freundlich model mentioned above.

3.4. Sorption thermodynamics of TYL on MSF and MS

Changes in temperature could affect the sorption behavior of organic chemicals on sorbents, thus the sorption of TYL on MSF and MS at different temperatures was investigated (Fig. 9). An increase in temperature could enhance the rate of molecular diffusion and decrease the viscosity of the solution. Thus, it can be easier for sorbate molecules to cross the external boundary layer and move into the internal pores of sorbents.21 As shown in Fig. 9, TYL sorption increased with an increase in temperature from 15 °C to 35 °C, which indicates that a higher temperature could favor the sorption of TYL on MSF and MS.
image file: c6ra19172j-f9.tif
Fig. 9 Effect of temperature on the sorption of TYL on MSF and MS.

The thermodynamic parameters (ΔH0, ΔS0, and ΔG0) calculated by eqn (7)–(9) are shown in Table 4. It can be seen that the value of kd increased with an increase in temperature. Since the plot of ln[thin space (1/6-em)]k versus 1/T is linear for TYL and SMT (Fig. 10), the related thermodynamic parameters, such as ΔH0 and ΔS0, are available.21 The increased ΔG0 with increasing TYL sorption illustrates that the driving force of sorption decreased due to the occupation of the high energy sorption sites. The highest negative ΔG0 values were found for TYL at the same temperature, which suggest that the sorption potential for TYL was the largest at this temperature. The positive ΔH0 values for TYL indicate that sorption of TYL on MSF and MS was endothermic and associated with an entropy driven process (ΔS0 > 0). Changes in ΔH0 may indicate the binding mechanisms including physisorption (ΔH0 < 40 kJ mol−1) and chemisorption (ΔH0 > 40 kJ mol−1). Thus, TYL sorption onto MS can be mainly attributed to physisorption and TYL sorption onto MSF can be mainly attributed to chemisorption. Another thermodynamic parameter, entropy ΔS0, was used to evaluate the randomness of the system. The sorption of TYL disrupts the hydration shell around MS and MSF, thus leading to increased randomness for the TYL–water–MS/MSF system (ΔS0 > 0). For the TYL–water–MSF system with a higher ΔS0 than the TYL–water–MS system, more energy is needed to regain its original entropy state and TYL sorption onto MSF can be mainly attributed to chemisorption.4,21

Table 4 Thermodynamic parameters of TYL sorption on MS and MSF
Sample ln[thin space (1/6-em)]k Temperature (°C) ΔG0 (kJ mol−1) ΔH0 (kJ mol−1) ΔS0 (J mol−1 K−1)
MSF 4.32 15 −17.9 41.9 155.2
4.81 25 −23.2
5.01 35 −28.5
MS 2.96 15 −8.62 29.3 76.4
3.45 25 −10.1
3.67 35 −13.6


image file: c6ra19172j-f10.tif
Fig. 10 Effect of temperature on TYL sorption on MS and MSF.

3.5. Effects of pH and ionic strength on sorption of TYL

The effect of pH on the sorption of TYL on MS and MSF are shown in Fig. 11. As listed in Fig. 11, the sorption of TYL onto MS and MSF was influenced by the solution pH values. The sorption decreased with an increase in pH value. The observed results are associated with the characteristics of TYL and the adsorbent. At a solution pH lower than the pKb (7.1) of TYL, the positively charged TYL+ is the dominant species in solution, which can be strongly attracted by the negatively charged surfaces of MS and MSF. The overall sorption of TYL on MS and MSF can even be dominated by electrostatic interactions,5 and H-bonding between the functional groups of TYL and MSF which might also be the dominant sorption interaction of TYL on MSF in the acidic condition.6 As the solution pH increased above the pKb, the relative concentration of TYL+ decreased and the neutral species of TYL became dominant. As a result, the electrostatic interactions between TYL+ and the adsorbents weakened. The sorption of neutral TYL on MS may be dominated by hydrophobic interactions.32 A similar interaction was also identified between TYL and clay minerals.5 Compared with MS, the sorption of neutral TYL on MSF could be related with surface complexation and hydrophobic interactions.5,6
image file: c6ra19172j-f11.tif
Fig. 11 Effect of pH on the sorption of TYL on MS and MSF.

The effect of ionic strength as indicated by KNO3 concentration on TYL sorption is shown in Fig. 12. The sorption of TYL decreased as ionic strength increased. The observed inverse relationship between the amount of sorbed TYL and ionic strength suggests that K+ might have competed with TYL for sorption sites,9,33 which suggests that there might exist surface complexation between TYL and MSF.21 The surface of goethite contains active hydroxyl groups, which can adsorb organic pollutants in the form of complexation. A similar interaction was also identified between goethite with TYL and ciprofloxacin.6,34 The sorption mechanisms of TYL on MS and MSF are shown in Fig. 13.


image file: c6ra19172j-f12.tif
Fig. 12 Effect of ionic strength on the sorption of TYL on MS and MSF.

image file: c6ra19172j-f13.tif
Fig. 13 Sorption mechanism of TYL on MS and MSF.

4. Conclusions

The main sorption mechanisms of TYL to MS are attributed to electrostatic interactions and hydrophobic interactions. Whereas, the sorption of TYL on MSF could be related with electrostatic interactions, H bonding, hydrophobic interactions and surface complexation. The sorption amount and sorption affinity of TYL to MS and MSF are influenced by solution pH, ionic strength and temperature. The sorption capacity of TYL on MSF is larger than MS. Therefore, MSF is considered a cleaner adsorbent for TYL removal, which presents great potential in applications for the removal of organic pollutants from aqueous solution.

Acknowledgements

The study was financially supported by the China National Science Fund Program (No. 41503095), the Natural Science Foundation of Universities of Anhui Province (KJ2015A016), the PhD Fund of Anhui University of Science and Technology (ZY540) and the Key Science Foundation for Young Teachers of Anhui University of Science and Technology (QN201507).

References

  1. R. Gothwal and T. Shashidhar, Clean: Soil, Air, Water, 2015, 43, 479–489 CrossRef CAS .
  2. X.-R. Xu and X.-Y. Li, Chemosphere, 2010, 78, 430–436 CrossRef CAS PubMed .
  3. L. Gao, Y. Shi, W. Li, J. Liu and Y. Cai, Environ. Sci. Pollut. Res., 2015, 22, 11360–11371 CrossRef CAS PubMed .
  4. X. Guo, C. Yang, Z. Dang, Q. Zhang, Y. Li and Q. Meng, Chem. Eng. J., 2013, 223, 59–67 CrossRef CAS .
  5. Q. Zhang, C. Yang, W. Huang, Z. Dang and X. Shu, Chemosphere, 2013, 93, 2180–2186 CrossRef CAS PubMed .
  6. X. Guo, C. Yang, Y. Wu and Z. Dang, Environ. Sci. Pollut. Res., 2014, 21, 2572–2580 CrossRef CAS PubMed .
  7. M. J. Ahmed and S. K. Theydan, J. Taiwan Inst. Chem. Eng., 2014, 45, 219–226 CrossRef CAS .
  8. Z. Zhang, H. Lan, H. Liu and J. Qu, Colloids Surf., A, 2015, 471, 133–138 CrossRef CAS .
  9. M. Jia, F. Wang, Y. Bian, X. Jin, Y. Song, F. O. Kengara, R. Xu and X. Jiang, Bioresour. Technol., 2013, 136, 87–93 CrossRef CAS PubMed .
  10. H. Zheng, Z. Wang, J. Zhao, S. Herbert and B. Xing, Environ. Pollut., 2013, 181, 60–67 CrossRef CAS PubMed .
  11. O. Pezoti, A. L. Cazetta, K. C. Bedin, L. S. Souza, A. C. Martins, T. L. Silva, O. O. Santos Júnior, J. V. Visentainer and V. C. Almeida, Chem. Eng. J., 2016, 288, 778–788 CrossRef CAS .
  12. P. S. Vassileva, T. H. Radoykova, A. K. Detcheva, I. A. Avramova, K. I. Aleksieva, S. K. Nenkova, I. V. Valchev and D. R. Mehandjiev, Int. J. Environ. Sci. Technol., 2016, 13, 1319–1328 CrossRef CAS .
  13. L. Xiao, E. Bi, B. Du, X. Zhao and C. Xing, Environ. Earth Sci., 2013, 71, 5195–5205 CrossRef .
  14. R. Zhang, Y. Zhou, X. Gu and J. Lu, Desalin. Water Treat., 2016, 57, 15220–15229 CrossRef CAS .
  15. Q. Zhou, C. Yan and W. Luo, Mater. Des., 2016, 97, 195–203 CrossRef CAS .
  16. X. Guo, H. Dong, C. Yang, Q. Zhang, C. Liao, F. Zha and L. Gao, Colloids Surf., A, 2016, 502, 81–88 CrossRef CAS .
  17. X. Guo, J. Zhang, J. Ge, C. Yang, Z. Dang, S. Liu and L. Gao, RSC Adv., 2015, 5, 100464–100471 RSC .
  18. M. Brigante, G. Zanini and M. Avena, J. Hazard. Mater., 2010, 184, 241–247 CrossRef CAS PubMed .
  19. Z. Tong, D. Yang, T. Xiao, Y. Tian and Z. Jiang, Chem. Eng. J., 2015, 260, 117–125 CrossRef CAS .
  20. Y. Sun, Q. Yue, B. Gao, Y. Gao, X. Xu, Q. Li and Y. Wang, J. Taiwan Inst. Chem. Eng., 2014, 45, 681–688 CrossRef CAS .
  21. X. Guo, J. Ge, C. Yang, R. Wu, Z. Dang and S. Liu, RSC Adv., 2015, 5, 58865–58872 RSC .
  22. S. Rahimi, R. M. Moattari, L. Rajabi and A. A. Derakhshan, Colloids Surf., A, 2015, 484, 216–225 CrossRef CAS .
  23. Q. Zhang, D. D. Zheng, L. S. Xu and C.-T. Chang, Catal. Today, 2016, 274, 8–14 CrossRef CAS .
  24. T. Wang, J. Lu, L. Mao and Z. Wang, J. Membr. Sci., 2016, 515, 125–133 CrossRef CAS .
  25. B. Qiu, M. Xing and J. Zhang, J. Mater. Chem. A, 2015, 3, 12820–12827 CAS .
  26. H.-T. Qiao, Y. Liu, Y.-H. Dong, S. Li, P. Wang and T. Jin, Desalin. Water Treat., 2015, 54, 113–121 CrossRef CAS .
  27. A. Bialk-Bielinska, J. Maszkowska, W. Mrozik, A. Bielawska, M. Kolodziejska, R. Palavinskas, P. Stepnowski and J. Kumirska, Chemosphere, 2012, 86, 1059–1065 CrossRef CAS PubMed .
  28. W. C. Li and M. H. Wong, Int. J. Environ. Sci. Technol., 2015, 12, 2731–2740 CrossRef CAS .
  29. L. M. Peruchi, A. H. Fostier and S. Rath, Chemosphere, 2015, 119, 310–317 CrossRef CAS PubMed .
  30. W. Liu, J. Zhang, C. Zhang and L. Ren, Chem. Eng. J., 2011, 171, 431–438 CrossRef CAS .
  31. F. Moyo, R. Tandlich, B. S. Wilhelmi and S. Balaz, Int. J. Environ. Res. Public Health, 2014, 11, 5020–5048 CrossRef PubMed .
  32. N. Liu, M.-x. Wang, M.-m. Liu, F. Liu, L. Weng, L. K. Koopal and W.-f. Tan, J. Hazard. Mater., 2012, 225, 28–35 CrossRef PubMed .
  33. D. Avisar, O. Primor, I. Gozlan and H. Mamane, Water, Air, Soil Pollut., 2010, 209, 439–450 CrossRef CAS .
  34. X. Gu, Y. Tan, F. Tong and C. Gu, Chem. Eng. J., 2015, 269, 113–120 CrossRef CAS .

This journal is © The Royal Society of Chemistry 2016
Click here to see how this site uses Cookies. View our privacy policy here.