DOI:
10.1039/C6RA19106A
(Paper)
RSC Adv., 2016,
6, 95504-95511
Influence of mixed CTABr–C16E20 nanoparticles on relative counterion binding constants in aqueous solutions of inert salts (2-NaOC6H4CO2Na and NaBr): kinetic and rheometric study
Received
28th July 2016
, Accepted 13th September 2016
First published on 21st September 2016
Abstract
A semi-empirical kinetic technique has been used to obtain the ratios of pure CTABr (cationic nanoparticle) and mixed CTABr–C16E20 (cationic–nonionic nanoparticle) micellar binding constants of counterions X and Br, KX/KBr (=KBrX or RBrX) for X = salicylate ion. The values of KBrX or RBrX for the salicylate ion remain typically independent of the concentration of pure micelles, [CTABr]T (0.006–0.015 M). These values are also independent of mixed [CTABr]T–[C16E20]T micelles under similar conditions. The presence of C16E20 decreases the average values of KBrX or RBrX from 42 to 16 for salicylate ions. Increase in concentration of cationic and cationic–nonionic nanoparticles at a fixed amount of CTABr reveals the monotonic increase in the value of kobs, which was explained using the PPM model together with an empirical equation. Rheological characteristics of 0.015 M CTABr solutions in the presence of disodium salicylate indirectly show the presence of branched elongated nanoparticles at 25 °C and 35 °C and [C16E20]T = 0. Contrarily, such findings reveal the existence of spherical micelles at 25 °C and 35 °C in the presence of ≥0.006 M [C16E20]. The values of KBrX or RBrX and rheological observations clearly demonstrate that 0.015 M CTABr/M2X/H2O (M2X = disodium salicylate, 2-NaOC6H4CO2Na) solutions contain wormlike and spherical micelles when KBrX or RBrX values are ≈42 and 16, respectively.
1. Introduction
Micellar substances are nanoparticles in nature and their molecular, physical and chemical behaviors on the kinetic rates of reactions have been thoroughly investigated for almost sixty years.1 Despite the fact that experimental and theoretical studies on the structure of mixed micelles have been published for the past 20 to 30 years, details of the reactions have not been well discussed when compared to pure micelles. Studies on the kinetic rates of reactions and the influence of mixed micelles began less than 25 years ago.2,3 Efforts were made to come up with highlights on the majority of the data using one of the two following models: (i) micellar models of pure surfactant solutions4,5 or (ii) the combination of (i) and empirical equations.6,7
Addition of nonionic micelles (CnEm) to cationic micellar-mediated reaction mixture lowers a number of counterions at the surfaces of ionic surfactants, and hence reduces the fraction of ionic surfactant coverage (β).8,9 Moreover, the volume of the micellar pseudophase also increases,10 which in turn affects the amount of micellized reactant via dilution. The pseudophase micellar model (PMM), coupled with eqn (1), has been used to analyze the data.11
| | |
KS = K0S/(1 + KX/S[MX]T)
| (1) |
where
KS is the CTABr micellar binding constant of the anionic reactant S
− (and is equal to
KS in the absence of X
−) and
KX/S is an empirical constant whose value indicates the tendency of X
− to alter the micellar affinity of S
− from pure CTABr micelles to an aqueous CTABr micellar phase. Therefore,
KX/S should be directly and inversely proportional to
KS and
K0S, respectively.
12
Several efforts have been made to bring reliable clarification(s) to the viscoelastic nature of the micellar systems in the aqueous phase, but almost all the clarifications are insufficient for some systems, such as those of CTABr with certain inert salts.13 Moreover, there is a scarcity of quantitative and theoretical evidence(s) to confirm that the addition of these salts in a surfactant solution results in viscoelastic behavior of micelles.
The present study varies from previously published ones12,14 due to the fact that it is designed with aims as follows: (a) to deal with mixed cationic–nonionic surfactants (CTABr–C16E20) and a bimolecular reaction aimed at providing a quantitative elucidation on how the rate of CTABr–C16E20 micellar-catalyzed organic reactions could be affected by the addition of sodium salicylate, and (b) to use rheological information to ascertain if near-irreversible micellar entrapment of sodium salicylate could be due to the change in the structure of mixed cationic–nonionic surfactants (CTABr–C16E20) from spherical to rod-like micelles under different experimental conditions. The results obtained and their likely elaborations are presented in this manuscript.
2. Experimental
2.1 Materials
Reagent-grade substances, which are commercially available, included the following: phenyl salicylate (PSH), hexadecyltrimethyl ammonium bromide (CTABr), polyethylene glycol hexadecyl ether [C16H33(OCH2CH2)20OH·(C16E20)], piperidine (Pip), sodium bromide (NaBr, MX) and sodium salicylate (2-HOC6H4CO2Na, M2X). The standard solutions of 0.5 M disodium salicylate (2-NaOC6H4CO2Na) were prepared by adding 0.55 M NaOH to a 0.5 M solution of sodium salicylate. Stock solutions of 1.0 M Pip and 0.01 M PSH were prepared using distilled deionized water and acetonitrile, respectively.
2.2 Kinetic method
Spectrophotometric measurements have been carried out to observe the disappearance of ionized phenyl salicylate PS− in a solution containing 0.1 M Pip, >0.03 M NaOH, and NaBr as well as 2-NaOC6H4CO2Na, at 370 nm and 35 °C (in the presence of pure CTABr and mixed CTABr–C16E20 micelles). The rate was monitored at different concentrations of MX and M2X (MX = NaBr and M2X = 2-NaC6H4CO2Na) using a UV-visible spectrophotometer. The details and the outcome of the kinetic experiment were described elsewhere.15
The pseudo first order rate law was maintained throughout by making sure that the ratio of [Pip]T![[thin space (1/6-em)]](https://www.rsc.org/images/entities/char_2009.gif) :[PS−]T was 500:1 where [ ]T stands for the total concentration. Eqn (2) shows the relationship between the absorbance (Aob) and the reaction time (t) for the reaction.
:[PS−]T was 500:1 where [ ]T stands for the total concentration. Eqn (2) shows the relationship between the absorbance (Aob) and the reaction time (t) for the reaction.
| | |
Aob = [R0]δappexp(−kobst) + A∞
| (2) |
where [R
0] stands for the initial concentration of PS
− (2 × 10
−4 M). This equation was used to calculate
δapp (apparent molar absorptivity),
kobs (pseudo first order rate constant) and
A∞ (=
Aob at
t = ∞) by the use of the nonlinear least-squares method. Analyses of the results are described elsewhere.
15
2.3 Determination of mKBrX or mRBrX for X (=–OC6H4CO2Na) using the semi-empirical kinetics technique
To determine mKBrX or mRBrX, for the reaction kinetics of this study, the semi-empirical kinetics (SEK) method is used, which has been explained elsewhere.16 Kinetic parameters KnX/S for the counterions in question being X− and Br− (test and reference counterions), were determined using the SEK technique at a constant pure [CTABr]T and temperature. The values of kobs for the piperidinolysis of PS− were obtained in the presence of pure [CTABr]T and mixed [CTABr]T–[C16E20]T micelles at different concentrations of MX and M2X (MX = NaBr and M2X = 2-NaOC6H4CO2Na). Different values of kobs at various [MX], in the absence of CTABr, are required to use the SEK technique. Details of this technique and explanations of the reaction mechanisms are described in earlier reports.17
2.4 Rheological measurements
In these measurements, the total volume of the sample used, for kinetic measurements was doubled (i.e. 10 mL). Two different sets of desired samples were prepared: (i) constant volume of >0.03 M NaOH, 0.1 M Pip, 2 × 10⁻⁴ M PSH and 0.015 M CTABr at various [M2X] (within the range of 0.006 to 0.120 M); (ii) >0.03 M NaOH, 0.1 M Pip, 2 × 10⁻⁴ M PSH and [CTABr]T–[C16E20]T (with [CTABr]T = 0.015 M and [C16E20]T = 0.006 M) at various [M2X] (within the range of 0.006 to 0.120 M). The rheological measurements were conducted at 25 °C and 35 °C using an Anton Paar MCR301 rheometer, with a double gap cylinder (DG26.7/T200/SS having 26.661 mm external diameter and 24.656 mm internal diameter). The values of steady-shear viscosity (η), during the flow curve measurement, were obtained within the range of 0.010–1000 s−1 of shear rates. The details of the rheometric measurements were described in the previous study.18
3. Results
3.1 Effect of mixed CTABr–C16E20 on kobs for the piperidinolysis of PS− at various [NaBr] and 35 °C
Several kinetic runs were conducted to study the effects of mixed CTABr–C16E20 on kobs for the reaction of 0.10 M Pip, with 2 × 10⁻⁴ M PSH, in the presence of NaBr (within the concentration range from 0.00–0.700 M) and 0.030 M NaOH. These data were used to obtain parameters required to find the value of KBrX or RBrX. The experiments were carried out by adding three different [CTABr]T (=0.006, 0.010 and 0.015 M) at 0.006 M C16E20, 35 °C and 370 nm. Similar observations were obtained by increasing [C16E20] to 0.010 M and 0.015 M. The values of kobs, are presented in Tables 1–3.
Table 1 Pseudo first order rate constants (kobs) for the reaction of piperidine with anionic phenyl salicylate (PS−) at 0.006 M [CTABr]T in the presence of 0.006, 0.010, and 0.015 M [C16E20]T and different [MX] (=NaBr)a
| [MX]b, M |
[CTABr]Tc = 0.006 M |
0.006 M |
0.006 M |
| [C16E20]Td = 0.006 M |
0.010 M |
0.015 M |
| 104kobs, s−1 |
104kcalcd, s−1 |
104kobs, s−1 |
104kcalcd, s−1 |
104kobs, s−1 |
104kcalcd, s−1 |
| [PSH]0 = 0.2 mM, [Pip] = 0.1 M, [NaOH] = 0.03 M, λ = 370 nm and aqueous reaction mixture for each kinetic run contains 2% v/v acetonitrile. Total concentration of NaBr. Total concentration of CTABr. Total concentration of C16E20. Observed pseudo first order rate constant. Calculated pseudo first order rate constant. Error limits are standard deviations. |
| 0.00 |
25.3e ± 0.4 |
|
31.3 ± 0.5g |
|
30.1 ± 0.3 |
|
| 0.01 |
26.7 ± 0.7 |
25.0f |
39.3 ± 0.4 |
34.3 |
32.5 ± 0.3 |
32.5 |
| 0.03 |
33.0 ± 0.4 |
29.8 |
44.9 ± 0.4 |
39.7 |
38.1 ± 0.3 |
37.0 |
| 0.06 |
37.0 ± 0.4 |
36.1 |
51.6 ± 0.5 |
46.3 |
47.1 ± 0.5 |
42.9 |
| 0.10 |
40.0 ± 0.7 |
42.8 |
52.0 ± 0.4 |
53.2 |
48.2 ± 0.2 |
49.4 |
| 0.12 |
44.9 ± 0.6 |
45.7 |
54.9 ± 0.9 |
56.1 |
48.5 ± 0.7 |
52.3 |
| 0.15 |
48.9 ± 0.3 |
49.5 |
56.7 ± 0.4 |
59.9 |
54.2 ± 0.4 |
56.1 |
| 0.18 |
51.8 ± 0.5 |
52.9 |
61.1 ± 0.4 |
63.0 |
61.8 ± 0.4 |
59.5 |
| 0.20 |
54.8 ± 0.5 |
54.9 |
61.7 ± 0.5 |
64.9 |
62.2 ± 0.6 |
61.5 |
| 0.25 |
60.1 ± 0.8 |
59.2 |
64.2 ± 0.9 |
68.9 |
68.0 ± 0.4 |
66.0 |
| 0.30 |
65.3 ± 0.8 |
62.8 |
75.9 ± 0.6 |
72.2 |
69.9 ± 0.5 |
69.8 |
| 0.35 |
66.7 ± 0.8 |
65.8 |
77.5 ± 0.5 |
74.9 |
72.8 ± 0.8 |
73.0 |
| 0.40 |
67.8 ± 0.9 |
68.4 |
79.8 ± 1.0 |
77.1 |
73.0 ± 0.5 |
75.8 |
| 0.50 |
71.9 ± 0.7 |
72.5 |
81.9 ± 0.6 |
80.7 |
78.5 ± 1.0 |
80.4 |
| 0.60 |
76.1 ± 1.0 |
75.8 |
84.8 ± 0.9 |
83.4 |
89.1 ± 0.6 |
84.0 |
| 0.70 |
77.8 ± 1.0 |
78.3 |
82.5 ± 0.6 |
85.6 |
84.9 ± 0.7 |
86.9 |
Table 2 Pseudo first order rate constants (kobs) for the reaction of piperidine with anionic phenyl salicylate (PS−) at 0.010 M [CTABr]T in the presence of 0.006, 0.010 and 0.015 M [C16E20]T and different [MX] (=NaBr)a
| [MX]b, M |
[CTABr]Tc = 0.010 M |
0.010 M |
0.010 M |
| [C16E20]Td = 0.006 M |
0.010 M |
0.015 M |
| 104kobs, s−1 |
104kcalcd, s−1 |
104kobs, s−1 |
104kcalcd, s−1 |
104kobs, s−1 |
104kcalcd, s−1 |
| [PSH]0 = 0.2 mM, [Pip] = 0.1 M, [NaOH] = 0.03 M, λ = 370 nm and aqueous reaction mixture for each kinetic run contains 2% v/v acetonitrile. Total concentration of NaBr. Total concentration of CTABr. Total concentration of C16E20. Observed pseudo first order rate constant. Calculated pseudo first order rate constant. Error limits are standard deviations. |
| 0.00 |
23.0e ± 0.4 |
|
17.5 ± 0.4g |
|
28.7 ± 0.3 |
|
| 0.01 |
24.2 ± 0.4 |
24.0f |
18.1 ± 0.7 |
18.0 |
29.4 ± 0.2 |
29.0 |
| 0.03 |
26.3 ± 0.6 |
26.5 |
20.1 ± 0.3 |
20.4 |
30.8 ± 0.4 |
31.1 |
| 0.06 |
29.8 ± 0.5 |
29.8 |
22.8 ± 0.6 |
23.4 |
34.0 ± 0.4 |
34.0 |
| 0.10 |
33.4 ± 0.4 |
33.3 |
26.8 ± 0.4 |
26.6 |
26.8 ± 0.4 |
37.6 |
| 0.12 |
34.7 ± 0.5 |
34.9 |
28.4 ± 0.3 |
27.9 |
38.1 ± 0.3 |
39.2 |
| 0.15 |
36.5 ± 0.5 |
37.0 |
30.3 ± 0.5 |
29.7 |
38.8 ± 0.5 |
41.4 |
| 0.18 |
38.8 ± 0.5 |
38.8 |
30.9 ± 0.6 |
31.2 |
41.3 ± 0.4 |
43.4 |
| 0.20 |
39.9 ± 0.4 |
39.8 |
31.7 ± 0.3 |
32.1 |
44.6 ± 0.4 |
44.6 |
| 0.25 |
42.1 ± 0.5 |
42.2 |
33.6 ± 0.4 |
34.1 |
48.2 ± 0.3 |
47.5 |
| 0.30 |
44.6 ± 0.4 |
44.2 |
35.6 ± 0.6 |
35.7 |
49.5 ± 0.3 |
50.0 |
| 0.35 |
46.4 ± 0.5 |
45.8 |
37.3 ± 0.5 |
37.5 |
51.6 ± 0.5 |
52.2 |
| 0.40 |
47.0 ± 0.5 |
47.3 |
37.7 ± 0.4 |
38.2 |
54.4 ± 0.3 |
54.2 |
| 0.50 |
50.4 ± 0.5 |
49.6 |
40.4 ± 0.4 |
40.0 |
57.7 ± 0.4 |
57.6 |
| 0.60 |
50.8 ± 0.7 |
51.4 |
41.4 ± 0.4 |
41.4 |
59.5 ± 0.5 |
60.4 |
| 0.70 |
52.5 ± 0.6 |
52.9 |
43.3 ± 0.5 |
44.6 |
62.6 ± 0.2 |
62.8 |
Table 3 Pseudo first order rate constants (kobs) for the reaction of piperidine with anionic phenyl salicylate (PS−) at 0.015 M [CTABr]T in the presence of 0.006, 0.010 and 0.015 M [C16E20]T and different [MX] (=NaBr)a
| [MX]b, M |
[CTABr]Tc = 0.015 M |
0.015 M |
0.015 M |
| [C16E20]Td = 0.006 M |
0.010 M |
0.015 M |
| 104kobs, s−1 |
104kcalcd, s−1 |
104kobs, s−1 |
104kcalcd, s−1 |
104kobs, s−1 |
104kcalcd, s−1 |
| [PSH]0 = 0.2 mM, [Pip] = 0.1 M, [NaOH] = 0.03 M, λ = 370 nm and aqueous reaction mixture for each kinetic run contains 2% v/v acetonitrile. Total concentration of NaBr. Total concentration of CTABr. Total concentration of C16E20. Observed pseudo first order rate constant. Calculated pseudo first order rate constant. Error limits are standard deviations. |
| 0.00 |
21.8e ± 0.3 |
|
17.9 ± 0.4g |
|
23.22 ± 0.4 |
|
| 0.01 |
22.4 ± 0.4 |
22.0f |
18.4 ± 0.5 |
18.0 |
24.18 ± 0.4 |
23.0 |
| 0.03 |
23.9 ± 0.4 |
23.9 |
20.1 ± 0.5 |
19.4 |
24.69 ± 0.4 |
24.8 |
| 0.06 |
26.1 ± 0.3 |
26.2 |
20.8 ± 0.6 |
21.4 |
27.32 ± 0.4 |
27.1 |
| 0.10 |
28.8 ± 0.4 |
28.7 |
23.8 ± 0.5 |
23.6 |
29.30 ± 0.3 |
29.7 |
| 0.12 |
30.3 ± 0.2 |
29.7 |
24.9 ± 0.5 |
24.6 |
29.94 ± 0.3 |
30.9 |
| 0.15 |
30.9 ± 0.3 |
31.1 |
26.3 ± 0.6 |
26.0 |
32.37 ± 0.3 |
32.5 |
| 0.18 |
31.8 ± 0.3 |
32.3 |
26.8 ± 0.7 |
27.3 |
33.82 ± 0.3 |
33.9 |
| 0.20 |
33.1 ± 0.6 |
33.0 |
28.2 ± 0.4 |
28.1 |
34.55 ± 0.2 |
34.7 |
| 0.25 |
34.2 ± 0.6 |
34.5 |
29.1 ± 0.5 |
29.9 |
37.04 ± 0.2 |
36.7 |
| 0.30 |
35.7 ± 0.8 |
35.8 |
30.5 ± 0.5 |
31.4 |
39.14 ± 0.3 |
38.3 |
| 0.35 |
37.3 ± 0.6 |
36.8 |
33.2 ± 0.4 |
32.8 |
39.92 ± 0.3 |
39.7 |
| 0.40 |
38.5 ± 0.6 |
37.7 |
34.1 ± 0.2 |
34.0 |
40.71 ± 0.4 |
40.9 |
| 0.50 |
38.9 ± 0.7 |
39.1 |
35.8 ± 0.3 |
36.1 |
42.56 ± 0.5 |
43.0 |
| 0.60 |
39.5 ± 0.8 |
40.2 |
37.9 ± 0.6 |
37.7 |
44.61 ± 0.3 |
44.6 |
| 0.70 |
40.7 ± 0.8 |
41.0 |
38.8 ± 0.5 |
39.1 |
44.54 ± 0.3 |
45.9 |
3.2 Effect of [2-NaOC6H4CO2Na] on kobs for the piperidinolysis of PS− at constant concentration of CTABr and 35 °C
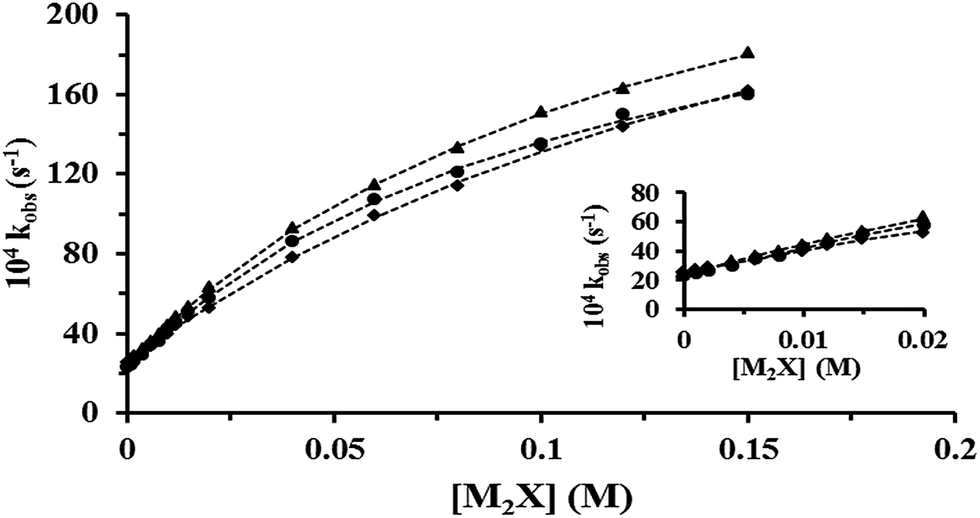
Several kinetic experiments were conducted at 0.006 M [CTABr], 0.1 M Pip, 2 × 10⁻⁴ M PSH, >0.03 M NaOH and various [2-NaOC6H4CO2Na] (0.00–0.14 M). Complementary results were found by increasing the concentration of CTABr to 0.010 M and 0.015 M. The values of kobs obtained within the [2-NaOC6H4CO2Na] range are presented graphically in Fig. 1.
 |
| | Fig. 1 Plot of kobs against [2-NaOC6H4CO2Na] for the piperidinolysis of PS− at 35 °C in the presence of [CTABr]T/M = 0.006 (●), 0.010 (♦) and 0.015 (▲). The broken curves are sketched via the calculated values of the rate constant (kcalcd). Inset: the plot at magnified scale for the data points at lower values of [M2X]. | |
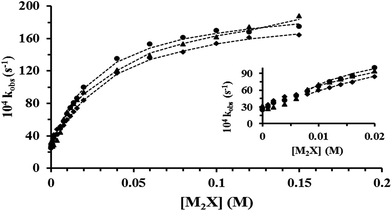
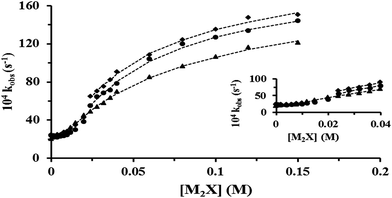
3.3 Effect of mixed CTABr–C16E20 on kobs for piperidinolysis of PS− at various [2-NaOC6H4CO2Na] and 35 °C
In order to study the influence of mixed CTABr–C16E20 micelles ([CTABr]T = 0.006, 0.010 and 0.015 M + 0.006 M [C16E20]) on the reaction between Pip, PS− and NaOH, different kinetic experiments were conducted in the presence of [2-NaOC6H4CO2Na] (0.00–0.15 M). Similar results were obtained by increasing [C16E20]T to 0.010 M and 0.015 M. The values of kobs, are outlined and presented in Fig. 2–4, respectively.
 |
| | Fig. 2 Plot of kobs against [2-NaOC6H4CO2Na] for the piperidinolysis of PS− at [CTABr]T + [C16E20]T/M = 0.006 + 0.006 (●), 0.006 + 0.010 (♦) and 0.006 + 0.015 (▲) and 35 °C. Broken curves represent the calculated values of the rate constant (kcalcd). Inset: the enlarged plot for the concentrations of M2X at lower values. | |
 |
| | Fig. 3 Plot of kobs against [2-NaOC6H4CO2Na] for the piperidinolysis of PS− at [CTABr]T + [C16E20]T/M = 0.010 + 0.006 (●), 0.010 + 0.010 (♦) and 0.010 + 0.015 (▲) and 35 °C. The broken curves are sketched via the calculated values of the rate constant (kcalcd). Inset: the enlarged plot for the concentrations of M2X at lower values. | |
 |
| | Fig. 4 Plot of kobs against [2-NaOC6H4CO2Na] for the piperidinolysis of PS− at [CTABr]T + [C16E20]T/M = 0.015 + 0.006 (●), 0.015 + 0.010 (♦) and 0.015 + 0.015 (▲) and 35 °C. The broken curves are sketched via the calculated values of the rate constant (kcalcd). Inset: the enlarged plot for the concentrations of M2X at lower values. | |
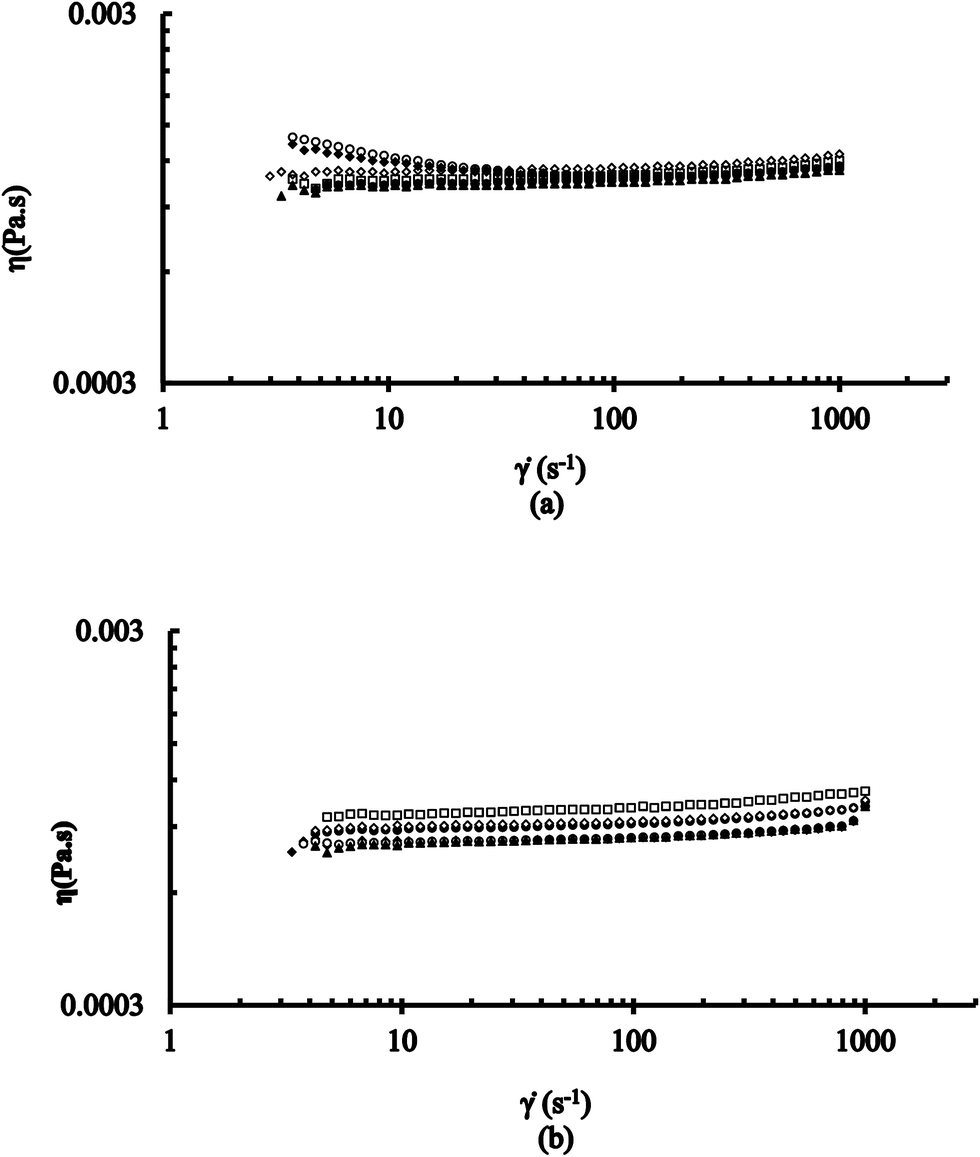
3.4 Rheological behavior of aqueous pure CTABr and mixed CTABr–C16E20 micelles in the presence of various [2-NaOC6H4CO2Na] at 25 and 35 °C
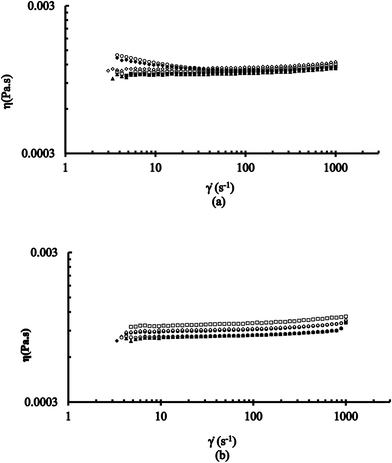
Rheological measurements of solutions (in aqueous form) containing 0.015 M [CTABr]T, constant 0.1 M Pip, 2 × 10⁻⁴ M PSH and >0.03 M NaOH at different values of [2-NaOC6H4CO2Na] were conducted at the steady-shear rheological response at 25 °C and 35 °C. The values of shear viscosity (η) at various shear rates (![[small gamma, Greek, dot above]](https://www.rsc.org/images/entities/i_char_e0a2.gif) ) were determined at this condition. These results are presented, using log–log plots of η vs. at various [2-NaOC6H4CO2Na], in Fig. 5a and b at 25 °C and 35 °C, respectively. Measurements on aqueous solutions containing mixed 0.015 M [CTABr]T and 0.006 M [C16E20]T with other conditions similar to those mentioned above were also conducted. The values of η at various were also determined. Different observations were obtained at the two different temperatures (25 °C and 35 °C) and the results are presented in Fig. 6a and b.
) were determined at this condition. These results are presented, using log–log plots of η vs. at various [2-NaOC6H4CO2Na], in Fig. 5a and b at 25 °C and 35 °C, respectively. Measurements on aqueous solutions containing mixed 0.015 M [CTABr]T and 0.006 M [C16E20]T with other conditions similar to those mentioned above were also conducted. The values of η at various were also determined. Different observations were obtained at the two different temperatures (25 °C and 35 °C) and the results are presented in Fig. 6a and b.
 |
| | Fig. 5 Graphs of shear viscosity (η) against shear rates () for the piperidinolysis of PS− containing 0.015 M [CTABr]T and [2-NaOC6H4CO2Na]/M = (a) 0.006 (●), 0.008 (□), 0.012 (▲), 0.020 (♦), 0.040 (○), 0.08 (◊), and 0.120 (■) at 25 °C and (b) 0.006 (●), 0.008 (□), 0.012 (▲), 0.020 (♦), 0.040 (○), 0.08 (◊), and 0.120 (■) at 35 °C. | |
 |
| | Fig. 6 Plots of shear viscosity (η) against shear rate () for the piperidinolysis of PS− containing 0.015 M [CTABr]T, 0.006 M [C16E20]T and [2-NaOC6H4CO2Na]/M = (a) 0.006 (♦), 0.008 (○), 0.0120 (▲), 0.020 (●), 0.040 (□), and 0.120 (◊), at 25 °C and (b) 0.006 (♦), 0.008 (○), 0.0120 (▲), 0.020 (●), 0.040 (□), and 0.120 (◊) at 35 °C. | |
4. Discussion
4.1 Explanation of kinetic observations for the piperidinolysis of PS− in the presence of pure CTABr and mixed CTABr–C16E20 micelles at various [MX] or [M2X] and 35 °C
The pseudophase micellar model has been used to explain the values of kobs for the nucleophilic reaction of Pip and PS− in an alkaline medium at 35 °C.16 The values of kobs obtained in the presence of a constant concentration of pure CTABr at various [M2X] (where M2X = NaOC6H4CO2Na) were related by eqn (3)19
or| |
 | (3) |
where k0 stands for kobs in the absence of MX or M2X with [MX]op0 or [M2X]op0 ≈ 0, respectively, θ and KX/S representing empirical constants whose values were calculated from eqn (3) using the nonlinear least-squares relationship by considering k0 to have a known value. Different k0 (=kobs at [MX] or M2X = 0) values were determined by conducting kinetic experiments at typical [CTABr]T as well as [CTABr]T + [C16E20]T and their values are shown in Tables 1–3. The values of kobs obtained in the presence of mixed CTABr–C16E20 micelles within the concentration range of 0.006–0.015 M [C16E20] surfactants were also found to fit to eqn (3). The values of fraction of micellized S ion moved from the CTABr micellar phase to the aqueous phase, through the occurrence of ion exchange S−/PS−, is denoted as FX/S. The relationship between θ and −FX/S is expressed in eqn (4).where kWobs = kobs (=knW[Pip]T) at different [C16E20]T (=0.006, 0.010 and 0.015 M) and [MX] = [M2X] = [CTABr] = 0. The values of KX/S, presented in Tables 4–6, at various concentrations of pure CTABr micelles as well as mixed CTABr–C16E20 micelles, were determined by the use of eqn (3).20 The values of KX/S, obtained for pure CTABr micelles (Table 5), were calculated from eqn (5) with the value of K0S as 7000 M−1 obtained from the literature.20| | |
KX/S = KX/S(1 + K0S[CTABr]T)
| (5) |
Table 4 Values of empirical constants mθ, mFX/S and mKX/S calculated from eqn (3) and (4) for MX = NaBr at different concentrations of mixed CTABr–C16E20a
| [CTABr]T, M |
[C16E20]T, M |
104k0d, s−1 |
103mθ, s−1 |
mKX/S, M−1 |
mFX/S |
nmKX/S, M−1 |
| [PSH]0 = 0.2 mM, [NaOH] = 0.03 M, [Pip] = 0.1 M, λ = 370 nm and aqueous reaction mixture for each kinetic run contains 2% v/v acetonitrile. Total concentration of CTABr. Total concentration of C16E20. k0 = kobs at [MX] = 0. Error limits are standard deviations. mFX/S = mθ/mkWobs; with mkWobs = kobs (=knW[Pip]T) = 240 × 10−4, 193.2 × 10⁻⁴ and 184.2 × 10⁻⁴ s−1 at constant [C16E20]T (0.006, 0.010 and 0.015 M [C16E20]T respectively) and [MX] = [CTABr]T = 0. nmKX/S = mFX/SmKX/S. |
| 0.006b |
0.006c |
25.3 ± 0.4 |
10.1 ± 0.3e |
3.4 ± 0.3 |
0.4f |
1.4g |
| 0.006 |
0.010 |
31.3 ± 0.5 |
10.3 ± 0.9 |
4.4 ± 0.8 |
0.5 |
2.2 |
| 0.006 |
0.015 |
30.1 ± 0.3 |
11.4 ± 0.6 |
3.0 ± 0.4 |
0.6 |
1.8 |
| 0.010 |
0.006 |
23.0 ± 0.4 |
6.6 ± 0.1 |
3.2 ± 0.1 |
0.3 |
1.0 |
| 0.010 |
0.010 |
17.5 ± 0.4 |
5.2 ± 0.6 |
3.7 ± 0.1 |
0.3 |
1.1 |
| 0.010 |
0.015 |
28.7 ± 0.3 |
8.5 ± 0.1 |
1.8 ± 0.7 |
0.5 |
0.9 |
| 0.015 |
0.006 |
21.8 ± 0.3 |
4.8 ± 0.1 |
3.8 ± 0.2 |
0.2 |
0.8 |
| 0.015 |
0.010 |
17.9 ± 0.4 |
5.4 ± 0.1 |
2.1 ± 0.1 |
0.3 |
0.6 |
| 0.015 |
0.015 |
23.2 ± 0.4 |
5.9 ± 0.2 |
2.6 ± 0.2 |
0.3 |
0.8 |
Table 5 Values of empirical constants, θ, FX/S and KX/S obtained using eqn (3) and (4) with the [M2X]op0 values for M2X = 2-NaOC6H4CO2Na at different [CTABr]Ta
| [CTABr]T, M |
104k0c, s−1 |
[M2X]op0, M |
103θ, s−1 |
KX/S, M−1 |
KX/S, M−1 |
FX/S |
KnX/S, M−1 |
KBrX |
| [PSH]0 = 0.2 mM, [NaOH] > 0.03 M, [Pip] = 0.1 M, λ = 370 nm and aqueous reaction mixture for each kinetic run contains 2% v/v acetonitrile. Total concentration of CTABr. k0 = kobs at [M2X] = 0. Error limits are standard deviations. KX/S = KX/S(1 + K0S[CTABr]T), where K0S = 7 × 10³ M−1. FX/S = θ/(knW[Pip]T), where knW = kobs at [CTABr]T = [C16E20]T = 0 and [Pip]T = 0.1 M and the values of knW, under such conditions is 0.322 s−1. KnX/S = FX/SKX/S. KBrX = KnX/S/KnBr/S, where KnBr/S = 25 M−1. |
| 0.006b |
23.0 ± 0.2 |
0.007 |
23.1 ± 0.1d |
39.4 ± 5.6 |
1694.2e |
0.72f |
1219.8g |
48.8h |
| 0.010 |
21.2 ± 0.4 |
0.011 |
19.4 ± 0.6 |
26.4 ± 2.4 |
1874.4 |
0.60 |
1124.6 |
45.0 |
| 0.015 |
16.4 ± 0.4 |
0.016 |
19.6 ± 0.4 |
13.0 ± 0.6 |
1378.0 |
0.60 |
0826.8 |
33.1 |
Table 6 Values of empirical constants, mθ, mFX/S and mKX/S calculated from eqn (3) and (4) with the [M2X]op0 values for M2X = 2-NaOC6H4CO2Na at different concentrations of mixed CTABr–C16E20a
| [CTABr]T, M |
[C16E20]T, M |
104k0d, s−1 |
[M2X]op0, M |
103mθ, s−1 |
mKX/S, M−1 |
mFX/S |
nmKX/S, M−1 |
nmKBr/S, M−1 |
mRBrX |
| [PSH]0 = 0.2 mM, [NaOH] > 0.03 M, [Pip] = 0.1 M, λ = 370 nm and aqueous reaction mixture for each kinetic run contains 2% v/v acetonitrile. Total concentration of CTABr. Total concentration of C16E20. k0 = kobs at [MX] = 0. Error limits are standard deviations. FX/S = θ/(knW[Pip]T), where knW = kobs at [CTABr]T = [C16E20]T = 0 and [Pip]T = 0.1 M and the values of knW, under such conditions is 0.322 s−1. nmKX/S = mFX/SmKX/S. nmKBr/S = mFBr/SmKBr/S (for MX = NaBr). mRBrX = nmKX/S/nmKBr/S. |
| 0.006b |
0.006c |
24.7 ± 0.5 |
0.00028 |
20.8 ± 0.4e |
34.8 ± 2.2 |
0.87f |
30.3g |
1.4h |
21.6i |
| 0.006 |
0.010 |
27.2 ± 0.5 |
0.00201 |
19.9 ± 0.2 |
28.1 ± 0.9 |
1.03 |
28.9 |
2.2 |
13.1 |
| 0.006 |
0.015 |
14.1 ± 0.1 |
0.00000 |
21.7 ± 0.5 |
24.6 ± 1.5 |
1.18 |
29.9 |
1.8 |
16.6 |
| 0.010 |
0.006 |
22.9 ± 0.8 |
0.00000 |
26.5 ± 0.5 |
8.82 ± 0.4 |
1.10 |
09.7 |
1.0 |
09.7 |
| 0.010 |
0.010 |
25.3 ± 0.4 |
0.00006 |
35.0 ± 1.1 |
4.87 ± 0.2 |
1.82 |
08.9 |
1.1 |
08.1 |
| 0.010 |
0.015 |
25.3 ± 0.5 |
0.00047 |
32.3 ± 0.5 |
7.26 ± 0.2 |
1.75 |
12.7 |
0.9 |
14.1 |
| 0.015 |
0.006 |
23.6 ± 0.2 |
0.01085 |
19.6 ± 0.4 |
16.8 ± 0.8 |
0.82 |
13.8 |
0.8 |
17.3 |
| 0.015 |
0.010 |
24.5 ± 0.3 |
0.00768 |
20.6 ± 0.4 |
16.8 ± 0.9 |
0.86 |
14.5 |
0.6 |
24.2 |
| 0.015 |
0.015 |
19.9 ± 0.4 |
0.00560 |
18.0 ± 0.4 |
12.4 ± 0.6 |
0.98 |
12.2 |
0.8 |
15.3 |
The results, at various constant concentrations of pure CTABr, and mixed CTABr–C16E20, in the presence of different [MX] and [M2X], (MX = NaBr and M2X = NaOC6H4CO2Na) are presented in Tables 4–6. Symbolic modification of parameters was done to differentiate between those obtained in the presence of pure micelles and mixed micelles. Therefore, k0, kWobs, θ, KX/S, KX/S, K0S, FX/S and KnX/S are considered as mk0, mkWobs, mθ, mKX/S, mKX/S, mKS, mFX/S and mKnX/S, respectively. The small letters “m” (superscripts) were used to imply that the parameters are obtained in the mixed micellar solutions throughout the text.
The hydrophilic parts of CTABr in CTABr–C16E20 surfactants mixture are covered within the larger sized hydrophilic C16E20 micellar parts of the same mixed surfactants.21 Thus, it appears acceptable that the combination of ionic surfactants (CnIm) and nonionic ones (CnEm) with n ≤ m is related to incomplete dehydration of the hydrophilic part of CnIm (comprising the outermost portion of headgroups), which causes the ion exchange, leading to changes in structure of micelles from spherical to wormlike.22
It is also clearly demonstrated from eqn (5) that as the concentration of pure CTABr increases, the values of KX/S decrease provided the values of KX/S are independent of [CTABr]T. This prediction coincides well with what is presented in Table 5 (the values of KX/S = 39, 26 and 13 for 0.006, 0.010 and 0.015 M [CTABr]T, respectively).
The optimum values of [2-NaOC6H4CO2Na], ([M2X]op0), for the mixed CTABr–C16E20 micelles (Table 6) decreased compared to that of the pure CTABr (Table 5). However, the values of parameters k0, θ and KX/S remain independent of whether the micellar system is pure or mixed and it was observed that the lowest value of the concentration of CTABr is more than 20-fold larger than the corresponding value of [M2X]op0 in the presence of 0.006 M C16E20. The values of FX/S are also independent of the [CTABr]T and mixed [CTABr]T–[C16E20]T. However, these values increased in the mixed CTABr–C16E20 micellar system (Table 6) compared to the pure one (Table 5). The value of ion-exchange constant, KBrX or RBrX, is empirically related to the normalized values of KX/S (KnX/S = FX/SKX/S) and KBr/S (KnBr/S = FBr/SKBr/S).17
| | |
KBrX = KX/KBr = KnX/S/KnBr/S
| (6) |
The values of KX/S were calculated using eqn (5) for M2X (=2-NaOC6H4CO2Na) with K0S = 7000 M−1.
The value of KnX/S and the proclaimed value of KnBr/S (=25 M−1)17 give the values of KBrX = 48.8, 45.0 and 33.1 at [CTABr]T = 0.006, 0.010 and 0.015 M, respectively (Table 5). These results are similar to the one presented in the previous study (=44).19
However, eqn (6) holds only if the values of KnX/S and KnBr/S are determined in micelles with the same structural behavior. Contrarily, if the micellar structures are different, then KX/KBr refers to RBrX with the relationship in eqn (7)
where
nmKX/S =
mFX/SmKX/S (for M
2X = 2-NaOC
6H
4CO
2Na) and
nKBr/S =
mFmX/SKBr/S (for MX = NaBr). The conditions to use either of the relationships (
eqn (6) and
(7)) have been reported in detail elsewhere.
19
It can be easily shown, in view of eqn (5), that
| | |
mKnX/S = nmKX/S(1 + mK0S[CTABr]T)
| (8) |
and
| | |
mKnBr/S = nmKBr/S(1 + mK0S[CTABr]T)
| (9) |
Eqn (8) and (9) give eqn (7).
The presence of mixed CTABr–C16E20 micelles revealed the increase in the values of FX/S for M2X = 2-NaOC6H4CO2Na (Table 5). This is in contrast with the reported study, and could be due to the fact that the concentrations of C16E20 (0.006, 0.010 and 0.015 M) used in the present study are lower than that of the reported one (0.05 M).19 The results show that the values of KX/KS for mixed CTABr–C16E20 micelles are higher than that of pure CTABr. The corresponding values of KX/S could not be calculated because their K0S values for mixed CTABr–C16E20 micelles are not available.
4.2 Explanation of rheological measurements for the piperidinolysis of PS− in the presence of pure CTABr and mixed CTABr–C16E20 micelles at various [M2X]
In the presence of pure CTABr micelles, all flow curves in Fig. 5a and b, at 0.012 M 2-NaOC6H4CO2Na at both 25 °C and 35 °C, show the Newtonian fluid behavior at their beginning (except at 0.006 and 0.008 M 2-NaOC6H4CO2Na) and show the shear thinning behavior at the end. This behavior of CTABr surfactant, with a constant concentration in the presence of different [2-NaOC6H4CO2Na], indicates the presence of elongated micelles.23,24 As the [2-NaOC6H4CO2Na] increases from 0.006 to 0.012 M, the values of critical shear rate γcr decrease and also shift to lower values with increase in zero shear viscosity, η0. However, further increase in [2-NaOC6H4CO2Na] (0.02–0.12 M) increases the values of γcr with decrease in η0. It implies, therefore, the CTABr micellar structure is getting networked to a greater extent and lesser degrees at >0.008 to 0.012 M and 0.02 to 0.12 M ranges of 2-NaOC6H4CO2Na, respectively. This is a typical rheological behavior of wormlike micelles.18
Almost all of the flow curves in Fig. 6a and b (0.006–0.12 M 2-NaOC6H4CO2Na) at 25 °C and 35 °C, in the presence of mixed CTABr–C16E20 (with fixed concentration of both CTABr and C16E20), show Newtonian fluid systems, but increase in the value of η0 is observed within the range from 0.012 to 0.12 M [2-NaOC6H4CO2Na]. This behavior might be linked to the presence of the C16E20 surfactant's branched structure.25
The graph of η0 at against [2-NaOC6H4CO2Na] at two temperatures (25 °C and 35 °C) is shown in Fig. 7. Typical single asymmetrical maxima of the graph at [CTABr]T = 0.015 M, [C16E20]T = 0 and 25 °C and 35 °C (□ and ◊, respectively) were obtained at the same value of [2-NaOC6H4CO2Na]sp (=0.02 M, specific concentration of 2-NaOC6H4CO2Na). The values of [2-NaOC6H4CO2Na]sp at which the maximum viscosity was reached at a constant shear rate remained the same at both the temperatures. This observation agreed with previous studies that the maxima obtained for a solution of cationic surfactant, for instance CTABr, at fixed concentration and various [M2X] (where M2X stands for salt with counterion behavior) reveals the existence of wormlike micelles.
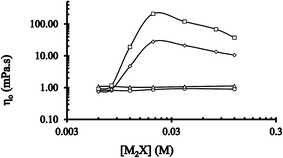 |
| | Fig. 7 Graph of zero shear viscosity (η0) at constant shear rate () against [2-NaOC6H4CO2Na] with 0.015 M CTABr in absence of C16E20 at 25 °C (□) and 35 °C (◊), and in the presence of 0.006 M C16E20 at 25 °C (△) and 35 °C (○). M2X = 2-NaOC6H4CO2Na. | |
However, no maxima of the graph were obtained at the two different temperatures (△ and ○ respectively) and the same concentration of CTABr in the presence of C16E20. Thus, no significant differences in η0 values were obtained at various [2-NaOC6H4CO2Na]sp.
5. Conclusions
It is known from the literature that the CTABr micellar binding constant of phenyl salicylate ion is nearly 100-fold larger in the presence of CTABr micelles compared to that in the presence of C16E20.14 It is now common belief that the viscoelastic behavior of aqueous CTABr micellar solution containing sodium salicylate is caused by the strong CTABr micellar binding of sodium salicylate. However such perception has never been supported by quantitative determination of such binding constants. The new and interesting finding described in this manuscript is that CTABr/M2X/H2O micellar solution (with RBrX ≈ 42) contains wormlike micelles, whereas CTABr/M2X/C16E20/H2O micellar solution (with KBrX ≈ 16) contains spherical micelles, with M2X = disodium salicylate. This is a quantitative correlation between the magnitude of counterion (X) binding constant with CTABr (RBrX) and X-induced CTABr micellar growth. It is also important to note that the structural feature, as well as the viscosity of CTABr/M2X/C16E20/H2O micellar solutions, can be manipulated by simply changing the concentration of C16E20.
Acknowledgements
The authors acknowledge the financial support of this research from University of Malaya (UM) and Ministry of Higher Education (MOHE), Malaysia, under the UM.C/HIR/MOHE/SC/07 and RG022/09AFR grants.
References
- J. Fendler, Catalysis in micellar and macromolecular systems, Elsevier, 2012 Search PubMed.
- C. D. Eads and L. C. Robosky, Langmuir, 1999, 15, 2661–2668 CrossRef CAS.
- E. Junquera and E. Aicart, Langmuir, 2002, 18, 9250–9258 CrossRef CAS.
- M. Muñoz, A. Rodríguez, M. Del Mar Graciani and M. Luisa Moyá, Int. J. Chem. Kinet., 2002, 34, 445–451 CrossRef.
- L. Zakharova, F. Valeeva, A. Zakharov, A. Ibragimova, L. Kudryavtseva and H. Harlampidi, J. Colloid Interface Sci., 2003, 263, 597–605 CrossRef CAS PubMed.
- B. S. Lee and F. Nome, Langmuir, 2000, 16, 10131–10136 CrossRef CAS.
- V. L. Frescura, D. M. Marconi, D. Zanette, F. Nome, A. Blasko and C. A. Bunton, J. Phys. Chem., 1995, 99, 11494–11500 CrossRef CAS.
- C. A. Bunton and G. Savelli, Adv. Phys. Org. Chem., 1987, 22, 213–309 CrossRef.
- J. W. Larsen and L. B. Tepley, J. Colloid Interface Sci., 1974, 49, 113–118 CrossRef CAS.
- P. Vangeyte, B. Leyh, L. Auvray, J. Grandjean, A.-M. Misselyn-Bauduin and R. Jérôme, Langmuir, 2004, 20, 9019–9028 CrossRef CAS PubMed.
- M. Niyaz Khan and E. Ismail, J. Mol. Liq., 2003, 107, 277–287 CrossRef CAS.
- M. N. Khan and C. T. Fui, J. Mol. Liq., 2009, 147, 170–177 CrossRef.
- U. Rao, C. Manohar, B. Valaulikar and R. Iyer, J. Phys. Chem., 1987, 91, 3286–3291 CrossRef CAS.
- M. N. Khan and E. Ismail, J. Phys. Org. Chem., 2004, 17, 376–386 CrossRef CAS.
- M. N. Khan and E. Ismail, Int. J. Chem. Kinet., 2001, 33, 288–294 CrossRef CAS.
- M. Khan and S. Sinasamy, Int. J. Chem. Kinet., 2011, 43, 9–20 CrossRef CAS and the references cited therein.
- M. N. Khan, Adv. Colloid Interface Sci., 2010, 159, 160–179 CrossRef CAS PubMed.
- N. S. M. Yusof, N. A. Razak and M. N. Khan, J. Oleo Sci., 2013, 62, 257–269 CrossRef CAS PubMed.
- M. N. Khan, E. Ismail and N. S. M. Yusof, Colloids Surf., A, 2010, 361, 150–161 CrossRef CAS.
- M. N. Khan and Z. Arifin, J. Colloid Interface Sci., 1996, 180, 9–14 CrossRef CAS.
- H.-C. Gao, S. Zhao, S.-Z. Mao, H.-Z. Yuan, J.-Y. Yu, L.-F. Shen and Y.-R. Du, J. Colloid Interface Sci., 2002, 249, 200–208 CrossRef CAS PubMed.
- Y. Geng, L. S. Romsted and F. Menger, J. Am. Chem. Soc., 2006, 128, 492–501 CrossRef CAS PubMed.
- Y. Qiao, Y. Lin, Y. Wang, Z. Li and J. Huang, Langmuir, 2011, 27, 1718–1723 CrossRef CAS PubMed.
- T. Lu, J. Huang, Z. Li, S. Jia and H. Fu, J. Phys. Chem. B, 2008, 112, 2909–2914 CrossRef CAS PubMed.
- M. Carver, T. Smith, J. Gee, A. Delichere, E. Caponetti and L. Magid, Langmuir, 1996, 12, 691–698 CrossRef CAS.
|
| This journal is © The Royal Society of Chemistry 2016 |
Click here to see how this site uses Cookies. View our privacy policy here.