
Phenylsulfonic acid functionalized carbon quantum dots based biosensor for acetylcholinesterase activity monitoring and inhibitor screening†
Fengqi Zhou‡
,
Hui Feng‡,
Yafen Fang,
Qian Sun and
Zhaosheng Qian *
*
College of Chemistry and Life Science, Zhejiang Normal University, Jinhua 321004, China. E-mail: qianzhaosheng@zjnu.cn
First published on 21st October 2016
Abstract
Phenylsulfonic acid functionalized carbon quantum dots (PSA-CQDs) were prepared and used to construct a convenient and reliable fluorometric biosensor for acetylcholinesterase (AChE) activity and inhibitor screening. Effective static quenching process occurred owing to the formation of nonfluorescent complex when copper(II) ions were added to PSA-CQDs, which results in its fluorescence quenching due to strong coordination of copper ions to sulfonic groups of PSA-CQDs. As a result, the fluorometric assay for AChE was established based on the stronger affinity between copper and thiocholine hydrolyzed from acetylthiocholine under the hydrolysis of AChE which can induce fluorescence recovery. Meanwhile, the inhibition effect of tacrine to AChE was assessed because its effective inhibition effect to AChE leads to the prevention of hydrolysis of acetylthiocholine and the following occurrence of PET process which causes the quenching of fluorescence. This detection method is convenient and efficient, which has high sensitivity with detection limit as low as 2.6 U L−1 and a broad linear scope ranging from 3.8 to 80.0 U L−1. This work proposed a competitive assay strategy among the sulfonic acid modified probe, copper cation and thiocholine to quantify AChE activity using functional carbon quantum dots, and can be utilized to design detection methods for other thiol-containing targets of interest.
Introduction
Acetylcholinesterase (AChE) is a key enzyme in the human central nervous system, which catalyzes the hydrolysis of acetylcholine (ACh) to choline to maintain the level of neurotransmitter acetylcholine.1 Researches have indicated that in the pathogenesis of Alzheimer's disease (AD), AChE plays an important role because hydrolytic decomposition of ACh in the nervous system by AChE can accelerate the assembly of amyloid β peptides into amyloid fibrils.2 As a result, fast and effective detection of AChE is important in diagnosis of Alzheimer's disease. On the other hand, AChE inhibitors had proven to be the principal drugs in the symptomatic treatment of Alzheimer's disease.3 Thus seeking the potential inhibitors and screening of their inhibition effect have great significance in the drug development for AD treatment. Due to the wide range fields of pharmaceutical and health care application, there is an urgent demand for convenient and sensitive methods for real-time AChE activity monitoring and AChE inhibitor screening.Several methods have been applied to the monitor the activity of AChE and to screen its potential inhibitors, such as colorimetric, electrochemical, interferometric, chemiluminometric, and fluorometric approaches.4 Among these methods, two traditional methods including colorimetric method by using Ellman's reagent5 and the detection of hydrogen peroxide produced by oxidation of the AChE-induced choline6–8 are widely applied in detection of AChE activity. However, both the two traditional methods have disadvantages owning to the facts that they lack sufficient sensitivity or require time-consuming procedures, and furthermore Ellman's reagent might result in false-positive effect. In order to enhance the sensitivity, many methods such as chemiluminometric or fluorometric approach based on organic compounds have been employed to establish assays of AChE activity and AChE inhibitors evaluation,9–12 which provide higher sensitivities and lower detection limits. However, dye molecules have their inherent disadvantages including rapid bleaching, insufficient emission intensities and instability. In recent years, several new fluorescent materials such as fluorescent conjugated polymers or proteins,13–15 inorganic quantum dots16,17 and noble metal nanoparticles18–22 have been developed and employed for AChE activity and inhibitor monitoring. Although these fluorescent materials with high fluorescence quantum yields, strong absorption and size-tunable emissions, have shown good performance in AChE activity monitoring, simple low-cost, label-free and sensitive assays for AChE activity and inhibitor monitoring in biological samples and for discovering new drugs are still in demand.
Carbon quantum dots (CQDs), as a kind of luminescent nanomaterial, have shown their distinctively optical properties and outstanding performance in photovoltaic devices, photocatalysis and bioimaging23–25 due to their outstanding advantages over organic dyes, semiconductor quantum dots and noble metal nanoclusters, such as stable light emitting, high quantum yield, good photostability, easy modulation, low toxicity and excellent biocompatibility. Recently, carbon quantum dots as an excellent fluorophore were utilized to design novel fluorescent chemo/biosensors in vitro and in vivo,26–28 and begun to be applied to the detection of enzymes activity evaluation.29–33
In this study, a fluorometric assay for acetylcholinesterase activity monitoring and inhibitors screening was developed based on a competitive interaction strategy among functionalized carbon quantum dots (CQDs), copper ion and thiocholine. Carbon quantum dots abundant in carboxyl group were used to prepare phenylsulfonic acid functionalized carbon quantum dots (PSA-CQDs). The phenylsulfonic acid groups on the surface of PSA-CQDs function as the functional unit to coordinate with metal ions. The fluorescence of PSA-CQDs was found to be quenched in the presence of copper ions (Cu2+) owing to the formation of nonfluorescent PSA-CQDs/Cu(II) complex. Acetylthiocholine (ATCh) was used as the substrate of AChE, and can be hydrolyzed to thiocholine under the catalysis of AChE. The generated thiocholine has stronger affinity to copper ion than phenylsulfate ion, and thus can bind to copper ion to form a more stable complex. As a result, the quenched fluorescence can be recovered in the presence of ATCh and AChE. By taking advantage of competitive strategy among copper ion, carboxyl group on the surface CQDs and thiocholine, and specific catalytic hydrolysis of ATCh into thiocholine by AChE, the fluorescent assay for AChE was established. Moreover, the function of inhibitors screening for AChE was further assessed using tacrine as an example.
Experimental
Materials and reagents
Triple-distilled water was used throughout the experimental process. Activated carbon, copper(II) nitrate (Cu(NO3)2), acetylthiocholine (ATCh), 4-amino-phenylsulfonic acid (APSA), and hexamethylenetetramine (HMT) were purchased from Aladdin Ltd. (Shanghai, China). Acetylcholinesterase (AChE, EC 3.1.1.7, 2 kU), alkaline phosphatase (ALP, EC 3.1.3.1) from bovine intestinal mucosa, acid phosphatase (ACP, EC 3.1.3.2) bovine serum albumin (BSA), and immuneglobulin G (IgG) were bought from Sigma-Aldrich (Shanghai, China). The concentration of hexamethylenetetramine buffer solution (HMT, pH 7.0) was 10.0 mM. All reagents were of analytical grade and without any further purification.Synthesis of phenylsulfonic acid functionalized carbon quantum dots (PSA-CQDs)
A brief procedure for synthesis of carbon quantum dots is described as follows: activated carbon (2.0 g) was added into a mixture of concentrated sulfuric acid (180 mL) and nitric acid (60 mL). The mixture was heated at 80 °C for 5 h. The mixture was cooled and diluted with deionized water (800 mL). The dark CQDs solution was neutralized with sodium hydroxide. The final product solution was dialyzed in a dialysis bag (1000 Da) for 3 days, and then the resultant solution was further treated with the dialysis bag (50![[thin space (1/6-em)]](https://www.rsc.org/images/entities/char_2009.gif) 000 Da) to remove large non-fluorescent materials.
000 Da) to remove large non-fluorescent materials.
The synthesis of PSA-CQDs was as follows: CQDs powder (0.05 g) was dissolved in deionized water (30 mL), and then a certain amount of EDC and NHS (0.5 g) were added to activate the carboxyl groups on the surface of CQDs for 1 h. An excessive amount of 4-amino-phenylsulfonic acid (0.5 g) was added to the preceding solution after the pH was adjusted to 7. This reaction would proceed for over 7 days at room temperature to obtain PSA-CQDs nanoprobe with excellent optical property. In order to accelerate the formation of amide bonds between CQDs and 4-amino-phenylsulfonic acid, the resulting solution was heated at 90 °C for 3 days. Finally, as-prepared PSA-CQDs nanoprobe was purified with microporous filter (0.22 μm) and a dialysis bag (1000 Da) for 48 h to remove molecular substance including 4-amino-phenylsulfonic acid, EDC and NHS. As-prepared PSA-CQDs nanoprobe was obtained and further used in the following detection.
Condition optimization for fluorescence quenching and recovery of PSA-CQDs
For optimization of incubation time for fluorescence quenching by copper(II) ions, 2.0 μL of copper(II) ion solution (10.0 mM) was added into 2.50 mL of PSA-CQDs solution (HMT, pH 7.0). Under the optimum incubation time, fluorescence quenching of PSA-CQDs was assessed with continuous addition of copper ions. The fluorescence intensity of the mixtures containing PSA-CQDs and varying amounts of Cu2+ was monitored using fluorescence spectrometer at the optimal excitation wavelength. For optimization of incubation time for catalytic hydrolysis of acetylthiocholine by AChE, 370.0 μL of acetylthiocholine (10.0 mM) and 15.0 μL of AChE (100.0 U mL−1) were incubated for 10, 20, 30, 40, 50, 60, 70 and 80 min respectively, and then mixed with PSA-CQDs/Cu(II) solution, and finally its fluorescence was recorded after 15 min of incubation time. For optimization of incubation time for fluorescence recovery by thiocholine generated from catalytic hydrolysis of acetylthiocholine by AChE, the fluorescence of PSA-CQDs was first quenched by adding 3.0 μL of copper(II) solution (10.0 mM) into 2.50 mL of PSA-CQDs solution (HMT, pH 7.0). Then, a certain amount of the mixture of ATCh and AChE which has been incubated for 1 h was introduced to the above mixture.Fluorescent AChE assay
For the AChE assay, different levels of AChE ranging from 0.0 to 200.0 U L−1 were added into the mixture containing 2.50 mL of PSA-CQDs solution (HMT, pH 7.0), Cu2+ (12.0 μM) and 370.0 μL of ATCh (10.0 mM), and then the fluorescence spectra of the mixture were recorded respectively after an incubation time of 10 min. Under the optimal conditions, the selectivity of the assay toward AChE was evaluated. Four biological species including bovine serum albumin (BSA), immune globulin G (IgG), acid phosphatase (ACP) and alkaline phosphatase (ALP) were selected to assess the selectivity of the sensing system to AChE. A certain amount of copper ion (5.0 μL, 10.0 mM) was first added into 2.5 mL of PSA-CQDs solution. The fluorescence of the resulting mixture was regarded as the blank. Then, each of the following species including AChE (15.0 μL, 100.0 U mL−1), BSA, ACP, IgG and ALP (15 μL, 100.0 U mL−1) was separately incubated with 370 μL of ATCh (10.0 mM) for 60 min, and then mixed with PSA-CQDs/Cu(II) solution. The resultant mixture was monitored by fluorescence spectroscopy at the excitation wavelength of 425 nm after 20 min incubation.Inhibitor screening
For tacrine, different concentrations of tacrine from 0.0 μM to 10.0 μM was added into the mixture containing 2.50 mL of PSA-CQDs solution (HMT, pH 7.0), Cu2+ (12.0 μM) and AChE (600.0 U L−1), incubating for 60 min. And then 370.0 μL of ATCh (1480.0 μM) was added into the system. After an incubation time of 20 min, the fluorescence spectra of the mixture were recorded respectively.Characterization methods
The morphologies of all samples were characterized by transmission electron microscopy (TEM), which was performed on a JEOL-2100F instrument with an accelerating voltage of 200 kV. The X-ray photoelectron spectroscopy analyses were conducted using a Kratos Axis ULT RAX-ray photoelectron spectrometer with a 165 nm hemispherical electron energy analyzer. The UV-vis spectra were recorded on a PerkinElmer Lambda 950 spectrometer. The photoluminescence spectra were conducted on a PerkinElmer LS-55 fluorescence spectrometer.Results and discussion
Principle of AChE activity monitoring and its inhibitor screening based on PSA-CQDs
Carbon quantum dots were synthesized using cheap activated carbon as raw materials through chemical oxidation approach according to our previous papers.31,32 4-Amino-phenylsulfonic acid was used to functionalized on the surface of carbon quantum dos to prepare PSA-CQDs nanoprobe. It is found that phenylsulfonic acid can coordinate to copper ions, and the complex between PSA-CQDs and Cu(II) possesses non-fluorescent nature due to static quenching mechanism, which is utilized to design the fluorescence turn-on assay for AChE activity. Acetylthiocholine (ATCh) was adapted as the substrate of AChE because it has been proved that ATCh can be effectively hydrolyzed to thiocholine and acetate under the catalysis of AChE.9,14 Scheme 1 shows the schematic illustration of detection strategy for AChE activity and its inhibitor screening on the basis of PSA-CQDs nanoprobe mediated by copper ion. PSA-CQDs nanoprobe exhibits strong green fluorescence, but the introduction of copper ion leads to severe fluorescence quenching due to the formation of non-fluorescent complex between PSA-CQDs and Cu(II). No change can be observed in the presence of mere ATCh in PSA-CQDs/Cu(II) complex solution. However, the introduction of both ATCh and AChE into the preceding solution brings about substantial fluorescence recovery, which is achieved by the fact that thiocholine generated from ATCh under catalytic hydrolysis of AChE takes copper ions away from PSA-CQDs/Cu(II) complex due to its stronger affinity to copper ion, and this competitive binding causes breakdown of PSA-CQDs/Cu(II) nanoassembly and resets CQDs in their free state. The enhanced fluorescence correlates to varying levels of AChE, and thus the assay for AChE level assessment can run in this way. When its inhibitor tacrine is present, AChE activity would be inhibited to loss its capability to catalytically hydrolyze ATCh into thiocholine, and consequently the fluorescence of the system remains quenched due to the absence of thiocholine. The inhibition effect of tacrine on AChE activity can be assessed by fluorescence quenching degree of the standard assay. | ||
| Scheme 1 Schematic illustration of detection strategy for AChE activity monitoring and its inhibitor screening based on a competitive strategy. | ||
Synthesis and characterization of PSA-CQDs nanoprobe
The synthesis and characterization of CQDs were reported in our previous paper.31,32 CQDs were prepared by means of chemical oxidation of activated carbon powder using concentrated sulfuric and nitric acids, and further purified by dialysis which retains CQDs in size from 1 kDa to 50 kDa. As-prepared CQDs act as the starting materials to synthesize the following nanoprobe. 4-Amino-phenylsulfonic acid was covalently linked to the surface of CQDs via EDC/NHS coupling reaction. PSA-CQDs nanoprobe shows bright green fluorescence under the UV lamp. TEM images in Fig. S1† indicate that PSA-CQDs nanoprobes have close size to CQDs in the range of 2–5 nm, and also same crystalline structure to CQDs. Comparison in XPS spectra between PSA-CQDs and CQDs in Fig. S2† illustrates that phenylsulfonic acid has covalently bonded to the surface of CQDs due to the new signals at 398.7 eV, 167.6 eV and 230.7 eV from N 1s, S 2p and S 2s for PSA-CQDs with respect to that of CQDs. High-resolution S 2p XSP spectrum in Fig. S2† further prove the appearance of S element in the nanoprobe. IR spectra of CQDs and PSA-CQDs in Fig. S3† showed four new absorption peaks at 2927.6 cm−1, 1603.9 cm−1, 1035.9 cm−1 and 696.6 cm−1 originated from vibrations of N–H bond, C![[double bond, length as m-dash]](https://www.rsc.org/images/entities/char_e001.gif) O bond, S–O bond, and benzene ring for PSA-CQDs with respect to that of CQDs, which further verifies the covalent linkage between phenylsulfonic acid and CQDs. Fig. 1A displays the fluorescence spectra of CQDs and PSA-CQDs nanoprobe, respectively. A fluorescence emission peak at 500 nm was recorded for PSA-CQDs nanoprobe when exited at the optimum wavelength of 425 nm, which is slightly blue-shifted with respect with that (525 nm) for CQDs. Fluorescence spectra in Fig. S4† indicate that emission wavelengths of PSA-CQDs nanoprobe almost barely change with the alteration of excitation wavelengths in the range of 395–465 nm, implying that PSA-CQDs nanoprobe has excitation-independent emission behavior. PSA-CQDs dispersion in water exhibits strong green fluorescence while CQDs solution displays a yellowish-green light under a UV lamp. The influence of pH values on the fluorescence of PSA-CQDs nanoprobe was shown in Fig. 1B. A slight change in intensity was observed at pH 5–9 while apparent quenching of the fluorescence is induced when the pH is lower than pH 3 or over pH 11, indicating that the fluorescence of PSA-CQDs would not be significantly impacted by pH values around 7. Time-resolved decay curve of PSA-CQDs was shown in Fig. S5.† The lifetime of PSA-CQDs nanoprobe was determined to be 4.4 ns, which is longer than that of CQDs (2.8 ns).
O bond, S–O bond, and benzene ring for PSA-CQDs with respect to that of CQDs, which further verifies the covalent linkage between phenylsulfonic acid and CQDs. Fig. 1A displays the fluorescence spectra of CQDs and PSA-CQDs nanoprobe, respectively. A fluorescence emission peak at 500 nm was recorded for PSA-CQDs nanoprobe when exited at the optimum wavelength of 425 nm, which is slightly blue-shifted with respect with that (525 nm) for CQDs. Fluorescence spectra in Fig. S4† indicate that emission wavelengths of PSA-CQDs nanoprobe almost barely change with the alteration of excitation wavelengths in the range of 395–465 nm, implying that PSA-CQDs nanoprobe has excitation-independent emission behavior. PSA-CQDs dispersion in water exhibits strong green fluorescence while CQDs solution displays a yellowish-green light under a UV lamp. The influence of pH values on the fluorescence of PSA-CQDs nanoprobe was shown in Fig. 1B. A slight change in intensity was observed at pH 5–9 while apparent quenching of the fluorescence is induced when the pH is lower than pH 3 or over pH 11, indicating that the fluorescence of PSA-CQDs would not be significantly impacted by pH values around 7. Time-resolved decay curve of PSA-CQDs was shown in Fig. S5.† The lifetime of PSA-CQDs nanoprobe was determined to be 4.4 ns, which is longer than that of CQDs (2.8 ns).
 | ||
| Fig. 1 (A) Fluorescence wavelength of emission and excitation of CQDs and PSA-CQDs. (B) Fluorescence spectra of PSA-CQDs solution under different pH conditions (from pH 3 to 11). | ||
Fluorescence turn-off and turn-on induced by copper ion and thio-containing compounds
It is speculated that phenylsulfonic acid is capable to coordinate with metal ions such as Cu(II). The influence of 15 common metal cations on the fluorescence of PSA-CQDs nanoprobe was assessed as shown in Fig. S6.† It is found that copper ion has the strongest quenching efficiency to the fluorescence of PSA-CQDs among 15 common metal cations including Na+, K+, Mg2+, Ca2+, Ba2+, Mn2+, Zn2+, Hg2+, Fe3+, Ni2+, Co2+, Ag+, Cd2+, Pb2+ and Cu2+. Thus, the quenching efficiency by Cu2+ was investigated as shown in Fig. 2A. The fluorescence of PSA-CQDs nanoprobe was gradually quenched as the addition of copper ion, and a high quenching efficiency of 75% was attained when the concentration of Cu2+ is 22.9 μM, suggesting that copper ion can efficiently quench the fluorescence of the probe. The quenching mechanism of PSA-CQDs nanoprobe by Cu2+ was further explored. The presence of K+, Na+ and Ca2+ induces almost no change in fluorescence of PSA-CQDs nanoprobe as shown in Fig. S6,† which can exclude the dominant role of ion exchange mechanism in fluorescence quenching. From Fig. 2B, one can note that the value I0/I is linearly related to the concentration of copper ion. According to Stern–Volmer equation I0/I = 1 + Ks[Q] = 1 + kqτ0[Q] where Ks, kq, τ0 represent Stern–Volmer constant, quenching rate constant and initial lifetime, kq is determined to be 2.4 × 10¹³ L mol−1 s−1, which is several order magnitude than the value (109 to 1010 L mol−1 s−1) for collision-controlled quenching. This great value for kq clearly illustrates the generation of ground-state complexes between PSA-CQDs and copper ion. Fig. S5† displays that the time-resolved decay curves of PSA-CQDs nanoprobe as a function of concentration of Cu2+ in the range of 0.0–15.0 μM, and the lifetime of PSA-CQDs nanoprobe remains almost unchanged according to the fitting curves. It further confirmed that the quenching mechanism of PSA-CQDs nanoprobe by Cu2+ is static quenching. Thereby it is suggested that the quenching by Cu2+ is due to static quenching, i.e., the formation of non-fluorescent complex between PSA-CQDs nanoprobe and Cu2+.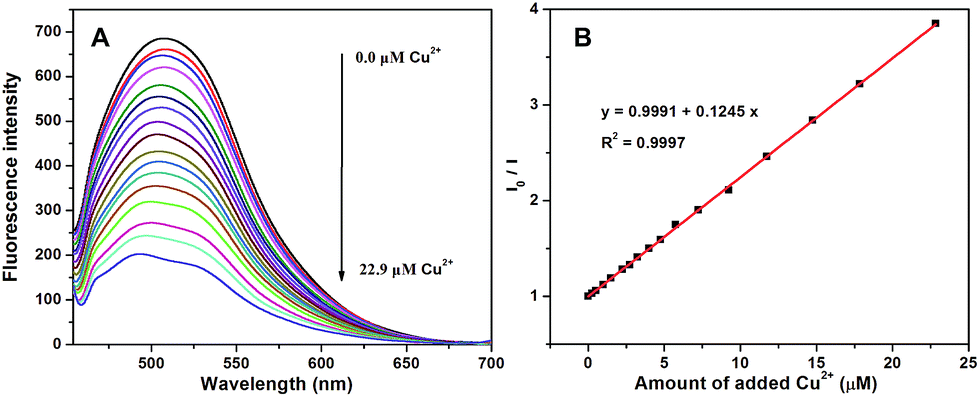 | ||
| Fig. 2 (A) Fluorescence spectra of PSA-CQDs nanoprobe as a function of concentration of Cu2+ in the range of 0.0–22.9 μM. (B) The fitting curve between I0/I and the concentration of Cu2+. | ||
To test the feasibility of the competitive strategy among PSA-CQDs, Cu(II) and thiocholine, three thio-containing compounds including Hcy, Cys and GSH were adapted as the alternatives to thiocholine. As shown in Fig. 3A, the fluorescence of PSA-CQDs nanoprobe was quenched by the added Cu2+, and a high quenching efficiency of 75% was attained due to the formation of nonfluorescent PSA-CQDs/Cu(II) complex. After the introduction of Hcy, Cys or GSH to PSA-CQDs/Cu(II) system, the fluorescence almost recovers to its original intensity. This is originated from the regeneration of free PSA-CQDs nanoprobe because Hcy, Cys or GSH has stronger affinity to Cu2+ to form the corresponding complex. This phenomenon supports that thiol-containing compounds are capable to remove Cu2+ from the PSA-CQDs/Cu(II) complex and thereby turn on the fluorescence. The other common amino acids and amines including His, Trp, Ser, Gln, Tyr, Gly, Arg, Met, PPD, PSA and SA were selected to test their interference to PSA-CQDs/Cu(II) system. As shown in Fig. S7,† the interference from these potential interferents can be tolerated when their concentration is no more than 5.0 μM; however, the influence of Hcy, Trp and Ser on the sensing system can not be ignored when their concentration is over 7.5 μM. Thereby the amount of these potential interferents should be strictly controlled to avoid apparent interference from them. The detection strategy in Scheme 1 was tested as shown in Fig. 3B. After the fluorescence of PSA-CQDs nanoprobe was quenched by copper ion, the addition of a certain amount of ATCh, the substrate of AChE, induces only a slight decrease in intensity. However, the addition of AChE causes a sharp increase in fluorescence, where the fluorescence is enhanced several times. This fact adequately indicates that thiocholine hydrolyzed from ATCh under the catalysis of AChE is able to compete with PSA-CQDs nanoprobe and thus causes the fluorescence recovery, which provides the base for quantitative measurement of AChE activity through this detection strategy.
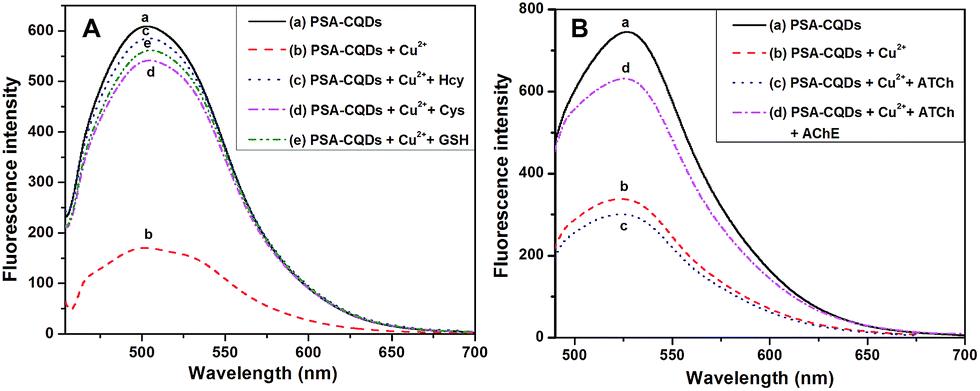 | ||
| Fig. 3 (A) The changes of fluorescence spectra of PSA-CQDs in the presence of different composition: (a) mere PSA-CQDs; (b) in the presence of Cu2+ (12.0 μM); (c) in the presence of Cu2+ (12.0 μM) and Hcy (60.0 μM); (d) in the presence of Cu2+ (12.0 μM) and Cys (60.0 μM); (e) in the presence of Cu2+ (12.0 μM) and GSH (60.0 μM). (B) The changes of fluorescence spectra of PSA-CQDs in the presence of different composition: (a) mere PSA-CQDs; (b) in the presence of Cu2+ (12.0 μM); (c) in the presence of Cu2+ (12.0 μM) and ATCh (1480.0 μM); (d) in the presence of Cu2+ (12.0 μM), ATCh (1480.0 μM) and AChE (600.0 U L−1). | ||
Fluorescent AChE activity assay based on PSA-CQDs
Detection conditions for AChE activity monitoring were optimized before quantitative measurement was conducted. From Fig. 2A, 22.9 μM of Cu2+ can cause a high quenching efficiency of 75%, and thus was chosen for the following detection. The influence of the amount of ATCh on the fluorescence was also tested as shown in Fig. S8.† No apparent change in fluorescence intensity is observed when the concentration of ATCh is in the range of 100.0–2000.0 μM, indicating that the presence of ATCh exerts negligible influence on the fluorescence of the system. A relatively large quantity of 1480.0 μM was chosen for ATCh attempting to reduce time-consumption of catalytic hydrolysis of ATCh by AChE. When such an amount of ATCh was used as the substrate concentration, time consumption for catalytic hydrolysis of ATCh by AChE can be reduced to 20 min to reach a stable system as shown in Fig. S9.† Under the optimal conditions, AChE activity was measured using PSA-CQDs and ATCh as the indicator and the substrate respectively. When AChE level increased from 0.0 to 200.0 U L−1, the fluorescence intensity of PSA-CQDs is continually increased, implying a gradual hydrolysis of ATCh into thiocholine by AChE. The fitting plot of fluorescence response versus AChE level in the range from 3.8 to 80.0 U L−1 is displayed in Fig. 4B. The regression equation for the calibration curve can be expressed as y = 1.85x + 164.58 with R2 = 0.997. The assay allowed the detection of AChE as low as 2.6 U L−1 estimated from its calibration curve (S/N = 3), and its detection limit is lower than those based on small organic dye (10 U L−1)10 and fluorescent polymers (≥80 U L−1),13,15 but inferior to those based on noble metal nanoclusters (0.05–0.1 U L−1).19,20,22 On the other side, our assay possesses much wider linear scope with over 80 U L−1 than those previous reported (less than 5 U L−1).19,20,22 The most important is that our assay possess adequate sensitivity for practical detection of AChE in human blood since it is reported that normal level of AChE in human blood is in the range of (4.29 ± 0.66) × 103 U L−1.34 The reversibility of PSA-CQDs nanoprobe in response to Cu2+ and GSH was used to evaluate the recyclability of this nanosensor. Fig. S10† shows excellent response to Cu2+ and GSH more than three cycles, indicating good recyclability of this nanosensor. To assess the specificity of the proposed fluorometric assay toward AChE, other enzymes including alkaline phosphatase (ALP), acid phosphatase (ACP), immunoglobulin G (IgG) and bovine serum albumin (BSA) were investigated as control samples. The concentrations of these species were the same as that of AChE, none of them can induce apparent fluorescence response in the assay as AChE did. Fig. S11† showed selectivity factor (I − I0)/I0 for AChE with the level of 600.0 U L−1 is up to 1.49 while those for the others are less than 0.1, and most of the others caused a negative response to the fluorescence. | ||
| Fig. 4 (A) Emission spectra of the assay solution containing PSA-CQDs, Cu2+ (12.0 μM) and ATCh (1480.0 μM) as increasing level of AChE from 0.0 to 200.0 U L−1. (B) The fitting curve between fluorescence intensity and AChE level. | ||
Tacrine, a well-known AChE inhibitor and a dominant medicine for the treatment of Alzheimer's disease, was chosen as an example to test the potential application of this assay in AChE inhibitor screening. As shown in Fig. 5A, in the absence of tacrine, the fluorescence quenched by Cu2+ is recovered to a large extent after the addition of ATCh and AChE because the activity of AChE is not inhibited and can efficiently hydrolyze ATCh to thiocholine. As the increase of tacrine in amount, the inhibition efficiency would be progressively increased which leads to the decrease of the fluorescence because the increase of inhibition ratio of tacrine to AChE. This is supported by the gradual decrease in fluorescence intensity as the increase of tacrine in the range of 0.0–10.0 μM in the sensing system. As shown in Fig. 5B, a linear correlation the correlation between inhibition efficiency of AChE and amount of tacrine was obtained. The regression equation can be expressed as y = 5.39x + 2.07 with R2 = 0.996. IC50 value for tacrine was calculated from the calibrated curve to be 8.9 μM. These results illustrated that this established assay for AChE activity monitoring can be used for its inhibitor screening.
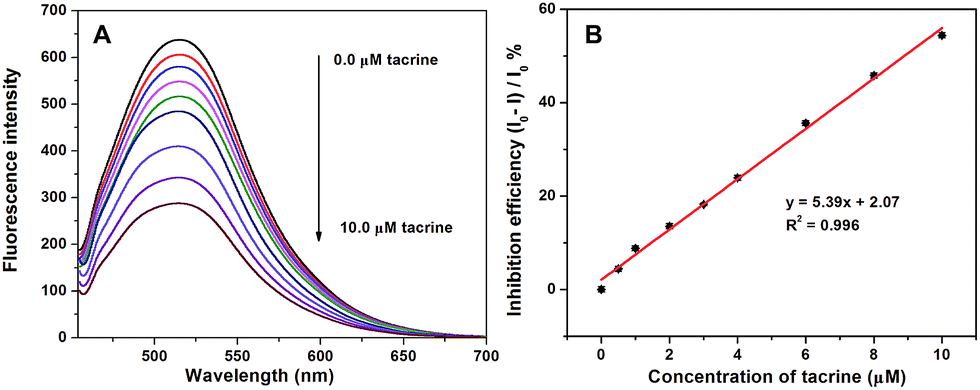 | ||
| Fig. 5 (A) Changes of fluorescence spectra of the assay solution as increasing amount of tacrine from 0.0 to 10.0 μM. (B) The fitting curve between (I0 − I)/I0 and the concentration of tacrine. | ||
Conclusions
In summary, a new fluorometric assay for AChE activity assay was developed on the basis of a competitive strategy among modified carbon quantum dots, copper ion and thiocholine. Phenylsulfonic acid functionalized carbon quantum dots were prepared where carbon quantum dots serve as the fluorophore and phenylsulfonic acid acts as the functional ligand. Copper ion is introduced to mediate the interaction because it can form nonfluorescent complex with the nanoprobe and further removed by thiocholine. Acetylthiocholine is selected as the substrate of AChE and can be hydrolyzed to thiocholine. The correlation between fluorescence intensity and AChE level is utilized to establish AChE assay. Its function of inhibitor screening was also assessed by taking tacrine as the example, and the results indicate that it can be used to screen inhibitors of AChE by the change of fluorescence readout. This work demonstrates the application of competitive detection strategy in enzyme activity evaluation, and provides a new method for AChE activity measurement.Acknowledgements
We are thankful for the support by the National Natural Science Foundation of China (No. 21675143, 21405142 and 21275131).Notes and references
- J. H. Xuereb, E. K. Perry, J. M. Candy, J. R. Bonham, R. H. Perry and E. Marshall, J. Neurol. Sci., 1990, 99, 185–197 CrossRef CAS PubMed.
- D. R. Liston, J. A. Nielsen, A. Villalobos, D. Chapin, S. B. Jones, S. T. Hubbard, I. A. Shalaby, A. Ramirez, D. Nason and W. F. White, Eur. J. Pharmacol., 2004, 486, 9–17 CrossRef CAS PubMed.
- H. Dvir, I. Silman, M. Harel, T. L. Rosenberry and J. L. Sussman, Chem.–Biol. Interact., 2010, 187, 10–22 CrossRef CAS PubMed.
- Y. Miao, N. He and J. J. Zhu, Chem. Rev., 2010, 110, 5216–5234 CrossRef CAS PubMed.
- G. L. Ellman, K. D. Courtney, V. Andres Jr and R. M. Feather-Stone, Biochem. Pharmacol., 1961, 7, 88–95 CrossRef CAS PubMed.
- Z. Z. Chen, X. L. Ren, X. W. Meng, L. F. Tan, D. Chen and F. Q. Tang, Biosens. Bioelectron., 2013, 44, 204–209 CrossRef CAS PubMed.
- S. H. Hou, Z. M. Ou, Q. Chen and B. Y. Wu, Biosens. Bioelectron., 2012, 33, 44–49 CrossRef CAS PubMed.
- H. C. Li, Y. X. Guo, L. H. Xiao and B. Chen, Biosens. Bioelectron., 2014, 59, 289–292 CrossRef CAS PubMed.
- D. Liao, J. Chen, H. Zhou, Y. Wang, Y. Li and C. Yu, Anal. Chem., 2013, 85, 2667–2672 CrossRef CAS PubMed.
- L. Peng, G. Zhang, D. Zhang, J. Xiang, R. Zhao, Y. Wang and D. Zhu, Org. Lett., 2009, 11, 4014–4017 CrossRef CAS PubMed.
- S. Sabelle, P. Y. Renard, K. Pecorella, S. D. Suzzoni-Dezard, C. Creminon, J. Grassi and C. Mioskowski, J. Am. Chem. Soc., 2002, 124, 4874–4880 CrossRef CAS PubMed.
- M. Wang, X. Gu, G. Zhang, D. Zhang and D. Zhu, Anal. Chem., 2009, 81, 4444–4449 CrossRef CAS PubMed.
- F. Feng, Y. Tang, S. Wang, Y. Li and D. Zhu, Angew. Chem., Int. Ed., 2007, 46, 7882–7886 CrossRef CAS PubMed.
- C. Y. Lei, Z. Wang, Z. Nie, H. H. Deng, H. P. Hu, Y. Huang and S. Z. Yao, Anal. Chem., 2015, 87, 1974–1980 CrossRef CAS PubMed.
- W. Zhang, L. Zhu, J. Qin and C. Yang, J. Phys. Chem. B, 2011, 115, 12059–12064 CrossRef CAS PubMed.
- R. Gill, L. Bahshi, R. Freeman and I. Wilner, Angew. Chem., Int. Ed., 2008, 47, 1676–1679 CrossRef CAS PubMed.
- L. Saa, A. Virel, J. Sanchez-Lopez and V. Pavlov, Chem.–Eur. J., 2010, 16, 6187–6192 CrossRef CAS PubMed.
- H. C. Li, Y. X. Guo, H. H. Xiao and B. Chen, Analyst, 2014, 139, 285–289 RSC.
- W. H. Li, W. Li, Y. F. Hu, Y. L. Xia, Q. P. Shen, Z. Nie, Y. Huang and S. Z. Yao, Biosens. Bioelectron., 2013, 47, 345–349 CrossRef CAS PubMed.
- D. B. Liu, W. W. Chen, Y. Tian, S. He, W. F. Zheng, J. S. Sun, Z. Wang and X. Y. Jiang, Adv. Healthcare Mater., 2012, 1, 90–95 CrossRef CAS PubMed.
- M. Wang, X. Gu, G. Zhang, D. Zhang and D. Zhu, Langmuir, 2009, 25, 2504–2507 CrossRef CAS PubMed.
- Y. D. Zhang, Y. N. Cai, Z. L. Qi, L. Lu and Y. X. Qian, Anal. Chem., 2013, 85, 8455–8461 CrossRef CAS PubMed.
- S. N. Baker and G. A. Baker, Angew. Chem., Int. Ed., 2010, 49, 6726–6744 CrossRef CAS PubMed.
- H. T. Li, Z. K. Kang, Y. Liu and S.-T. Lee, J. Mater. Chem., 2012, 22, 24230–24253 RSC.
- J. H. Shen, Y. H. Zhu, X. L. Yang and C. Z. Li, Chem. Commun., 2012, 48, 3686–3699 RSC.
- S. Y. Lim, W. Shen and Z. Q. Gao, Chem. Soc. Rev., 2015, 44, 362–381 RSC.
- A. D. Zhao, Z. W. Chen, C. Q. Zhao, N. Gao, J. S. Ren and X. G. Qu, Carbon, 2015, 85, 309–327 CrossRef CAS.
- X. T. Zheng, A. Ananthanarayanan, K. Q. Luo and P. Chen, Small, 2015, 14, 1620–1636 CrossRef PubMed.
- Y. Wang, L. Zhang, R. P. Liang, J. M. Bai and J. D. Qiu, Anal. Chem., 2013, 85, 9148–9155 CrossRef CAS PubMed.
- S. Y. Liu, N. Zhao, Z. Cheng and H. G. Liu, Nanoscale, 2015, 7, 6836–6842 RSC.
- Z. S. Qian, L. J. Chai, Y. Y. Huang, C. Tang, J. J. Shen, J. R. Chen and H. Feng, Biosens. Bioelectron., 2015, 68, 675–680 CrossRef CAS PubMed.
- Z. S. Qian, L. J. Chai, C. Tang, Y. Y. Huang, J. R. Chen and H. Feng, Anal. Chem., 2015, 87, 2966–2973 CrossRef CAS PubMed.
- Y. H. Zhu, G. F. Wang, H. Jiang, L. Chen and X. J. Zhang, Chem. Commun., 2015, 51, 948–951 RSC.
- R. S. Naik, W. Y. Liu and A. Saxena, J. Appl. Toxicol., 2013, 33, 290–300 CrossRef PubMed.
Footnotes |
| † Electronic supplementary information (ESI) available: TEM, XPS and fluorescence spectra and selectivity of the sensing system. See DOI: 10.1039/c6ra18978d |
| ‡ These authors contributed to this work equally. |
| This journal is © The Royal Society of Chemistry 2016 |