Armin Neitzela,
Gábor Kovácsb,
Yaroslava Lykhach*a,
Nataliya Tsudc,
Sergey M. Kozlovb,
Tomáš Skála
c,
Mykhailo Vorokhtac,
Vladimír Matolínc,
Konstantin M. Neyman
bd and
Jörg Libudaae
aLehrstuhl für Physikalische Chemie II, Friedrich-Alexander-Universität Erlangen-Nürnberg, Egerlandstrasse 3, 91058 Erlangen, Germany. E-mail: yaroslava.lykhach@fau.de
bDepartament de Ciència de Materials i Química Física and Institut de Quimica Teòrica i Computacional, Universitat de Barcelona, c/ Martí i Franquès 1, 08028 Barcelona, Spain
cCharles University, Faculty of Mathematics and Physics, Department of Surface and Plasma Science, V Holešovičkách 2, 18000 Prague, Czech Republic
dICREA (Institució Catalana de Recerca i Estudis Avançats), Pg. Lluís Companys 23, 08010 Barcelona, Spain
eErlangen Catalysis Resource Center, Friedrich-Alexander-Universität Erlangen-Nürnberg, Egerlandstrasse 3, 91058 Erlangen, Germany
First published on 29th August 2016
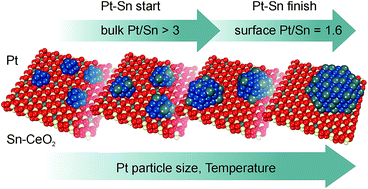
The formation of a supported Pt–Sn nanoalloy upon reactive metal–oxide interaction between Pt nanoparticles and a Sn–CeO2 substrate has been investigated by means of synchrotron radiation photoelectron spectroscopy and resonant photoemission spectroscopy in combination with density functional modeling. It was found that Pt deposition onto a Sn–CeO2 substrate triggers the reduction of Sn2+ cations yielding Pt–Sn nanoalloys at 300 K under ultra-high vacuum conditions. Three distinct stages of Pt–Sn nanoalloy formation were identified associated with the growth of (I) ultra-small monometallic Pt particles on a Sn–CeO2 substrate, (II) Pt–Sn nanoalloys on a Sn–CeO2 substrate, and (III) Pt–Sn nanoalloys on a stoichiometric CeO2 substrate. These findings suggest the existence of a critical size of monometallic Pt particles above which the formation of a Pt–Sn nanoalloy becomes favorable. In this respect, density functional modeling revealed a strong dependence of the formation energy of the PtxSn nanoalloy on the size of the Pt particle. Additionally, the thermodynamically favorable bulk and surface Pt/Sn stoichiometries were identified as two parameters that determine the composition of the supported Pt–Sn nanoalloys and limit the extraction of Sn2+ from the Sn–CeO2 substrate. Primarily, the formation of a bulk Pt3Sn alloy phase drives the growth of the Pt–Sn nanoalloy upon Pt deposition at 300 K. Upon annealing, Sn segregation on the surface of the Pt–Sn nanoalloy promotes further extraction of Sn2+ until the thermodynamically stable Pt/Sn concentration ratios of 3 for the bulk and approximately 1.6 for the surface are reached.
Strategically, it would be beneficial to decouple the reactive metal–oxide interaction from the SMSI in terms of the reaction conditions. Specifically, the harsh reductive conditions necessary to trigger the reactive metal–oxide interaction can be bypassed by combining the alloying metals and the oxide support in a smart fashion.16 For instance, the formation of supported Pt–Sn or Pd–Sn alloy nanoparticles was reported upon the deposition of Pt or Pd metals onto Sn–CeO2 mixed oxides even at 300 K and under ultra-high vacuum.17–19 Similarly, supported Pd–Ga nanoparticles were formed upon Pd deposition on Ga–CeO2 mixed oxides.19 Thus, a versatile approach could involve the formation of Sn–CeO2 and Ga–CeO2 mixed oxides as an intermediate step in the preparation of supported intermetallic compounds. It appears that the necessary precondition is, however, that one of the alloying metals is highly soluble in the bulk of the host oxide which must be a reducible oxide. For instance, deposition of metallic Sn or Ga leads to a strong reduction of CeO2, triggering a change in the oxidation state of cerium cations from Ce4+ to Ce3+ upon dissolution of Sn and Ga in the bulk.20–23 Subsequent deposition of Pt or Pd metals leads to the reduction of Sn and Ga cations resulting in the formation of supported alloy nanoparticles.17–19 This process is accompanied by the re-oxidation of Ce3+ to Ce4+ leading to the recovery of the initial CeO2 stoichiometry. Recently we reported that the deposition of a sufficient amount of Pt led to complete extraction of Sn yielding Pt–Sn nanoparticles supported on stoichiometric CeO2 films at 300 K.18
This approach appears particularly attractive because it avoids both high temperature and the reductive atmosphere during the preparation of the supported nanoalloys. Still, fundamental understanding of the processes that steers the growth of the supported nanoalloys is required in order to exploit reactive metal–oxide interactions for a knowledge-driven materials synthesis.7
Herein, we report a comprehensive study on the formation of supported Pt–Sn nanoalloys on a Sn–CeO2 substrate carried out by means of synchrotron radiation photoelectron spectroscopy (SRPES) and resonant photoemission spectroscopy (RPES) in combination with density functional (DF) modeling. We established the processes steering the growth of supported Pt–Sn nanoalloys and controlling the extraction of Sn from Sn–CeO2 substrate.
The samples were prepared by means of physical vapor deposition (PVD) of Pt (Goodfellow, 99.99%) on Sn–CeO2 mixed oxide films grown on Cu(111). The preparation procedure involved several steps. First, epitaxial CeO2(111) films were grown on clean Cu(111) (MaTecK GmbH, 99.999%) by PVD of Ce metal (Goodfellow, 99.99%) in oxygen atmosphere (5 × 10⁻⁷ mbar, Linde, 99.999%) at 523 K, followed by the annealing of the films at 523 K in oxygen atmosphere at the same pressure for 5 min. This procedure24–26 yielded a continuous and stoichiometric CeO2(111) film with a thickness about 2.0 nm. LEED studies of the prepared films confirmed the epitaxial growth of CeO2(111) with the characteristic (1.5 × 1.5) superstructure relative to the Cu(111) substrate. PVD of Sn in UHV at 523 K on the CeO2(111) films yielded Sn–CeO2 mixed oxide.17,22,27 According to reflection high-energy electron diffraction (RHEED) studies, the incorporation of Sn into CeO2 lattice triggers its transformation from the fluorite structure into a simple cubic structure.27 The atomic concentration of Sn in the volume of CeO2(111) film determined by X-ray photoelectron spectroscopy (XPS) was about 18%. For comparison, this concentration corresponds to the deposition of a 0.4 nm thick Sn film. Pt was deposited stepwise onto the Sn–CeO2 mixed oxide film at 300 K in UHV. The nominal thickness of Pt was calibrated with respect to the deposition time of Pt on the CeO2(111) film taking into account the 3D growth of the Pt nanoparticles.28 The total Pt deposition time of 6500 s resulted in a total nominal thickness of the deposited Pt layer of 1.5 nm that corresponds to a Pt loading of 3.22 μg cm−2. Additionally, three samples labeled (A), (B), and (C) were prepared by the deposition of Pt onto the Sn–CeO2 mixed oxide films at 300 K in UHV during 60, 240, and 1000 s that correspond to nominal Pt thicknesses and Pt loadings of 0.014 nm (0.03 μg cm−2), 0.055 nm (0.12 μg cm−2), and 0.231 nm (0.49 μg cm−2), respectively.
The core level spectra of O 1s, C 1s, Pt 4f, and Sn 4d were acquired at photon energies of 650, 410, 180, and 60 eV, respectively. The binding energies in the spectra were calibrated with respect to the Fermi level. Additionally, Al Kα radiation (1486.6 eV) was used to measure O 1s, C 1s, Ce 3d, Sn 3d, Pt 4f, and Cu 2p3/2 core levels.
Valence band spectra were acquired at three different photon energies, 121.4, 124.8, and 115.0 eV, that correspond to the resonant enhancements in Ce3+, Ce4+ ions, and to off-resonance conditions, respectively. Analysis of the spectra obtained with these photon energies forms the basis of RPES.28,29 The ratio between the corresponding resonant intensities, D(Ce3+)/D(Ce4+), denoted as a Resonant Enhancement Ratio (RER) is a direct measure of the degree of reduction of cerium oxide and can be used to quantify the concentration of Ce3+ ions in the films.28 In specific, the RER scales with the Ce3+/Ce4+ concentration ratio by a factor of 5.5.28
All spectra were acquired at a constant pass energy and at the emission angles of photoelectrons 20° and 60° (XPS), and 0° (SRPES, RPES) with respect to the sample normal. The values of total spectral resolution were 1 eV (Al Kα), 150 meV (hν = 60 eV), 200 meV (hν = 115–180 eV), 400 meV (hν = 410 eV), and 650 meV (hν = 650 eV). All SRPES data were processed using the KolXPD fitting software.30 Sn 4d spectra were fitted following a similar approach as described elsewhere.17 Briefly, the spectral component associated with Sn2+ cations was fitted with a Voigt profile and those associated with Pt–Sn alloy contributions were fitted with a Doniach–Šunjić convoluted with a Gaussian profile with a fixed asymmetry parameter of 0.05 after subtraction of a composite background. The composite background consisted of a baseline spectrum obtained prior to Sn deposition and a Shirley background. The use of the composite background was necessary to compensate for the complex shape of the background in the Sn 4d region. The widths and the branching ratios for the Sn 4d components associated with Sn2+ cations were determined prior to Pt deposition and kept fixed thereafter. For the Sn0 components associated with surface and bulk contributions from Pt–Sn nanoalloys the widths of the peaks and their relative binding energies were fixed and the branching ratio was set to 1.5.
During the experiment, the sample temperature was controlled by a DC power supply passing a current through Ta wires holding the sample. Temperatures were monitored by a K-type thermocouple attached to the back of the sample.
Upon Pt deposition, a single broad doublet emerges in the Pt 4f spectra at 71.70 eV (Pt 4f7/2) due to the nucleation of small Pt particles. The increase of the peak intensity is accompanied by its shift to lower binding energies during stepwise Pt deposition which is consistent with the growth of nanoparticles. An interesting development is observed in the Sn 4d spectra (Fig. 1a). In particular, a new peak emerges in the Sn 4d spectra at 24.33 eV (Sn 4d5/2) after the Pt deposition time of 240 s. This spectral component is associated with the reduction of Sn2+ cations and the formation of the supported Pt–Sn nanoalloy. The corresponding peak at 24.33 eV represents the surface component of the Pt–Sn nanoalloy.17,18 During Pt deposition, the shift of the surface Pt–Sn contribution to lower binding energies occurs in parallel with the shift of the Pt 4f doublet peak. A second new peak emerges in the Sn 4d spectra at a slightly higher binding energy with respect to the surface Pt–Sn contribution. This second peak is assigned to the spectral contribution from the bulk Pt–Sn alloy.17,18 Both the surface and the bulk Pt–Sn contribution grow in intensity at the expense of the Sn2+ signal upon further Pt deposition. The binding energy separation between the surface and the bulk Pt–Sn components in the Sn 4d spectra slightly increased from 0.29 eV at 1360 s to 0.35 eV at 6500 s. At the last Pt deposition step, the binding energy of the Pt 4f peak is 70.97 eV and the binding energies of the surface and bulk Pt–Sn contributions in the Sn 4d spectrum are 23.84 and 24.19 eV, respectively, in line with the formation of large particles with distinct metallic character. According to the angle-resolved XPS, all the Sn2+ content in the Sn–CeO2 mixed oxide film within the depth of 0.9 nm was reduced at the last Pt deposition step yielding Pt–Sn nanoalloys supported on the CeO2 film. Based on thermodynamic considerations,39,40 the formation of the Pt–Sn alloy is driven by the formation of strong Pt–Sn bonds in the intermetallic compounds, which are by 30–80 kJ mol−1 atoms more favorable than the coexistence of monometallic Pt and Sn phases.
We analyzed the observed behavior in more detail based on the development of the corresponding spectral contributions in the Sn 4d and Pt 4f spectra. The integrated intensities of the spectral contributions from Sn2+ and the Pt–Sn nanoalloy are plotted in Fig. 1c. Note that the total metallic Pt0 and Sn0 contributions were determined by the integration of the Pt–Sn alloy contributions in the Pt 4f and Sn 4d spectra, respectively. In particular, the total Sn0 contribution represents the sum of the surface and bulk components in the Sn 4d spectra. The Pt0 to Sn0 intensity ratio is plotted in Fig. 1d. One can see that the intensity ratio is high at the start of the Pt–Sn alloy formation and decreases as a function of the Pt coverage at larger Pt deposition times until it saturates. Using the relative atomic sensitivity factors for Pt and Sn atoms determined earlier18 we were able to estimate the stoichiometry of the Pt–Sn nanoalloy as a function of the Pt coverage (see Fig. 1d). In particular, we found that at the onset of Pt–Sn alloy formation, the stoichiometry ratio, i.e. the concentration ratio n(Pt0)/n(Sn0), is about 14. It decreases to 8 at larger Pt deposition times (above 2000 s). Note that the corresponding stoichiometry ratios were determined from the Pt 4f and Sn 4d intensities obtained with the highest surface sensitivities and therefore represent the surface Pt/Sn concentration ratio in the supported Pt–Sn nanoalloys.
Three distinct Pt coverage regimes can be identified during the Pt–Sn nanoalloy formation by means of RPES (see Section 2.1. for details). The method is based on the determination of the degree of reduction of Ce cations in the Sn–CeO2 mixed oxide film, i.e. the relative concentration of Ce3+ ions which is proportional to the resonant enhancement ratio (RER). For instance, the RER is about 0.03 on pure stoichiometric CeO2(111). During the preparation of the Sn–CeO2 mixed oxide film, the adsorption of one Sn0 atom on the CeO2(111) film leads to the reduction of two Ce4+ cations to Ce3+ per one Sn2+ cation formed.17,22 In the present case, the RER obtained on the pure Sn–CeO2 mixed oxide film was 0.96. The development of the RER as a function of Pt deposition time is shown in Fig. 2.
One can see that Pt deposition led to an increase of the RER from 0.96 to about 1.11 at the deposition time of 180 s. This behavior points to a redox interaction between Pt and the Sn–CeO2 mixed oxide film associated with a charge transfer from the Pt particles to the support for deposition times below 180 s. A similar phenomenon was observed earlier upon deposition of Pt on the pure CeO2(111) film.28,41 We believe that the region of the increasing RER indicates the Pt coverage regime where nucleation and growth of monometallic Pt particles on the Sn–CeO2 mixed oxide film occurs. This assumption is in line with the structure of the Sn 4d spectra, i.e. the presence of a single component associated with Sn2+ cations (see Fig. 1a). The corresponding region is labeled (I) Pt/Sn–CeO2 and is represented by a schematic model (A) in Fig. 2. At deposition times above 180 s, we observed a steep decrease of RER which is associated with the formation of Pt–Sn nanoalloys. The onset of the decrease correlates with the emergence of the Pt–Sn alloy components in the Sn 4d spectra (see Fig. 1a). We assume that upon Pt–Sn alloy formation, two Ce3+ cations are re-oxidized to Ce4+ per each Sn0 atom formed. The decrease of the RER occurs for Pt coverages obtained at deposition times between 180 and 2600 s and continues to 4700 s. In this region the Pt–Sn nanoalloy is supported on a Sn–CeO2 mixed oxide film with the concentration of Sn2+ continuously decreasing as a function of Pt deposition time. The corresponding region is labeled as (II) Pt–Sn/Sn–CeO2 and is represented by the schematic models (B) and (C) in Fig. 2. The concentration of Sn2+ cations in the oxide film diminishes at the Pt deposition time of 6500 s. At this point, the Pt–Sn nanoalloy is supported on a pure CeO2 film. The slight increase of the RER at this step indicates a small amount of residual charge transfer between the Pt–Sn nanoalloys and the support. The corresponding region is labeled (III) Pt–Sn/CeO2 and is represented by the schematic model (D) in Fig. 2.
In order to establish the driving force of the Pt–Sn nanoalloy formation we first focus on the regions (II)–(III). We note that the surface Pt/Sn concentration ratio maintains a nearly constant value of 8 over a broad range of deposition times between 2000 and 6500 s (see Fig. 1d). The following behavior suggests that the extraction of Sn2+ from the Sn–CeO2 substrate in this region is driven by the formation of a Pt–Sn alloy phase of particular stoichiometry. In order to determine the stoichiometry of this alloy, the Pt/Sn concentration must be analyzed in the whole volume of the Pt–Sn nanoalloy, i.e. using bulk sensitive photon energies. For this reason we employed angle-resolved XPS at the last Pt deposition step (6500 s). We obtained an average Pt/Sn bulk ratio of about 4.0 ± 0.3 as determined from the integrated intensities of the Pt 4f and the Sn 3d spectra acquired at photoemission angles of 20° and 60° with respect to the sample normal. Note that the value of 4.0 ± 0.3 was obtained taking into account the atomic photoionization cross sections for Pt and Sn atoms42,43 and inelastic mean free paths (IMFP).44 Additionally, if the transmission function of the analyzer is taken into account,45 the Pt/Sn bulk ratio is 5.1 ± 0.4. Based on the Pt–Sn equilibrium phase diagram,39,40 only Pt and Pt3Sn phases are favorable at this bulk Pt/Sn concentration ratio. Therefore we assume that the growth of the supported Pt–Sn nanoalloy is driven by the formation of a Pt3Sn phase. The enrichment of the Pt–Sn nanoalloy by Pt at the surface observed by SRPES (Fig. 1d) most likely results from the kinetically hindered diffusion of Sn in Pt–Sn nanoalloy at 300 K.
A different scenario is observed at low Pt deposition times in the Pt coverage regime (II) between 240 and 2000 s. Here, the surface Pt/Sn concentration strongly depends on the Pt coverage, i.e. the Pt deposition time. This suggests that the formation energy of the supported Pt–Sn nanoalloys is a function of the Pt particle size. Moreover, the growth of monometallic Pt particles in coverage regime (I) suggests the existence of a critical size of monometallic Pt particles above which the formation of the Pt–Sn nanoalloy becomes favorable. The existence of a critical size of monometallic Pt particles suggests a delicate balance between the stabilities of the supported Pt–Sn nanoalloy and the Sn–CeO2 mixed oxide which notably depends on the size of the Pt particles at the early stage of the nanoalloy growth. It is noteworthy that the critical size of the monometallic Pt is overcome at the Pt deposition time of 240 s.
![]() | ||
Fig. 3 Overview of the model Ptx particles used in the density functional studies. The numbers indicate the symmetrically inequivalent Pt atoms in each particle replaced by a Sn atom to generate the Ptx−1Sn particles (see also Table 1). |
Model | Sn site | Nsites | Nc[Pt] | ΔE, eV |
---|---|---|---|---|
a | b | c | ||
PtSn | 1 | −4.94 | ||
Pt2Sn | 2 | −5.22 | ||
Pt3Sn | 3 | −5.22 | ||
Pt7Sn | 1 | 2 | 4 | −5.56 |
2 | 2 | 3 | −5.46 | |
3 | 1 | 6 | −5.50 | |
4 | 2 | 5 | −6.02 | |
5 | 1 | 2 | −5.78 | |
Average | −5.67 | |||
Pt33Sn | 1 | 8 | 6 | −5.47 |
2 | 4 | 9 | −5.58 | |
3 | 4 | 6 | −5.46 | |
4 | 4 | 6 | −5.70 | |
5 | 4 | 5 | −5.37 | |
6 | 4 | 7 | −5.53 | |
Average | −5.51 | |||
Pt78Sn | 1 | 24 | 6 | −5.67 |
2 | 12 | 7 | −5.96 | |
3 | 24 | 9 | −5.84 | |
Average | −5.80 | |||
Pt139Sn | 1 | 24 | 6 | −5.51 |
2 | 24 | 7 | −6.12 | |
3 | 24 | 9 | −6.05 | |
4 | 24 | 9 | −5.79 | |
Average | −5.87 |
The choice of analyzing Sn binding exclusively at surface sites was based on the strong preference of Sn atoms to segregate at the surface of Pt–Sn nanoalloy reported earlier.18 Interestingly, we found that in larger particles the highest binding energy of Sn is in edge sites. Such finding might seem unusual, since one would expect the strongest binding for terrace sites where more bonds between Sn and the surrounding Pt atoms can be formed. Nevertheless, the present finding agrees with results of our previous calculations on chemical ordering in Pt–Sn alloy nanoparticles.18 They revealed preference of Sn to occupy surface sites in the order of corner > edge > terrace, which is related to the considerably larger size of Sn atoms compared to Pt.
The calculated binding energies averaged over surface sites are plotted in Fig. 4. Here, the binding energy of Sn in Ptx−1Sn particles increases as a function of the Pt particle size until a value of ∼−5.9 eV is reached. The only particle that does not completely fit the trend is Pt7Sn, which we assign to the strong reconstruction of the Pt7 species used for the energy reference. Thus, it appears that the Pt7Sn model is inappropriate for the present analysis of the trends in Pt–Sn binding without global optimization of the Pt7 and Pt7Sn structures, which is beyond the scope of our work.
![]() | ||
Fig. 4 Average binding energies of a Sn atom in Ptx−1Sn particles as a function of the Pt particle size. The binding energy is defined as the energy change for the process Ptx−1 + Sn → Ptx−1Sn. |
Qualitatively, the development of the average Pt–Sn binding energies in Ptx−1Sn particles (shown in Fig. 4) explains the experimentally observed dependency of alloy formation on the particle size. In particular, the sharp increase of the binding energy with increasing number of atoms per Ptx−1Sn particle from 2 to 34, is compatible with the existence of the critical size of Pt particles determining the onset of the alloy formation. A similar conclusion can also be drawn from the largest calculated values of Pt–Sn binding energies in each of the Ptx−1Sn particles (Table 1).
The shift of the Pt 4f peak towards higher binding energy is consistent with the formation of the Pt–Sn alloy.46–48 Subsequent annealing to higher temperatures resulted in a moderate increase of the surface Pt–Sn alloy component without significant decrease of the Sn2+ concentration in the Sn–CeO2 mixed oxide film. At the final annealing step (750 K) the binding energy of Pt 4f is 71.69 eV which is consistent with a rather small size of the supported Pt–Sn nanoalloys. The annealing of small and medium sized Pt–Sn nanoalloys (B) and (C) also resulted in the increase of the Sn 4d spectral contributions associated with Pt–Sn nanoalloys. This was accompanied by the decrease of the Sn2+ concentration in the Sn–CeO2 mixed oxide film. Noteworthy, the decrease of the Sn2+ concentration is smaller in the case of the small Pt–Sn nanoalloy system (B) with respect to the medium-sized Pt–Sn nanoalloy system (C). Similar to the system (A), the Pt 4f spectra are slightly shifted to higher binding energies also upon annealing of the systems (B) and (C). This is in line with the increased concentration of Sn in the supported Pt–Sn nanoalloy.46 Still, the Sn2+ concentration in the Sn–CeO2 mixed oxide film is not significantly lowered. Such behavior suggests the existence of a limit that prevents excessive reduction of Sn2+ in the Sn–CeO2 mixed oxide film and, thereby, limits the Sn concentration in supported alloy nanoparticles.
The integrated intensities of the spectral contributions from the Pt–Sn nanoalloy and Sn2+ are plotted in Fig. 7a and b, respectively, as a function of the temperature. Here, the total Sn0 alloy contribution represents the sum of the surface and bulk components in the Sn 4d spectra. The stoichiometry ratio, n(Pt0)/n(Sn0), calculated from the corresponding spectral alloy contributions in Pt 4f and Sn 4d spectra is plotted in Fig. 7c. The stoichiometry ratios for the small (B) and medium-sized (C) Pt–Sn nanoalloys are about 11.5 and 8.2 at 300 K, respectively. The higher stoichiometry ratio found in small Pt–Sn nanoalloys is consistent with the smaller size of the supported Pt–Sn alloy nanoparticles in system (B) with respect to system (C). In system (A), the size of monometallic Pt particles is too small to trigger the alloy formation at 300 K. Formation of the Pt–Sn nanoalloy at 350 K on sample (A) is in line with the sharp dependence of the alloy formation energy discussed in Section 3.2. In particular, a slight increase of the size of ultra-small Pt particles due to sintering at 350 K turned out to be sufficient to reach the critical size of Pt particles and trigger the alloy formation. The stoichiometry ratio in system (A) is about 8 at 350 K. However, this value is likely underestimated due to very low spectral contributions from the alloy nanoparticles that may lead to an error in the calculated stoichiometry.
Upon subsequent annealing to higher temperatures, the stoichiometry ratios on all three samples (A)–(C) converge to a similar value of 1.6 at 750 K (see Fig. 7c). It is noteworthy that the final value of the stoichiometry ratio, 1.6, is very similar to the value of the thermodynamically stable surface Pt/Sn concentration ratio obtained on big Pt–Sn nanoalloys supported on the CeO2 film18 (Pt deposition time of 6500 s). The corresponding system (D) has been investigated earlier in a great detail.18 Specifically, it was found that the stoichiometry ratio in this system decreased from about 8 at 300 K to 1.6 at 750 K due to temperature induced Sn segregation at the surface. Note that in the case of big Pt–Sn alloy nanoparticles (D), all Sn2+ cations were efficiently reduced and converted into the Pt–Sn alloy due to the sufficiently high amount of Pt available at the deposition time of 6500 s (see Fig. 1a and b, top spectra).
Therefore, Sn enrichment at the surface of the supported Pt–Sn nanoparticle proceeded exclusively due to the migration of Sn atoms from the bulk of the alloy. As discussed earlier,18 Sn segregation on the surface of Pt–Sn nanoalloy is driven by the balance between the surface segregation energy of Sn atoms and the energy of heteroatomic Pt–Sn bond formation. Our DF calculations performed with the Pt3Sn nanoparticle models predicted a thermodynamically stable surface with Pt/Sn stoichiometry ratio in the range of 1.5–2 depending on the number of atoms per particle.18
We assume that at lower Pt coverage, Sn segregation triggered by annealing will be accompanied by sintering and coalescence processes on all three samples (A)–(C). Therefore, several processes will drive the Sn2+ extraction from the Sn–CeO2 film and the formation of the Pt–Sn nanoalloys. In Fig. 8, we schematically summarized the influence of Pt coverage and the effect of temperature on the final composition of the supported Pt–Sn nanoalloys. We emphasize that stepwise Pt deposition and annealing in UHV yield three distinct phases associated with the (I) Pt/Sn–CeO2, (II) Pt–Sn/Sn–CeO2, and (III) Pt–Sn/CeO2 systems. The degree of surface Sn enrichment in the nanoalloy may differ in systems (II) and (III) as a function of the temperature.
During phase (I), monometallic Pt nanoparticles are supported on the Sn–CeO2 system. The formation of the supported nanoalloy starts when a certain critical size of Pt particles is reached either due to the deposition of a sufficient amount of Pt or due to sintering and coalescence leading to the formation of bigger particles. Further extraction of Sn2+ from the Sn–CeO2 is triggered by Sn segregation at the surface of supported Pt–Sn nanoalloys upon annealing.
It is important to note, that the formation of Pt–Sn nanoalloys during stepwise Pt deposition is controlled by the formation of a stoichiometric bulk alloy phase, most likely Pt3Sn. This path is therefore sensitive to the bulk Pt/Sn stoichiometry. On the other hand, annealing triggers Sn segregation from the bulk of the supported nanoalloy. Note that this process must significantly deplete the Sn concentration in the bulk of the supported nanoalloy. As a result, the extraction of Sn2+ becomes again favorable in order to restore the thermodynamically stable bulk alloy composition. Most importantly, once the most thermodynamically stable Pt/Sn stoichiometries in the bulk (3) and at the surface (1.6) are reached, the extraction of Sn2+ from Sn–CeO2 film is terminated.
(1) Three particular regions were identified during the stepwise Pt deposition at 300 K in UHV associated with (I – Pt/Sn–CeO2) the growth of monometallic ultra-small Pt particles supported on a Sn–CeO2 film, (II – Pt–Sn/Sn–CeO2) supported Pt–Sn nanoalloys on a Sn–CeO2 film, and (III – Pt–Sn/CeO2) supported Pt–Sn nanoalloys on a CeO2 film.
(2) Pt–Sn alloy formation depends on the particle size and occurs above a critical size limit only. According to DF modeling, the binding energy of Sn in the Pt–Sn nanoalloy increases with the size of the Pt particle. The most significant increase occurs for the Pt–Sn particles containing less than 40 atoms, suggesting that nanoalloy formation is triggered above this size.
(3) The extraction of Sn2+ and the growth of supported Pt–Sn nanoalloys during the stepwise Pt deposition is driven by the formation of a stoichiometric Pt3Sn alloy.
(4) Annealing of the supported Pt–Sn nanoalloys triggers Sn segregation, with the nanoalloy approaching the thermodynamically preferred surface Pt/Sn stoichiometry ratio of approximately 1.6. This surface Pt/Sn stoichiometry ratio does not depend on the size of the supported Pt–Sn nanoalloys.
(5) Segregation of Sn leads to a depletion of Sn in the bulk of the supported Pt–Sn nanoalloy. It leads to further extraction of Sn2+ from the Sn–CeO2 film until the thermodynamically stable bulk Pt/Sn stoichiometry is recovered. The extraction of Sn2+ stops completely as soon as the favorable surface and bulk Pt/Sn ratios of approximately 1.6 and 3 are reached.
This journal is © The Royal Society of Chemistry 2016 |