Structure, and thermal and mechanical properties of poly(propylene carbonate) capped with different types of acid anhydride via reactive extrusion

Guo Jiang*, Jian Feng, Mengdi Zhang, Shuidong Zhang* and Hanxiong Huang
Lab for Micro Molding and Polymer Rheology, The Key Laboratory of Polymer Processing Engineering of the Ministry of Education, South China University of Technology, Guangzhou 510640, PR China. E-mail: jiangguo@scut.edu.cn; starch@scut.edu.cn

Received 23rd July 2016 , Accepted 3rd November 2016

First published on 4th November 2016


Abstract

Three types of anhydride (maleic anhydride (MA), phthalic anhydride (PA) and pyromellitic dianhydride (PMDA)) were melt blended to end-cap poly(propylene carbonate) (PPC) by reactive extrusion. The effect of anhydride types on thermal, rheological, and mechanical properties of PPC was investigated. Results of FTIR spectra, Raman spectra and GPC indicate that the reaction mechanism between PPC with MA was different from PPC with PA and PMDA. During the extrusion processing in the presence of MA, end capping occurs for the free polymer ends and reduces chain depolymerization in a conventional way. For PA and PMDA, some non-covalent interaction may exist and it is deduced that hydrogen bonding may occur. In addition, TGA results show that the thermal degradation temperature of PPC could be improved by adding three types of anhydride, and the T−5% of PPC–PMDA was the highest and increased by 26.3 °C. The tensile strength and Young's modulus of PPC is also improved with the addition of MA, PA and PMDA. Moreover, the value of elongation at break of all end-capped PPC still can remain higher than 1000%.

1. Introduction

The catalytic transformation of CO2 into biodegradable poly(propylene carbonate) (PPC) by alternating copolymerization with propylene oxide (PO) has drawn much attention in both academic and industrial fields.1 PPC can be used in various areas such as packing materials, adhesives and biomedical materials. However, the main drawback of PPC is its low decomposition temperature and low glass transition temperature (Tg), which limit its wide industrial applications. Many efforts have been devoted to increase its applications, including physical and chemical modification. Physical methods, such as the blending of PPC with other biodegradable polymers,2–8 are very effective since they are relatively simple processes for PPC modification. Many chemical methods are used such as polymerizing with additional backbone components,9–13 cross-linking,14–17 and hydrogen-bonding.18–22

It is important to have a fundamental understanding of PPC degradation pathways to improve the thermal properties of PPC. The backbone structure plays a major role in the thermal decomposition of PPC. The thermal decomposition occurs via two mechanisms: main chain random scission and unzipping degradation (shown in Scheme 1). Adding end-capping agent is an effective way, which could react with terminal hydroxyl groups of PPC and then inhibit the unzipping reaction.23–26 It is known that maleic anhydride (MA) acts as a kind of reactive anhydride, which is often used in polymer reactive extrusion system. Yao et al.27 found that when a small amount of MA was melt blended to end-cap PPC, it could improve the thermal stability and mechanical properties of PPC. Barreto et al.28 prepared the blends of PPC modified with MA and pyromellitic dianhydride (PMDA) by melt mixing. They found that the use of PMDA is advantageous over MA considering the improvement of the thermal stability. The result suggested that when the content of PMDA is 1 wt%, the T−5% of PPC is increased by nearly 23 °C. In our earlier work,29 we modified PPC with MA via a reactive extrusion. When MA content was lower than 1 phr, PPC was successfully end-capped with MA, while MA acted as an external lubricant during reactive extrusion more than an end-capped reagent at higher MA content.


image file: c6ra18713g-s1.tif
Scheme 1 PPC form five-member cycles ending via the terminal hydroxyl group.

Based on the previous work on structure and property of PPC capped with MA, addition of benzene is thought to be useful to increase the property of PPC. Phthalic anhydride (PA) and PMDA are two types of anhydride with benzene and their chemical structures are shown in Fig. 1. PA is an organic compound with the formula C6H4(CO)2O and it is the anhydride of phthalic acid. PMDA is an organic compound with the formula C6H2(C2O3)2 and it is the double carboxylic acid anhydride. So in this work, three types of anhydride (MA, PA and PMDA) were chosen to end-cap PPC by reactive extrusion. Structure of end-capped PPC was characterized by FTIR and Raman spectra. The properties were measured by thermogravimetry analysis and mechanical property testing. Effect of anhydride type on structure, thermal and mechanical properties was analyzed. Finally, the melt reaction mechanism of end-capped PPC in presence of different type end-capping reagents was proposed.


image file: c6ra18713g-f1.tif
Fig. 1 The structure for maleic anhydride (a), phthalic anhydride (b), and pyromellitic dianhydride (c).

2. Experimental

2.1 Materials

PPC used in this work was provided by Henan Tianguan Group Co., Ltd, China. End-capping reagents of MA, PA and PMDA were commercially purchased from Tianjin Kemiou Chemical Reagent Co. Ltd. China, Sinopharm Chemical Reagent Co. Ltd. China, Sinopharm Chemical Reagent Co. Ltd. China. All these commercial chemicals were used as received without further purification.

2.2 Sample preparation

PPC and the end-capping reagents were melting mixed by a co-rotating twin-screw extruder (Nanjing Cheng Meng chemical machine co., LTD, SHJ-26). Before being used, PPC was dried in a vacuum oven at 60 °C for 24 h. The screw rotating speed was set at 80 rpm and the temperature profiles were set at 110–120–120–120–120–120–120 °C from the hopper to die. Extrudate was cooled in water and then pelletized. Based on our earlier research work,29 the content of end-capping reagents was set at 1.0 phr and the end-capped PPC was denoted as PPC–MA1, PPC–PA1, and PPC–PMDA1, respectively. The reacted end-capped PPC were dried in the vacuum oven at 60 °C for 12 h before being compression-molded into slices (100 × 100 × 1 mm3). The molding temperature was set at 170 °C. These slices were used to characterize the properties.

2.3 Characterization

2.3.1 Fourier transform infrared spectroscopy (FTIR). In order to completely remove unreacted end-capping reagents, end-capped PPC was purified by ethanol in a Soxhlet extractor for 24 h. The temperature was set at 86 °C. The purified end-capped PPC was dried under vacuum at 60 °C for 24 h. Purified and well-dried samples were prepared by directly casting 1 wt% chloroform solutions on KBr pellets and evaporating the solvent slowly. Then the prepared samples were characterized by FTIR spectroscopy (Vector-22, Switzerland, Bruke Company) in the spectral region 400–4000 cm−1.
2.3.2 Raman spectroscopy. The Raman spectra were obtained from a LabRAM Aramis Raman spectrometer. An exciting wavelength of 632.8 nm was provided by a 5.5 mW He–Ne laser source. The laser was focused to a 1 μm diameter spot on the purified and well-dried anhydrides end-capped PPC samples. The Raman spectra were collected and recorded using a Peltier cooled charge-coupled device detector with an exposure time of about 3 s. Then the wavenumber was 3500–500 cm−1.
2.3.3 Gel permeation chromatography (GPC). GPC tests were carried out at 25 °C on Waters 515 system equipped with Waters 2414 refractive index detector. Tetrahydrofuran (HPLC grade) was used as a solvent and an eluent at a flow rate of 2 mL min−1. Number-average molecular weight (Mn) and weight-average molecular weight (Mw) were determined from calibration plots constructed with polystyrene standards. The dilute PPC solution was filtrated carefully to remove possible insoluble gel before it was injected into GPC column.
2.3.4 Thermogravimetric analyses (TGA). TGA was performed by using a TGA 209 from Netzsch to investigate the thermal decomposition of PPC materials. The test temperature was from room temperature to 600 °C at a heating rate of 10 °C min−1 under nitrogen atmosphere (30 mL min−1). The mass change versus temperature curves was recorded.
2.3.5 Dynamic mechanical analysis (DMA). Dynamic mechanical properties of the samples were measured in tensile mode at a fixed frequency of 1 Hz using a dynamic mechanical analyzer (DMA; 242C, Netzsch, Germany) under nitrogen atmosphere. The scanning temperature ranged from 0 to 80 °C at a heating rate of 3 °C min−1.
2.3.6 Rheological measurement. Rheological properties were measured by a rotational rheometer (Gemini 200 Rheometer System, Bohlin co., UK). For dynamical rheological measurement, the pellets of pure PPC and end-capped PPC were firstly compression molded as disks with a size of 25 × 1.5 mm. Oscillatory frequency sweep was performed under a frequency from 0.01 to 100 s−1. The storage modulus (G′), loss modulus (G′′) and complex viscosity (η*) were measured under the frequency (ω) sweep experiment. The experimental temperature was set at 150, 160, 170 and 180 °C.

3. Results and discussion

3.1 Structure and molecular weight of PPC reacted with different types of acid anhydride

The thermal degradation of PPC occurs via two mechanisms, polymer unzipping and random chain scission. End capping with acid anhydride may inhibit the chain scission and unzipping by changing the terminal hydroxyl groups of PPC. In order to investigate the interaction between PPC and acid anhydride, structure of reacted PPC was characterized by FTIR and Raman spectroscopy, shown in Fig. 2 and 3, respectively. Fig. 2 shows the representative FTIR spectra of raw PPC material and end-capped PPC by different anhydrides (MA, PA and PMDA) with the content of 1 phr. The spectra of end-capped PPC with different anhydrides have characteristic FTIR absorptions at 1748 cm−1 (C[double bond, length as m-dash]O), 1237 cm−1 (C–O), 788 cm−1 and 1071 cm−1 (C–O–C). Shown from Fig. 2, the peak at 1640 cm−1 can be found at the FTIR spectra of PPC–MA1, which is responsible for the C[double bond, length as m-dash]C stretching vibration. This C[double bond, length as m-dash]C stretching vibration is a characteristic and sensitive bond for the end-capping reaction. The similar phenomenon had been reported by Hao et al.16 It is illustrated from FTIR results that PPC was successfully end-capped by MA.
image file: c6ra18713g-f2.tif
Fig. 2 FTIR spectra of raw PPC material and end-capped PPC by different acid anhydrides with content of 1 phr.

image file: c6ra18713g-f3.tif
Fig. 3 Raman spectra of pure PPC, PPC–PMDA1 (a), (b) and PMDA (c).

For PPC–PA1 and PPC–PMDA1, the FTIR spectra are similar as that of raw PPC material. The characteristic peak at 3100 cm−1 is not obvious and may be covered in the infrared test. Considering Raman peak based on benzene with a strong fluorescent effect is more obvious, Raman spectra are used to further investigate the reactive mechanism of PPC and PA or PMDA. Owing to similar molecular structure of PA and PMDA, Raman test was conducted on sample of PPC–PMDA1. The Raman spectra of PPC, PPC–PMDA1, and PMDA are shown in Fig. 3. Barreto et al.28 used pyromellitic dianhydride in PPC matrix to improve the stiffness, the thermal stability and decreases the melt viscosity of PPC, which can be explained by mechanisms of conventional end capping, branching due to the tethering of more than two PPC chains to a single anhydride molecule, and the influence of non-covalent interactions. Gao et al.1 reported a one-step strategy for pseudo-interpenetrating PPC networks by direct terpolymerization of CO2, PO and PMDA. In this work, for pure PMDA, there exists a clear characteristic peak at 766.9 cm−1, shown in Fig. 3(c). When Raman spectra of PPC and PPC–PMDA1 are scaled up, a faint characteristic peak at 766.9 cm−1 in PPC–PMDA1 can be observed, shown from Fig. 3(b), which illustrates that there exists an interaction between PPC and PMDA. The characteristic peak is not strong, partly owing to the lower content of PMDA in reactive extrusion of PPC and PMDA. From IR spectrum analysis, probably there is no obvious capping reaction taken place between PMDA and PPC. The interaction between PPC and PMDA or PA may be the non-covalent interaction.

In order to understand structure difference of PPC reacted with different acid anhydrides, the materials were further studied by GPC measurements. The number-average molecular weight (Mn), weight-average molecular weight (Mw) and the molecular weight distribution (Mw/Mn) of pure PPC and PPC–MA1, PPC–PA1, PPC–PMDA1 are summarized in Table 1. One can clearly see that the molecular weight of pure PPC increased after the addition of MA, PA and PMDA. In the meantime, the value of Mw/Mn decreases slightly. The weight-average molecular weight of PPC-MA1 increases from 83[thin space (1/6-em)]602 (Mw of pure PPC) to 118[thin space (1/6-em)]924, which indicates that MA serves as an end-capping agent in the processing of reaction extrusion with PPC. The reaction mechanism is end-capping reaction between PPC and MA, leading to higher molecular weight due to the chain extension. For PPC–PA1 and PPC–PMDA1, the weight-average molecular weight increases to 86[thin space (1/6-em)]381 and 90[thin space (1/6-em)]394 and the increase is slight. This is agreed with the results of FTIR and Raman spectra, chain extension between PPC and PA or PMDA is not the main reaction mechanism.

Table 1 Molecular weight and molecular weight distribution of pure PPC, PPC–MA1, PPC–PA1 and PPC–PMDA1
Samples Mn Mw Mw/Mn
Pure PPC 33[thin space (1/6-em)]820 83[thin space (1/6-em)]602 2.472
PPC–MA1 49[thin space (1/6-em)]691 118[thin space (1/6-em)]924 2.393
PPC–PA1 35[thin space (1/6-em)]488 86[thin space (1/6-em)]381 2.434
PPC–PMDA1 37[thin space (1/6-em)]415 90[thin space (1/6-em)]394 2.415


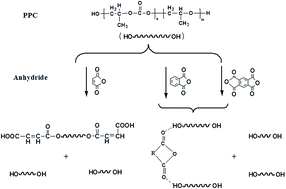
Shown from results of FTIR spectra, Raman spectra and GPC, it replies that the reactive mechanism of MA and PA or PMDA probably is different. Based on the structural characterization, the reactive mechanism between PPC and anhydrides is proposed, shown in Scheme 2. With any type of acid anhydride, random chain scission occurs and new hydroxyl end groups are generated, owing to the thermal degradation during extrusion at temperature higher than melt temperature. Then the molecular weight and viscosity may be decreased for the random chain scission. During the extrusion processing in the presence of MA, end capping takes place for the free polymer ends and reduces chain depolymerization in the conventional way. Chain extension for PPC and MA system in the extrusion reaction occurs. For PA and PMDA, they have aromatic rings and some non-covalent interaction may be existed when they are reactive extruded and hydrogen bonding may be formed.


image file: c6ra18713g-s2.tif
Scheme 2 Proposed reaction of PPC with MA, PA and PMDA.

3.2 Effect of anhydride on mechanical and thermal properties of end-capped PPC

Tensile strength, elongation at break, and Young's modulus of pure PPC and PPC–MA1, PPC–PA1 and PPC–PMDA1 are shown in Fig. 4. The tensile strength and Young's modulus of PPC is improved after the addition of MA, PA and PMDA. This is related with the increase of the molecular weight for reactivated PPC. Elongation at break of end-capped PPC decreased with the adding of the acid anhydrides. However, these end-capped PPC can still remain a higher elongation at break. The value of elongation at break of all end-capped PPC is over 1000%, which can be used in the application.
image file: c6ra18713g-f4.tif
Fig. 4 Tensile strength, elongation at break and Young's modulus for pure PPC, PPC–MA1, PPC–PA1 and PPC–PMDA1.

Fig. 5 shows TGA curves of pure PPC and PPC–MA1, PPC–PA1, PPC–PMDA1 and the 5%, 50%, 95% weight loss temperatures (T−5%, T−50%, T−95%) are listed in Table 2. As it can be seen, the TGA parameters show the expected increase in the thermal stability for PPC after the addition of MA, PA, and PMDA. Shown from Table 2, the T−5% of PPC–PMDA1 was the highest and increased by 26.3 °C, compared with that of pure PPC. For PPC–MA1 composites, mechanism of thermal stability improving is that MA brings an end-capping reaction with hydroxyl group of PPC and prevents the chain unzipping degradation. For PPC–PA1 and PPC–PMDA1 composites, the hydroxyl ends of PPC could react with the carboxyl of PA and PMDA to form hydrogen bonding and at the same time, the reaction activity of hydroxyl groups of PPC also could be inhibited. In addition, PMDA serves as an aromatic dicarboxylic anhydride. PMDA not only contains a benzene ring but also has more carboxyl groups. Then the thermal stability of PPC–PMDA1 can be improved more effectively.


image file: c6ra18713g-f5.tif
Fig. 5 TGA curves of pure PPC, PPC–MA1, PPC–PA1 and PPC–PMDA1.
Table 2 Decomposition temperatures corresponding to mass loss for pure PPC, PPC–MA1, PPC–PA1 and PPC–PMDA1
Samples T−5%/°C T−50%/°C T−95%/°C
Pure PPC 210.5 295.6 350.5
PPC–MA1 236.1 293.8 353.6
PPC–PMDA1 236.8 305.0 356.9
PPC–PA1 231.1 294.8 352.7


The enhancement of mechanical properties with temperature can be further demonstrated by the measurement of dynamic mechanical properties. Fig. 6(a) shows the dynamic storage modulus (E′) of pure PPC, PPC–MA1, PPC–PA1 and PPC–PMDA1 over a temperature range of 0–80 °C. At the range of lower temperature, all samples were in the glassy region and E′ values decreased slowly with the temperature up to 15 °C. With the increase of temperature, PPC–MA1 exhibits best mechanical property, owing to its higher molecular weight. Moreover, it is shown from Fig. 6(a) that the storage modulus of PPC is enhanced by the addition of PA, PMDA at all the testing temperature range. It indicates that the stiffness of PPC is improved by the addition of PA, PMDA. This result agrees well with the above mechanical property results.


image file: c6ra18713g-f6.tif
Fig. 6 Dynamic mechanical properties of PPC, PPC–MA1, PPC–PA1, and PPC–PMDA1. (a) storage modulus (b) tan[thin space (1/6-em)]δ.

Fig. 6(b) presents the tan[thin space (1/6-em)]δ of pure PPC, PPC–MA1, PPC–PA1 and PPC–PMDA1 versus temperature. The plots of tan[thin space (1/6-em)]δ versus temperature show prominent peaks that correspond to the glass transition of polymer and the maximum value for each peak is used to define the glass transition temperature (Tg). It can be noted that the Tg of PPC is increased with the addition of MA, PA, PMDA. Furthermore, the Tg of PPC–MA1 is higher than that of PPC–PA1 and PPC–PMDA1. This result might due to the fact that the Mw of PPC–MA1 is much higher and MWD is smaller than PPC–PA1 and PPC–PMDA1. Therefore, the molecular chain mobility of PPC–MA1 is much lower than PPC–PA1 and PPC–PMDA1.

3.3 Rheological behavior of end-capped PPC by acid anhydride

Activation energy of viscous flow is considered as a sensitive parameter for investigating the molecular chain flexibility of polymer materials, which can be used to analysis the effect of temperature on the molecular chain motion. As it can be seen from results of FTIR, Raman and GPC (shown in Fig. 2, 3 and Table 1), the chain structure and molecular weight of end-capped PPC were greatly related with the types of anhydrides. In order to investigate effect of processing parameters on structure and thermal property of end-capped PPC, the Arrhenius equation η = AeEa/RT is used to calculate the flow activation energy of viscous flow, where η is the viscosity, A is the pre-exponential factor, Ea is the activation energy, R is the gas constant, and T is the temperature.

The viscosity of PPC and end-capped PPC was measured using a rotational rheometer. This kind of dynamic rheology testing is thought to be a preferential rheological method for investigating the structure of materials. The complex viscosity, storage modulus, and loss modulus can be recorded. To our knowledge, the rheological behavior of end-capped PPC has not been well-studied. In this work, the dynamic complex viscosity η* versus oscillatory frequency curves of pure PPC, PPC–MA1, PPC–PA1 and PPC–PMDA1 were plotted using dynamic frequency sweep test (f = 0.01–100 s−1) at 150, 160, 170, and 180 °C, shown in Fig. 7. For all samples, the complex viscosity is decreased with the increase of temperature and the materials exhibit shear thinning phenomena. At all of the testing temperature, end-capped PPC have a good processing property. In order to know effect of anhydride type on molecular weight, the compared complex viscosity versus frequency curves at 160 °C is shown in Fig. 8. As it can be seen from Fig. 8, the complex viscosity of PPC–PA1 and PPC–PDMA1 is a little larger than PPC–MA1. This is related with benzene group of PA and PMDA and the existent of benzene group may inhibit the flow of polymer melts.


image file: c6ra18713g-f7.tif
Fig. 7 Complex viscosity versus frequency curves for pure PPC (a), PPC–MA1 (b), PPC–PA1 (c) and PPC–PMDA1 (d) at different temperatures.

image file: c6ra18713g-f8.tif
Fig. 8 Complex viscosity versus frequency curves for PPC–MA1, PPC–PA1 and PPC–PMDA1 at 160 °C.

Activation energy of viscous flow can be calculated through linear regression of ln[thin space (1/6-em)]η* versus 1/T curves at different frequency, shown in Fig. 9. The slope of curves can be obtained and then the activation energy of viscous flow can be calculated using the Arrhenius equation. The calculated results are listed in Table 3. For all of the samples, the activation energy of viscous flow at high frequencies was smaller than that at lower frequencies. This illustrates that higher shearing rate during extrusion, i.e. higher screw rotating speed, will decrease the molecular weight of PPC. Pure PPC has the highest activation energy of viscous flow and the activation energy of PPC–PMDA1 is larger than that of PPC–MA1 and PPC–PA1 at the same frequency. The reason behind this might be that all anhydrides may act as acid catalyzer, leading to the hydrolysis of the ester group in PPC. Thus the short chain branches content increased, which enhanced the free movement of the end-capping PPC main chain. Compared with the molecular structure of MA, PA has one more benzene ring. This steal hindrance of PA is higher than that of MA. Further, the molecular structure of PMDA has one more anhydride bond than that of PA and theoretically PMDA have more reactivity points than PA. It is suggested that the anhydrides participate in a ‘healing’ reaction that remedies the molecular weight drop for the hydrides with aromatic rings. PA or PMDA can also act as a physical cross-link point, owing to the ‘healing’ reaction.


image file: c6ra18713g-f9.tif
Fig. 9 ln(complex viscosity) versus 1/T curves for pure PPC (a), PPC–MA1 (b), PPC–PA1 (c) and PPC–PMDA1 (d) at different frequencies.
Table 3 Activation energy of viscous flow of pure PPC, PPC–MA1, PPC–PA1 and PPC–PMDA1 at different frequencies
Samples Activation energy (kJ mol−1)
0.1 s−1 1 s−1 10 s−1 39.81 s−1 100 s−1
Pure PPC 108.47 100.84 75.63 61.07 57.51
PPC–MA1 91.07 85.19 60.97 46.21 41.84
PPC–PMDA1 98.58 90.61 65.22 50.30 45.97
PPC–PA1 95.56 90.23 66.15 49.94 46.89


4. Conclusions

In this work, maleic anhydride (MA), phthalic anhydride (PA) and pyromellitic dianhydride (PMDA) were used to end-cap PPC by reactive extrusion. Structure and properties of anhydride end-capped PPC were characterized by FTIR, Raman spectroscopy, GPC, TGA, and DMA. It is found that the reacting mechanism between PPC with MA was different from PPC with PA and PMDA. For MA, it is heated to produce the carboxyl group, and then end capping can occur between the carboxyl group and PPC. For PA and PMDA, it is suggested that the hydroxyl ends of PPC could form hydrogen bonding with the carboxyl of PA and PMDA. The molecular weight of PPC–MA, PPC–PA, PPC–PMDA is higher than that of pure PPC. MA can acts as a chain extender to increase the molecular weight of PPC. TGA parameters show the expected increase in the thermal stability for PPC after the addition of MA, PA, and PMDA. The tensile strength and Young's modulus of PPC is improved after the addition of MA, PA1 and PMDA. Moreover, the value of elongation at break of all end-capped PPC is over 1000%.

Acknowledgements

This work was supported by the National Natural Science Foundation of China (51573062), National Natural Science Foundation of Guangdong Province (2014A030313235), the Opening Project of The Key Laboratory of Polymer Processing Engineering, Ministry of Education, China.

References

  1. L. J. Gao and J. Y. Feng, J. Mater. Chem. A, 2013, 1, 3556–3560 CAS.
  2. D. Z. Yang and P. Hu, J. Appl. Polym. Sci., 2008, 109, 1635–1642 CrossRef CAS.
  3. X. F. Ma, P. R. Chang, J. G. Yu and N. Wang, Carbohydr. Polym., 2008, 71, 229–234 CrossRef CAS.
  4. J. Tao, C. J. Song, M. F. Cao, D. Hu, L. Liu, N. Liu and S. F. Wang, Polym. Degrad. Stab., 2009, 94, 575–583 CrossRef CAS.
  5. G. J. Chen, Y. Y. Wang, S. J. Wang, M. Xiao and Y. Z. Meng, J. Appl. Polym. Sci., 2013, 128, 390–399 CrossRef CAS.
  6. G. H. Yang, C. Z. Geng, J. J. Su, W. W. Yao, Q. Zhang and Q. Fu, Compos. Sci. Technol., 2013, 87, 196–203 CrossRef CAS.
  7. X. Y. Yun, J. X. Wu, Y. Wang, Z. L. Zhao, Y. Jin and T. Dong, J. Appl. Polym. Sci., 2016, 133, 42970–42978 CrossRef.
  8. S. W. Hwang, D. H. Park, D. H. Kang, S. B. Lee and J. K. Shim, J. Appl. Polym. Sci., 2016, 133, 43388 CrossRef.
  9. Y. F. Liu, K. L. Huang, D. M. Peng and H. Wu, Polymer, 2006, 47, 8453–8461 CrossRef CAS.
  10. P. F. Song, M. Xiao, F. G. Du, S. J. Wang, L. Q. Gan, G. Q. Liu and Y. Z. Meng, J. Appl. Polym. Sci., 2008, 109, 4121–4129 CrossRef CAS.
  11. S. Q. Liu, J. L. Wang, K. L. Huang, Y. F. Liu and W. K. Wu, Polym. Bull., 2011, 66, 327–340 CrossRef CAS.
  12. J. Geschwind, F. Wurm and H. Frey, Macromol. Chem. Phys., 2013, 214, 892–901 CrossRef CAS.
  13. Z. L. Li, W. Li, H. L. Zhang and L. S. Dong, Iran. Polym. J., 2015, 24, 861–870 CrossRef CAS.
  14. Y. H. Tao, X. H. Wang, X. J. Zhao, J. Li and F. S. Wang, J. Polym. Sci., Part A: Polym. Chem., 2006, 44, 5329–5336 CrossRef CAS.
  15. Y. S. Qin, Q. W. Ma, X. H. Wang, J. Z. Sun, X. J. Zhao and F. S. Wang, Polym. Degrad. Stab., 2007, 92, 1942–1947 CrossRef CAS.
  16. Y. P. Hao, H. H. Ge, L. J. Han, H. Y. Liang, H. L. Zhang and L. S. Dong, Polym. Bull., 2013, 29, 1991–2003 CrossRef.
  17. P. F. Song, X. D. Mao, X. F. Zhang, X. G. Zhu and R. M. Wang, RSC Adv., 2014, 4, 15602–15605 RSC.
  18. S. W. Peng, X. Y. Wang and L. S. Dong, Polym. Compos., 2005, 26, 37–41 CrossRef CAS.
  19. X. C. Ge, Q. Zhu and Y. Z. Meng, J. Polym. Sci., Part A: Polym. Chem., 2006, 99, 782–787 CAS.
  20. L. J. Chen, Y. S. Qin, X. H. Wang, X. J. Zhao and F. S. Wang, Polymer, 2011, 52, 4873–4880 CrossRef CAS.
  21. C. Y. Xing, H. T. Wang, Q. Q. Hu, F. F. Xu, X. J. Cao, J. C. You and Y. J. Li, Carbohydr. Polym., 2013, 92, 1921–1927 CrossRef CAS PubMed.
  22. L. Gu, Q. Y. Wu and H. B. Yu, Chin. J. Polym. Sci., 2015, 33, 838–849 CrossRef CAS.
  23. S. W. Peng, Y. X. An, C. Chen, B. Fei, Y. G. Zhuang and L. S. Dong, Polym. Degrad. Stab., 2003, 80, 141–147 CrossRef CAS.
  24. S. J. Pang, N. Xu, G. Xu, L. S. Pan, Q. Lin and X. Wang, J. Appl. Polym. Sci., 2013, 128, 2020–2029 CAS.
  25. J. J. An, Y. C. Ke, X. Y. Cao, Y. M. Ma and F. S. Wang, Polym. Chem., 2014, 5, 4245–4250 RSC.
  26. O. Phillips, J. M. Schwartz and P. A. Kohl, Polym. Degrad. Stab., 2016, 125, 129–139 CrossRef CAS.
  27. M. J. Yao, F. Mai, H. Deng, N. Y. Ning, K. Wang and Q. Fu, J. Appl. Polym. Sci., 2011, 120, 3565–3573 CrossRef CAS.
  28. C. Barreto, E. Hansen and S. Fredriksen, eXPRESS Polym. Lett., 2013, 7, 895–899 CrossRef CAS.
  29. J. Guo, J. Feng, S. D. Zhang and H. X. Huang, Ind. Eng. Chem. Res., 2014, 53, 14544–14551 CrossRef.

This journal is © The Royal Society of Chemistry 2016