Selective electrochemical detection of hydroquinone and catechol at a one-step synthesised pine needle-like nano-CePO4 modified carbon paste electrode

Yuan Dang, Yanyan Zhai, Lehui Yang, Zhenli Peng, Nan Cheng and Yuanzhen Zhou*
School of Science, Xi'an University of Architecture and Technology, No. 13, Yanta Road, Xi'an, Shaanxi Province, China. E-mail: zhouyuanzhen@xauat.edu.cn; zyz1289@126.com; Fax: +86 29 82202389; Tel: +86 29 82202389

Received 22nd July 2016 , Accepted 1st September 2016

First published on 1st September 2016


Abstract

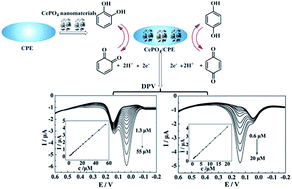
Pine needle-like CePO4 nanomaterials were synthesized by a method of precipitation. X-ray diffraction (XRD), scanning electron microscopy (SEM) and energy dispersive X-ray spectroscopy (EDS) were performed to characterize the nanomaterials. A sensitive and selective electrochemical sensor based on the as-synthesized nanomaterial modified carbon paste electrodes (CePO4/CPE) was successfully constructed and used to study the catalytic oxidation of catechol (CC) and hydroquinone (HQ). The experimental results indicated that the electrochemical responses were improved significantly. Linear calibration ranges were obtained as 0.20–40 μM for CC and 0.40–50 μM for HQ and the detection limits were 0.10 μM and 0.27 μM for CC and HQ, respectively. Moreover, differential pulse voltammetry (DPV) showed that the isomers could be detected sensitively and selectively at CePO4/CPE with peak-to-peak separation about 100 mV, which made possible the selective determination of HQ and CC. The lower detection limit of CC was 0.29 μM and 0.70 μM for HQ was achieved in their binary mixture. Meanwhile, the CePO4/CPE was successfully used for the determination of CC and HQ in local tap water samples and the recoveries were satisfactory. In addition, the proposed method displayed high reproducibility, repeatability, stability and anti-interference performance. Thus, this sensor has potential application in the fields of biomedical and environmental science.


1. Introduction

Hydroquinone (1,4-dihydroxybenzene, HQ) and catechol (1,2-dihydroxybenzene, CC) are two momentous isomers of dihydroxybenzene. They are widely used as chemicals and ubiquitously coexist in biological systems and the ecological environment.1,2 However, high concentrations of HQ can induce physical discomfort like headache, fatigue, tachycardia and decompensation, sometimes it could cause damage to kidneys, and even result in death.3,4 CC could induce DNA damage and cause cancer in humans.5,6 Therefore, they are regarded as environmental pollutants by the US Environmental Protection Agency (EPA) and the European Union (EU).7,8 Due to their high toxicity and low degradability in the ecological environment, they are harmful to human health and the environment. Therefore, there is an important significance to detect the content of CC and HQ. However, it is challenging to directly determine these two isomers selectively because of their similar structures and properties. Recently, diverse analytical methods have been reported for the determination of HQ and CC quantitatively, including spectrophotometry high-performance,9 chemiluminescence method,10 gas chromatography-mass spectrometry11 and electrochemical method.12 Among these methods, electrochemical methods are more preferable for the selective detection of HQ and CC because of its superiorities such as cheap instrument, fast response and high sensitivity.13–15

Currently, carbon paste electrode (CPE) has obtained increasing attention. It is a mixture of an electrically conducting graphite powder and a pasting liquid. It has been widely used in electrochemistry and electroanalytical chemistry as a working electrode because of the following advantages: wide potential range, easy preparation, convenient surface renewal, low residual current, porous surface and low cost.16,17 In comparison to unmodified electrodes, the chemically modified electrodes (CMEs) has been considered for the sensitive and selective electroanalytical determinations, such as for the detection of trace amounts of biologically important compounds.18–20 CMEs can catalyze the electrode reaction by significantly decreasing the required potential barrier. Generally, the modified materials were considered as the key factor to improve the selectivity and sensitivity of electroanalytical determinations.

In recent years, owing to the novel physical and chemical properties of nanometer materials, nanotechnology has been in a momentum of rapid development and nanometer materials were used as the modified materials to reinforce the selectivity and sensitivity of bare electrodes.21–23 Rare earth compounds, with a unique 4f shell of their ions, show special electronic, optical, and chemical characteristics, which have aroused much attention.24–26 CePO4 is a rare-earth compound that can be synthesised in different nanostructures. For example, Masuda et al. fabricated CePO4[thin space (1/6-em)]:[thin space (1/6-em)]Tb3+ nano films by SILAR method at room-temperature and the films were explored to obtain better luminescent properties related to redox sensibility.27 Bao et al. synthesized CePO4 and Ce0.95PO4[thin space (1/6-em)]:[thin space (1/6-em)]Tb0.05 with sphere-like nanostructures through the N,N-dimethylformamide-induced hydrothermal route, and the hexagonal Ce0.95PO4[thin space (1/6-em)]:[thin space (1/6-em)]Tb0.05 sphere-like nanostructures exhibited strong photoluminescence.28 Ye et al. prepared Au-doped cerium phosphate(Au/CePO4) nanowires (NWs) through combining hydrothermal and solvothermal methods, in which AuNP sizes and numbers could be tailored through varying chloroauric acid concentrations. The results displayed that Au(2)/CePO4-constructed biosensor had the most excellent electrochemical properties in comparison with CePO4- and other Au(X)/CePO4-constructed biosensors.29 In addition, Yu et al. synthesized Ce0.9Tb0.1PO4/LaPO4 core/shell nanorods via facile ultrasound irradiation method and the photoluminescence properties was studied.30 De Lima et al. synthesized cerium phosphate nanoparticles and its low photocatalytic activity was used for UV light absorption application in photo protection.31 These studies indicated that various morphological nanostructures of CePO4 possessed outstanding properties for its high surface area to volume ratios, which made it applied in many fields. For instance, CePO4 has been widely used to develop the efficient photoluminescent devices owing to the excellent photoluminescent properties.32 It is also utilized as catalyst,33 or as a container material of nuclear waste34 and photocatalytic material.35 Large specific surface area and outstanding chemical properties of CePO4 also strongly support the design of sensors and make it a suitable candidate for the modification of electrodes. However, based on our knowledge, there was no report on the application of this material for the selective determination of CC and HQ.

In this work, a sensitive electrochemical sensor has been constructed by coating CPE with CePO4 nanomaterials (CePO4/CPE). The performances of the sensor were studied by electrochemical impedance spectroscopy (EIS), cyclic voltammetry (CV) and differential pulse voltammetry (DPV). A sensitive and selective method for determination of CC and HQ was set up for routine analysis (Scheme 1).


image file: c6ra18601g-s1.tif
Scheme 1 Schematic representation of the fabrication process of the electrochemical sensor.

2. Experimental

2.1 Reagents and materials

All the reagents in this experiment were in analytical grade and used without further purification. Doubly distilled water was used throughout the whole studies. Ce(NO3)3·6H2O (AR) was purchased from Chengdu Kelong Chemical Reagent Factory. H3PO4 was purchased from Sichuan Xilong Chemicals Reagent Factory. Absolute ethyl alcohol, CC and HQ were brought from Tianjin Kemiou Chemical Reagent Factory (Tianjin, China). K3[Fe(CN)6] and K4[Fe(CN)6] were taken from Tianjin Hongyan Chemical Reagent Factory (Tianjin, China). 0.1 M PBS with different pH values (from 4 to 9) were prepared by mixing KH2PO4 and K2HPO4 stock solution and adjusting the pH with 1 M H3PO4 or 1 M KOH. All phosphate buffered saline (PBS) were used as the supporting electrolyte in the process of electrochemical measurements.

2.2 Apparatus

The magnetic stirring apparatus and vacuum drying oven were used to synthesize the CePO4 nanomaterials. The size and morphologies of the electrodes surface and materials were characterized by a Field emission scanning electron microscope (FESEM, Quanta 600FEG, America). The atomic composition of the nanostructured CePO4 was collected by X-ray diffraction (XRD, Rigaku D/Max 2550 VB +/PC). The values of pH were measured by Mettler Toledo Delta 320 pH meter (Shanghai, China). All the electrochemical experiments were performed with a standard three-electrode system connected to the CHI660D electrochemical workstation (Shanghai Chenhua Instruments Co., China), in which the bare or modified electrode were used as working electrode, a Pt wire as a counter electrode and a SCE as reference electrode. The three electrodes were immersed in a 50 mL beaker containing the detection solution and the solution was stirred using a magnetic stirrer. All the electrochemical experiments were carried out at room temperature.

2.3 Synthesis of CePO4 nanomaterials

The CePO4 nanomaterials were synthesized referring to the literature.36 In a typical procedure, a certain amount of 0.033 M Ce(NO3)3·6H2O and quantities of 0.2 M H3PO4 aqueous solutions were prepared respectively. The H3PO4 solution was dropwise added into the Ce(NO3)3·6H2O solution under vigorous stirring. After finishing the adding, stir for the extra 30 min at room temperature. After that, the obtained white precipitate was collected by centrifugation and washed with distilled water and ethanol for several times. Finally, the CePO4 nanomaterials were obtained by drying the sample at 60 °C for 24 h.

2.4 Preparation of the modified electrode

The bare carbon paste electrode (CPE) was prepared by hand-mixing graphite powder with paraffin oil at a ratio of 5[thin space (1/6-em)]:[thin space (1/6-em)]0.7 (w/w) in a mortar for 30 min. Then, the composite mixture was tightly packed into a plastic tube (Φ = 3.0 mm). A copper wire inserted into the carbon paste provided the electrical contact. The surface was polished on a piece of weighing paper. The CePO4 modified electrodes (CePO4/CPE) were prepared according to the methodology described in our previous literature.37 In brief, taking 2 mg CePO4 powder and equally divided into 4 parts. Then, gently rubbing the electrode over the samples to make some of the compounds adhere to the electrode surface and polished smoothly in situ. Finally, CePO4/CPE was obtained. Before every measurement, the modified electrode was treated in blank PBS (pH 7.0) by cycling in the potential range of −0.2 to 0.8 V at 100 mV s−1 until a stable blank background was obtained.

3. Results and discussion

3.1 Characterization of nanomaterials and the electrodes

The purity and crystal structures of the as-prepared sample were characterized by powder X-ray diffraction (XRD). Fig. 1 showed XRD patterns of the CePO4 standard card (curve a) and the as-prepared CePO4 sample (curve b). All the peaks for the sample were readily indexed to the hexagonal phase of CePO4 (JCPDS card no. 74-1889). No characteristic peaks of other impurities were observed, which indicated that the CePO4 crystal was obtained successfully.
image file: c6ra18601g-f1.tif
Fig. 1 XRD patterns of (a) CePO4 standard card, (b) CePO4 sample.

Field emission scanning electron microscope (FESEM), and energy dispersive X-ray spectroscopy (EDS) were utilized to assess the morphology and purity of the nanomaterials. The FESEM images of the as-prepared CePO4 were depicted in Fig. 2(A) and (B). As shown in Fig. 2(A), at the low magnification, CePO4 sample formed some uniform nanocluster with the average diameter of 1 μm. When increasing the magnification, it could be clearly observed that the nanoclusters were consisted of many pine needle-like nanomaterials with the uniform size that average diameter of about 50 nm and length up to about 400 nm (Fig. 2(B)). The results confirmed that we obtained pine needle-like nano-CePO4. Moreover, the EDS analysis on the as-prepared materials (Fig. 2(E)) suggested that the sample contained only the elements of Ce, O, P, and no other impurity peaks were detected in the spectrum, which further proved that we had successfully synthesized the high-purity CePO4 nanomaterials. The typical SEM images of the surface morphologies of bare CPE and modified electrode were displayed in Fig. 2(C) and (D). It could be seen that the surface of bare CPE (Fig. 2(C)) was regular flakes of graphite.


image file: c6ra18601g-f2.tif
Fig. 2 SEM images of the CePO4 sample (A) with low magnification and (B) with high magnification; SEM images of (C) bare CPE, (D) CePO4/CPE, and (E) EDS spectrum of the CePO4 sample.

However, when smeared the CePO4 nanomaterials on the surface of CPE, large quantities of nanomaterials could be observed (Fig. 2(D)). The surface morphologies comparison between bare CPE and nano-CePO4 modified electrodes confirmed that the nanostructured materials were successfully modified on the CPE surface, leading to the change in the surface activity of the CePO4/CPE.

3.2 Electrochemical characterization of modified electrode

The redox probe Fe(CN)63−/4−, which was sensitive to surface chemical, was utilized to evaluate the electrochemical properties of the electrodes. Fig. 3(A) showed the cyclic voltammograms of CPE (a) and CePO4/CPE (b) recorded in 5 mM Fe(CN)63−/4− (1[thin space (1/6-em)]:[thin space (1/6-em)]1) solution containing 0.1 M KCl. At bare CPE, a couple of relatively weak redox peaks were observed with peak-to-peak separation (ΔEp) of 580 mV. In comparison with the unmodified CPE, an obviously decreased ΔEp (227 mV) and remarkably enhanced current responses of Fe(CN)63−/4− were observed at CePO4/CPE, indicating that CePO4 could effectively increase the electron transfer rate between electrode surface and Fe(CN)63−/4−. The good performance of CePO4/CPE could be ascribed to the good conductivity and the large surface area of the pine needle-like CePO4 nanomaterials.
image file: c6ra18601g-f3.tif
Fig. 3 CVs (A) and Nyquist diagrams (B) of different electrodes in 0.1 M KCl solution containing 5 mM [Fe(CN)6]3−/4− (1[thin space (1/6-em)]:[thin space (1/6-em)]1). (a) CPE, (b) CePO4/CPE. Scan rate: 100 mV s−1.

For the further characterisation of the modified electrode, electrochemical impedance spectroscopy (EIS) was used. Generally, the linear part in the EIS represents the diffusion-limited process, while the semicircle portion corresponds to the electron transfer-limited process. The electron transfer resistance (Ret) at electrode surface is equal to the semicircle diameter. As shown in Fig. 3(B), the Ret of the bare GCE was 10 kΩ (curve a), indicating a huge interface electron transfer resistance. Moreover, the Ret value decreases after the bare electrode was modified with the CePO4 (CePO4/CPE) (108 Ω, curve b). Implying that the CePO4 nanomaterials were successfully assembled onto the bare CPE surface and the CePO4 nano-layer accelerated electron transfer of the electrochemical probe. The result was consistent with the above conclusion.

3.3 Electrochemical behaviour of CC

Fig. 4 showed the electrocatalysis of bare CPE and CePO4/CPE toward CC redox process by cyclic voltammetry (CV) in 0.1 M PBS (pH 7.0) with 10 μM CC at a scan rate of 100 mV s−1. As we can see, CC appeared a weak oxidation peak and no obvious reduction peak at bare CPE (curve a). The anodic peak potential (Epa) and cathodic peak potential (Epc) were at 506 mV and −85 mV, respectively, with the peak potentials separation (ΔEp = EpaEpc) of 591 mV. The results suggested that the electrochemical behaviour of CC on the bare CPE was a reversible reaction. While a couple of well-defined redox pair was obtained at CePO4/CPE (curve b), and the anodic and cathodic peaks were observed at 185 mV and 119 mV, respectively. The peak potentials separation (ΔEp = 66 mV) decreased to 11.2% that of the bare electrode. Moreover, the corresponding oxidation peak current response of CC was about 3.024 μA, which appeared dramatical enhancement than that of the bare electrode. The greatly enhanced peak current and smaller ΔEp strongly indicated that the CePO4 nanomaterials showed excellent catalytic ability towards the CC, which could be attributed to the good conductivity and larger specific surface area of pine needle-like CePO4.
image file: c6ra18601g-f4.tif
Fig. 4 CVs of (a) CPE and (b) CePO4/CPE in 0.1 M PBS (pH 7.0) containing 10 μM CC.

3.4 Effect of the scan rate and pH

To better understand the electrochemical mechanism of CC on CePO4/CPE, electrochemical parameters of CC on the modified electrode were further investigated. The effect of different scan rates to the CV response of 10 μM CC on CePO4/CPE was shown in Fig. 5(A). With the increase of scan rates from 60 mV s−1 to 1800 mV.s−1, the redox peak currents of CC increased linearly with the square root of scan rate. Fig. 5(B) presented the calibration curve of the response peak currents to the square root of different scan rates. And the linear regression equations were Ipa (μA) = 0.7885 ν1/2 − 5.595 (R2 = 0.9930, F = 2.693 × 10³, significance = 0.000) and Ipc (μA) = 0.7339 ν1/2 − 3.623 (R2 = 0.9994, F = 3.374 × 10⁴, significance = 0.000) where I and ν represented peak current and scan rate, respectively. According to the literature,38 a slope between 0.5 and 1.0 suggested that the process was simultaneously controlled by the diffusion and the adsorption process. This result manifested that the redox process of CC at CePO4/CPE was regulated by a diffusion accompanied with absorption process.
image file: c6ra18601g-f5.tif
Fig. 5 (A) CVs of 10 μM CC at CePO4/CPE in 0.1 M PBS (pH 7.0) at various scan rates: from 60 to 1800 mV s−1; (B) the plot of peak current (I) versus the square root of scan rate (ν1/2); (C) the relationship between the peak potential (E) and logarithm of scan rate (log[thin space (1/6-em)]ν).

Similarly, the oxidation peak potential shifted positively and the reduction peak potential shifted negatively with the increase of scan rate (Fig. 5(A)). For a quasi-reversible electrochemical process, the electron transfer coefficient (α), the number of electrons transferred (n) and the standard electron transfer rate constant (ks) of CC on the modified electrode were determined according to the following Laviron's equations:39

 
image file: c6ra18601g-t1.tif(1)
 
image file: c6ra18601g-t2.tif(2)
 
image file: c6ra18601g-t3.tif(3)

Fig. 5(C) showed the linear dependence of Epa and Epc of CC with the logarithm of scan rate (log[thin space (1/6-em)]ν). The linear regression equations were Epa = 0.0818 log[thin space (1/6-em)]ν + 0.0134 (R2 = 0.9833, F = 1.120 × 10³, significance = 0.000) and Epc = −0.0449 log[thin space (1/6-em)]ν + 0.2076 (R2 = 0.9905, F = 1.982 × 10³, significance = 0.000). According to eqn (1) and (2), the electron-transfer coefficient (α) and electron-transfer number (n) could be calculated to be 0.6453 and 2. According to eqn (3), the apparent heterogeneous electron transfer rate constant (ks) can be estimated to be 1.293 s−1 which was higher than that of other reported electrodes for CC.39–41 These results implied that CePO4 was a good mediator in the electrocatalytic oxidation process of CC, and it had effectively accelerated electron transfer rate of the CPE.

The electro-oxidation behaviour of CC is also influenced by electrolyte acidity because the proton participates in the electrode reaction. The effect of pH on the redox of CC at CePO4/CPE was carefully investigated by CV at the pH range of 4.0 to 9.0 in 0.1 M PBS containing 10 μM CC (shown in Fig. 6(A)). From the curve a in Fig. 6(B), it was noticeable that the anodic peak currents of CC increased with pH from 4.0 to 7.0. Whereafter, the peak currents gradually decreased with the increase of pH values at the range of 7.0 to 9.0. In addition, the anodic peak potentials of CC shifted negatively with increasing pH from 4.0 to 9.0 (curve b), and the linear regression equations could be expressed as follows: Epa = − 0.0509 pH + 0.5426 (R2 = 0.9967, F = 1.529 × 10³, significance = 0.000), indicating that the proton was directly involved in the oxidation of CC. The slope of the regression equation (50.9 mV pH−1) was very close to the theoretical value of 58 mV pH−1 as reported in other work,42 suggesting that the electrochemical oxidation of CC at CePO4/CPE was a reversible and equal number of proton-transfer and electron-transfer process. As the oxidation of CC was a two-electron transfer process, the number of protons involved in the oxidation process was also predicted to be two. The possible mechanism for the oxidation process of CC might be described as the following process: the two oxygen-hydrogen bonds of phenolic hydroxyl groups broke, and in the meanwhile CC lost two protons and two electrons and was converted into the corresponding quinoid structure (illustrated in Scheme 2).


image file: c6ra18601g-f6.tif
Fig. 6 (A) CVs of 10 μM CC at CePO4/CPE in 0.1 M PBS with different pH: 4–9; (B) effect of pH on the oxidation peak (a) current and (b) potential response of 10 μM CC.

image file: c6ra18601g-s2.tif
Scheme 2 Electrochemical reaction mechanism of CC.

3.5 The DPV techniques for determination of CC and HQ

To verify whether the CePO4/CPE was an efficient sensor for detecting CC, we employed differential pulse voltammetry (DPV), which is advantageous for reaching higher sensitivity by eliminating the non-faradaic currents that occur in CV. Fig. 7(A) showed the DPV response for CePO4/CPE in the absence and the presence of different concentrations of CC into 0.1 M PBS (pH 7.0). Obviously, the anodic current of CC, obtained at the potential of 0.14 V, increased linearly as the concentration of CC increasing, which was attributed to the enhanced electro-oxidation of CC with the accumulation of CC at the modified electrode. A linear calibration plot was made between the concentrations of CC and peak currents in the inset. The linear range of CC concentrations was from 0.2 to 40 μM and the regression equation was Ipa (μA) = 0.2593c (μM) + 0.0455 (R2 = 0.9993, F = 2.513 × 10⁴, significance = 0.000), and the detection limit was about 0.10 μM. Moreover, the electro-catalytic oxidation of HQ was showed in Fig. 7(B) and the currents were linearly related to concentrations over the range of 0.40–50 μM (Fig. 7(B), inset). The linear regression equation was Ipa (μA) = 0.0880c (μM) + 0.1331 (R2 = 0.9980, F = 7.621 × 10³, significance = 0.000). The detection limit was estimated to be about 0.27 μM for HQ. The linear range and detection limits for CC and HQ of this proposed method were compared with other differently modified electrodes in Table 1. The above results showed that the CePO4/CPE presented excellent analytical characteristics for the measurements of CC and HQ. The excellent electrocatalytic ability of the modified electrode could be ascribed to the good electron transfer capacity and the large surface area of the nanostructured CePO4. Moreover, as compared to the other surface modifiers reported in the listed literatures, the pine needle-like nano-CePO4 was synthesized in one-step and the utilized raw materials were low-cost and easy-to-obtain. Thus, the proposed method may be potentially applied for monitoring the concentration of CC and HQ.
image file: c6ra18601g-f7.tif
Fig. 7 (A) DPVs of the CePO4/CPE in 0.1 M PBS (pH 7.0) containing different concentrations of CC from 0.20 to 40 μM. The inset shows the plot of currents versus concentrations of CC. (B) DPVs of the CePO4/CPE in 0.1 M PBS (pH 7.0) containing different concentrations of HQ. Concentrations are from 0.40 to 50 μM. The inset shows the plot of currents versus concentrations of HQ.
Table 1 Comparison of analytical performances at various electrodes for the determination of HQ and CCa
Modified electrode Linear range (μM); Detection limit (μM) Reference
CC HQ CC HQ
a Notes: CMK-3: mesoporous carbon CMK-3; CNCs-RGO: carbon nanocages-reduced graphene oxide; IL-G: ionic liquids-functionalize graphene; PEDOT: poly(3,4-ethylenedioxythiophene).
CMK-3/GCE 0.50–35 1.0–30 0.10 0.10 43
CNCs-RGO/GCE 1.00–400 1.00–300 0.40 0.87 44
IL-G/GCE 1.00–300 2.00–400 0.85 1.00 45
PEDOT/CFE 0.52–4920 0.53–861 1.60 0.42 46
CePO4/CPE 0.20–40 0.40–50 0.10 0.27 This work


3.6 Analytical application for selective determination of CC and HQ

The excellent electrocatalytic activity of the modified electrode also promised the selective determination of HQ and CC. For proof-of-concept, the DPVs at the CePO4/CPE in 0.1 M PBS (pH 7.0) containing 5 μM of CC and different concentrations of HQ or containing 2 μM of HQ and different concentrations of CC were obtained (shown in Fig. 8). As displayed in Fig. 8(A), when fixing the concentration of CC at 5 μM, the anodic peak currents of HQ increased with the concentration of HQ, while those of CC stayed nearly constant. Moreover, the peak currents of HQ were found to be linearly proportional to the concentrations of HQ (IHQ (μA) = 0.0151 + 0.0818c (μM) (R2 = 0.9996, F = 4.418 × 10⁴, significance = 0.000)) at the concentration range of 1.3 to 55 μM (shown in the inset of Fig. 8(A)). The detection limit was estimated to be 0.70 μM. These results indicated that the oxidation of CC and HQ took place independently at the surface of CePO4/CPE. Furthermore, DPVs of CePO4/CPE towards different concentrations of CC were obtained at a constant HQ concentration of 2 μM and presented in Fig. 8(B). Similarly, there was a gradual increase in peak current with the increase of CC concentrations while the oxidation peak current of HQ kept almost constant. The anodic peak currents were linearly related to the concentrations of CC from 0.60 to 20 μM, and the linear regression equation was ICC (μA) = 0.1805 + 0.1982c (μM) (R2 = 0.9990, F = 1.228 × 10⁴, significance = 0.000) with a detection limit of 0.29 μM. All of the results strongly suggested that the proposed CePO4/CPE sensor could realize the sensitive and selective determination of CC and HQ without obvious interference to each other, providing possibilities for the selective or independent measurements of CC and HQ.
image file: c6ra18601g-f8.tif
Fig. 8 DPVs at the CePO4/CPE in 0.1 M PBS (pH 7.0), (A) containing 5 μM CC and different concentrations of HQ; (B) containing 2 μM HQ and different concentrations of CC. Insets: calibration curve of concentrations versus anodic peak currents of (A) HQ and (B) CC.

3.7 Reproducibility, repeatability and stability studies

The reproducibility, repeatability and stability are three important performance indexes of the electrochemical sensors. 10 CePO4/CPE were utilized to detect the same solution (10 μM of CC in PBS (pH 7.0)) by DPV and each electrode for 10 times to assess the reproducibility of the pine needle-like nano-CePO4 modified CPE. The relative standard deviation (RSD) of the average of the anodic currents in each copy was calculated to be less than 5%, verifying the good reproducibility of the proposed modified electrodes. One of the aforementioned electrodes was picked out to evaluate the working repeatability of CePO4/CPE via 20 successive measurements of 10 μM CC in PBS (pH 7.0) by DPV, and the RSD of the obtained anodic currents was calculated to be 3.5%, indicating that the proposed modified electrodes possessed good repeatability. After finishing the measurements, the modified electrodes were stored at 4 °C for a week. Then the sensors were applied to detect 10 μM of CC in PBS (pH 7.0) under the same conditions and the DPV results revealed that the long-time stored CePO4/CPE retained 95% of their original activity and exhibited excellent response to CC, indicating the good stability of CePO4/CPE.

3.8 Interference study

In order to evaluate the selectivity of the proposed analysis method, CC (5 μM) and HQ (2 μM) in 0.1 M PBS (pH 7.0) were detected by DPV in the existence of several common interfering substances. The spike/recovery test was carried out to evaluate the anti-interference performance of the CePO4/CPE. In details, a certain amount of the interfering substances was separately added into the CC and HQ solution and the anodic currents of CC and HQ obtained in the absence and presence of the interfering substance were contrasted to calculate the recovery of CC and HQ. The results, summarized in Table 2, showed that the recoveries of CC and HQ in the presence of 100-fold of Na+, Mg2+, Ca2+, NO3−, SO42−, Cl, 100-fold of glycine, isoleucine, alanine, threonine and 100-fold of glucose, fructose were in the range of 96.67–103.5% (signal change below 5%), implying that the proposed modified electrode possessed excellent anti-interference ability and good selectivity.
Table 2 The influence of different distractors on the determination of CC
Interfering substance (500 μM in the solution) Recovery range of CC in each species (%) Recovery range of HQ in each species (%) Absolute value of relative error
Inorganic ions (Cu2+, Ca2+, Na+, Mg2+, Br, NO3−, Cl, SO42−) 97.77–101.2 99.32–101.1 <5%
Amino acid (glycine, isoleucine, alanine, threonine) 97.32–103.5 97.18–101.5 <5%
Sugar (glucose, fructose) 101.6–102.5 96.67–97.20 <5%


3.9 Real sample analysis

In order to further evaluate the practical applicability of the pine needle-like nano-CePO4 modified CPE for the detection of CC and HQ, local tap water samples, collected in the laboratory and used without further treatment, were used as real samples for the quantitative analysis. For the unknown concentrations of CC and HQ in the tap water, the spike/recovery test was implemented. Certain amount of CC and HQ was separately added into the tap water samples. The concentration of CC and HQ in each sample was determined by the proposed electrode by DPV and calculated via interpolation of the anodic currents of the water samples against the established linear regression equations of CC and HQ. The obtained recoveries, summarized in Table 3, were in the ranges of 95.5–98.5% and 96.7–98.3% for CC and HQ, respectively, demonstrated the excellent applicability and reliability of the proposed method with the satisfactory recoveries.
Table 3 Recoveries of CC and HQ in tap water samples (n = 5, confidence 95%, t = 2.78)
Sample Spiked (μM) Found (μM) Recovery (%)
CC HQ CC HQ CC HQ
Tap water 5 5 4.77 ± 0.02 4.84 ± 0.05 95.5 ± 0.5 96.7 ± 0.7
20 20 19.7 ± 0.02 19.6 ± 0.08 98.5 ± 0.1 98.3 ± 0.5


4. Conclusion

A one-step precipitation method was used to prepare the CePO4 nanomaterials and a simple and sensitive electrochemical analytical sensor for the selective determination of HQ and CC had been developed by employing the pine needle-like CePO4 on the carbon paste electrode (CPE). A well-defined peak and the significant increase of peak currents of CC (10 μM) were observed at the CePO4/CPE, owing to the excellent conductivity and the higher specific surface area of nanostructured CePO4. The CePO4 modified electrode also presented two well-distinguished anodic peaks of HQ and CC, indicating that the selective determination of HQ and CC was possible. Moreover, lower detection limit and wider linear range were obtained on the CePO4/CPE. Meanwhile, the CePO4/CPE was successfully used for the determination of CC and HQ in local tap water samples. This simple, cheap and disposable electrochemical sensor will potentially be applied to the multi-components analysis in environmental control and chemical industry.

Acknowledgements

This work was supported by the Shaanxi Provincial Natural Science Foundation (No. 2014JM2041) and the Open Foundation of Key Laboratory of Synthetic and Natural Functional Molecule Chemistry of Ministry of Education (No. 338080044), the Shaanxi Provincial Education Department Foundation (No. 2013JK0625, 16JK1446).

References

  1. R. Borraccino, M. Kharoune, R. Giot, S. N. Agathos, E. J. Nyns, H. P. Naveau and A. Pauss, Water Res., 2001, 35, 3729 CrossRef CAS PubMed.
  2. F. J. Enguita and A. L. Leitão, BioMed Res. Int., 2013, 2013, 145 Search PubMed.
  3. M. Matsumoto, S. Masumori, M. Hirata-Koizumi, A. Ono, M. Honma, K. Yokoyama and A. Hirose, Mutat. Res., Genet. Toxicol. Environ. Mutagen., 2014, 775–776, 94 CrossRef CAS PubMed.
  4. D. McGregor, Crit. Rev. Toxicol., 2007, 37, 887 CrossRef CAS PubMed.
  5. G. Barreto, D. Madureira, F. Capani, L. Aon-Bertolino, E. Saraceno and L. D. Alvarez-Giraldez, Environ. Mol. Mutagen., 2009, 50, 771 CrossRef CAS PubMed.
  6. E. Cavalieri and E. Rogan, Ann. N. Y. Acad. Sci., 2006, 1089, 286 CrossRef CAS PubMed.
  7. K. Y. He, X. S. Wang, X. H. Meng, H. T. Zheng and S. I. Suye, Sens. Actuators, B, 2014, 193, 212 CrossRef CAS.
  8. M. Zhong, Y. L. Dai, L. M. Fan, X. J. Lu and X. W. Kan, Analyst, 2015, 140, 6047 RSC.
  9. Y. N. Ni, Z. Z. Xia and S. Kokot, J. Hazard. Mater., 2011, 192, 722 CrossRef CAS PubMed.
  10. L. J. Zhao, B. Q. Lv, H. Y. Yuan, Z. D. Zhou and D. Xiao, Sensors, 2007, 7, 578 CrossRef CAS.
  11. S. C. Moldoveanu and M. Kiser, J. Chromatogr. A, 2007, 1141, 90 CrossRef CAS PubMed.
  12. L. Y. Liu, Z. Ma, X. H. Zhu, R. H. Zeng, S. L. Tie and J. M. Nan, Anal. Methods, 2016, 8, 605 RSC.
  13. Z. Guo, Y. Lu, J. Li, X. F. Xu, G. Q. Huang and Z. Y. Wang, Anal. Methods, 2014, 6, 8314 RSC.
  14. X. Y. Wang, M. Xi, M. M. Guo, F. M. Sheng, G. Xiao, S. Wu, S. Uchiyamab and H. Matsuurab, Analyst, 2016, 141, 1077 RSC.
  15. W. X. Zhang, J. Z. Zheng, Z. Q. Lin, L. Zhong, J. G. Shi, C. Wei, H. Q. Zhang, A. Y. Hao and S. R. Hu, Anal. Methods, 2015, 7, 6089 RSC.
  16. E. Menart, V. Jovanovski and S. B. Hočevar, Electrochem. Commun., 2015, 52, 45 CrossRef CAS.
  17. M. Elyasi, M. A. Khalilzadeh and H. Karimi-Maleh, Food Chem., 2013, 141, 4311 CrossRef CAS PubMed.
  18. M. M. Foroughi, M. Noroozifar and M. Khorasani-Motlagh, J. Iran. Chem. Soc., 2015, 12, 1139 CrossRef CAS.
  19. A. A. Ensafi, F. Rezaloo and B. Rezaei, Sens. Actuators, B, 2016, 231, 239 CrossRef CAS.
  20. M. Bijad, H. Karimi-Maleh and M. A. Khalilzadeh, Food Anal. Methods, 2013, 6, 1639 CrossRef.
  21. M. Santhiago, C. S. Henry and L. T. Kubota, Electrochim. Acta, 2014, 130, 771 CrossRef CAS.
  22. J. Z. Huang, Q. Zeng and L. S. Wang, Electrochim. Acta, 2016, 206, 176 CrossRef CAS.
  23. J. Manokaran, R. Muruganantham, A. Muthukrishnaraj and N. Balasubramanian, Electrochim. Acta, 2015, 168, 16 CrossRef CAS.
  24. T. D. Rao, T. Karthik and S. Asthana, J. Rare Earths, 2013, 31, 370 CrossRef CAS.
  25. K. Kawaguchi, T. Yamaguchi, T. Omata, T. Yamashita, H. Kawazoe and J. Nishii, Phys. Chem. Chem. Phys., 2015, 17, 22855 RSC.
  26. Y. G. Yang, Mater. Sci. Eng., B, 2013, 178, 807 CrossRef CAS.
  27. M. Masuda, M. Hagiwara and S. Fujihara, J. Ceram. Soc. Jpn., 2016, 124, 37 CrossRef CAS.
  28. J. R. Bao, X. W. Zhu, Y. Liu, W. X. Li and R. B. Yu, Mater. Lett., 2014, 124, 97 CrossRef CAS.
  29. C. Ye, H. Guo, M. H. Zhang, H. G. Zhu, J. Q. Hu, X. D. Lai and A. Q. Li, Mater. Lett., 2014, 131, 141 CrossRef CAS.
  30. W. Y. Yu, G. L. Li and L. Zhou, J. Rare Earths, 2010, 28, 171 CrossRef CAS.
  31. J. F. de Lima and O. A. Serra, Dyes Pigm., 2013, 97, 291 CrossRef.
  32. P. F. Xu, R. B. Yu, C. R. Wang, X. C. Yan, D. Wang, J. X. Deng, J. Chen and X. R. Xing, J. Nanosci. Nanotechnol., 2013, 13, 1498 CrossRef CAS PubMed.
  33. L. N. Wang, F. L. Yuan, X. Y. Niu, C. H. Kang, P. Y. Li, Z. B. Li and Y. J. Zhu, RSC Adv., 2016, 6, 40175 RSC.
  34. J. M. Montel, B. Glorieux, A. M. Seydoux-Guillaume and R. Wirth, J. Phys. Chem. Solids, 2006, 67, 2489 CrossRef CAS.
  35. V. Klochkov, J. Photochem. Photobiol., A, 2015, 310, 128 CrossRef CAS.
  36. P. Pusztai, T. Simon, Á. Kukovecz and Z. Kónya, J. Mol. Struct., 2013, 1044, 94 CrossRef CAS.
  37. Y. Z. Zhou, Z. L. Peng, X. Cheng, W. M. Tang and L. H. Yang, J. Electrochem. Soc., 2015, 162, B298 CrossRef CAS.
  38. E. Laviron, J. Electroanal. Chem. Interfacial Electrochem., 1979, 101, 19 CrossRef CAS.
  39. K. J. Huang, L. Wang, Y. J. Liu, T. Gan, Y. M. Liu, L. L. Wang and Y. Fan, Electrochim. Acta, 2013, 107, 379 CrossRef CAS.
  40. H. S. Yin, Q. M. Zhang, Y. L. Zhou, Q. Ma, T. Liu, L. S. Zhu and S. Y. Ai, Electrochim. Acta, 2011, 56, 2748 CrossRef CAS.
  41. Y. H. Huang, J. H. Chen, L. J. Ling, Z. B. Su, X. Sun, S. R. Hu, W. Weng, Y. Huang, W. B. Wu and Y. S. He, Analyst, 2015, 140, 7939 RSC.
  42. J. S. Huang, X. P. Zhang, L. M. Zhou and T. Y. You, Sens. Actuators, B, 2016, 224, 568 CrossRef CAS.
  43. J. J. Yu, W. Du, F. Q. Zhao and B. Z. Zeng, Electrochim. Acta, 2009, 54, 984 CrossRef CAS.
  44. Y. H. Huang, J. H. Chen, X. Sun, Z. B. Su, H. T. Xing, S. R. Hua, W. Weng, H. X. Guo, W. B. Wu and Y. S. He, Sens. Actuators, B, 2015, 212, 165 CrossRef CAS.
  45. C. F. Wang, Y. J. Chen, K. L. Zhuo and J. J. Wang, Chem. Commun., 2013, 49, 3336 RSC.
  46. Y. H. Song, T. Yang, X. F. Zhou, H. T. Zhen and S. I. Suye, Anal. Methods, 2016, 8, 886 RSC.

This journal is © The Royal Society of Chemistry 2016