DOI:
10.1039/C6RA18530D
(Paper)
RSC Adv., 2016,
6, 90537-90546
Mesoporous iron oxide nanowires: synthesis, magnetic and photocatalytic properties†
Received
21st July 2016
, Accepted 5th September 2016
First published on 15th September 2016
Abstract
A surfactant- and template-free approach is described for the synthesis of mesoporous α-Fe2O3, Fe3O4 and α-Fe nanowires (NWs). In this approach, α-FeOOH NWs (length 550 nm and diameter 30 nm) were first prepared by hydrolysis of FeCl3. On subsequent thermal treatment in a fluidized bed reactor in the presence of a forming gas (Ar 93% + H2 7%), α-FeOOH transformed to mesoporous NWs of ɑ-Fe2O3, Fe3O4 and ɑ-Fe by controlling the process parameters such as reaction time and temperature. The obtained NWs of α-Fe2O3, Fe3O4 and α-Fe were ferromagnetic at room temperature with a coercive field (Hc) of 412, 583 and 628 Oe respectively. The aligned NWs showed 1.6 to 2 times-enhanced remanence in the parallel direction relative to the perpendicular direction due to magnetic anisotropy. These mesoporous magnetic NWs with a high specific surface area (82 m2 g−1 for α-Fe2O3 NWs) were used in photocatalysis due to the high adsorptivity of three probe dye molecules. The as-prepared α-Fe2O3 NWs exhibited only modest photocatalytic activity; however, the catalytic activity could be further enhanced by decorating the mesoporous ɑ-Fe2O3 NWs with 10 nm sized ZnO nanoparticles. The developed ɑ-Fe2O3/ZnO nanowire nanohybrids could eliminate 100% of the probe dyes: methylene blue, Rhodamine B and methyl orange within 90 min irradiation with solar light, underlining the high photocatalytic degradation efficiency of the nanohybrid. The nanowire nanohybrids could be easily recovered by applying an external magnetic field and reused for at least 4 times without significant loss of their photocatalytic activity.
1. Introduction
One-dimensional (1D) nanoscale materials (nanorods, nanowires, nanotubes, and nanofibers) have attracted great attention in recent years due to their remarkable size and shape dependent electrical, optical and magnetic properties.1–8 Therefore, studies on the shape controllable synthesis of 1D nanomaterials, especially magnetic iron oxides are gaining increasing interest and are actively being pursued because of their novel properties and numerous application possibilities. For example, magnetite (Fe3O4) nanorods of sub-100 nm length were shown to be better MRI contrast agents in comparison to spherical magnetic nanoparticles due to shape-induced magnetic field in homogeneity.9 Recently, hematite (α-Fe2O3) nanorod arrays were reported to be better candidates for photoelectrochemical water splitting than their spherical nanoparticle counterparts because of their anisotropic as well as oriented structures.10 Therefore, from a practical perspective, design of a simple approach to synthesize iron oxides (α-Fe2O3, Fe3O4 and α-Fe) NWs and their core–shell nanostructures with precise control of aspect ratio and uniformity has much relevance. Several efforts have been expended for the preparation of uniform iron and iron oxide NWs with controlled aspect ratio. However, current methods involve the use of template-assisted electrodeposition,11 metal evaporation,12 organometallic chemistry,13 electrospinning technique,14 or nanolithography.15 These methods all suffer from a degree of complexity, production scale-up challenges, high cost, and environmental hazards.
Magnetic photocatalysts, specifically visible-light-active magnetic nanocomposites for environmental pollution control, have emerged as an important research topic. The magnetic properties can be exploited for separation of the photocatalyst nanoparticles after use. Among different phases of iron oxide, α-Fe2O3 nanowires (NWs) are promising for visible light driven photocatalytic applications owing to their stability under ambient conditions. This semiconductor can absorb visible light since it has a narrow band gap (Eg = 2.2 eV).16 However, the photocatalytic efficiency of α-Fe2O3 is suppressed by the facile recombination of photogenerated electron–hole pairs owing to intrinsically short hole diffusion lengths (2–4 nm).17 Photocatalytic reactivity is a surface phenomenon and hence can be improved by decorating metal/metal oxides (Ag, Au, ZnO, TiO2) on the surface of NWs, significantly reducing the recombination of photogenerated electron–hole pairs at the reactive surface sites.18–23 For example, TiO2/α-Fe2O3 and ZnO/α-Fe2O3 nanoheterostructures were successfully prepared and possessed excellent visible light or UV photocatalytic activity due to effective electron–hole separation at the interface of both the semiconductors.23 Therefore, ZnO NWs decorated with mesoporous α-Fe2O3 NWs could be a possible solution to further improving photocatalytic activity as shown below.
In this work, we report a novel method to prepare porous iron and iron oxide NWs with well-controlled morphology and composition using a fluidized bed reduction approach. α-FeOOH NWs were first prepared by hydrolysis of FeCl3, and subsequently reduced to mesoporous iron oxides (α-Fe2O3 and Fe3O4) and eventually to metallic iron (α-Fe) in the presence of forming gas. Magnetic studies (α-Fe2O3, Fe3O4 and α-Fe NWs) showed ferromagnetic behavior, and on alignment, exhibited enhanced remanence in the parallel direction due to magnetic anisotropy. Further, we present data on α-Fe2O3-based magnetic nanocomposite photocatalysts. Ferromagnetic mesoporous α-Fe2O3/ZnO nanowire nanohybrids (NNHs) were synthesized by a seed-mediated hydrothermal method. The α-Fe2O3/ZnO NNHs demonstrated enhanced photocatalytic performance due to the porous framework of the NNHs and anchoring of ZnO nanoparticles on the α-Fe2O3 NW surface.
2. Experimental details
Synthesis of FeOOH NWs
In a typical synthesis of FeOOH NWs, 1.375 g (5 mM) of FeCl3·6H2O were dissolved in 60 mL of deionized (DI) water using a magnetic stirrer. Then, 1.6 g (40 mM) of NaOH were dissolved in 20 mL DI water and added dropwise into the above FeCl3 solution followed by further stirring for 30 min. The reaction solution was transferred to a Teflon-lined stainless steel autoclave (100 mL) and then kept at 160 °C for 12 h. The FeOOH yellow precipitate was collected by centrifugation, then washed with ethanol several times, and finally dried under vacuum at 60 °C.
Phase transformation of α-FeOOH to mesoporous α-Fe2O3, Fe3O4 and α-Fe NWs
A typical fluidized bed reactor is a cylindrical column that is filled with a suitable packing material such as beads. Fluidization can be obtained when liquid, gas, or a liquid–gas combination is passed through the solid material to suspend the solid and cause it to behave as it were a fluid. The fluidized bed reactor tube was placed vertically in an electrical resistance furnace capable of attaining 1000 °C (Scheme 1). For the thermal anneal process, 500 mg of as-prepared α-FeOOH NWs were loaded into the reactor from the top (outlet), resting on a porous gas distributor plate. Reducing forming gas was admitted from the bottom (inlet), and the temperature of the furnace was maintained at 200 °C (3 h), 300 °C (3 h) or 450 °C (30 min) for the synthesis of α-Fe2O3, Fe3O4 and α-Fe NWs, respectively. After the experiment, the powder was collected from the tube and used for further characterizations. The synthesis procedure is depicted in Scheme 1.
 |
| Scheme 1 Formation processes of α-FeOOH NWs from hydrolysis of FeCl3 and phase transformation of FeOOH to α-Fe2O3, Fe3O4 and α-Fe NWs by using a fluidized bed technique. | |
Synthesis of ZnO nanoparticles embedded α-Fe2O3 NWs
The mesoporous α-Fe2O3 NWs are promising for photocatalytic application because of high surface area and excellent visible light absorption properties. However, the photocatalytic activity in α-Fe2O3 is always suppressed by the fast recombination of charge carriers. To overcome this challenge and to design a high-performance photocatalyst, ZnO nanoparticles (3.3 eV, a wide band gap semiconductor) were decorated on the surface of porous α-Fe2O3 NWs. In a typical synthesis to prepare α-Fe2O3/ZnO NNHs, 0.2194 g (1 mmol) of Zn(CH3COO)2·2H2O and 0.144 g (2.4 mmol) of urea were first dissolved in 40 mL of a water–ethanol mixture (water–ethanol 5
:
3 volume ratio) until a clear solution was achieved. Secondly, 0.128 g of porous α-Fe2O3 NWs was added to the solution and sonicated for 15–20 min. Finally, this solution was transferred to a 100 mL Teflon-lined stainless steel autoclave. The autoclave was sealed and heated at 180 °C for 12 h and then cooled to room temperature naturally. The reddish-brown product was collected by centrifugation and washed with ethanol several times and finally dried at 60 °C. To further understand the effect of ZnO nanoparticles on the photocatalytic activity, NNHs with different loadings of ZnO were prepared by controlling the Zn-precursor concentration from 1 to 5 mmol.
Solar light driven photocatalytic activity
The photocatalytic activity of mesoporous α-Fe2O3 NWs, α-Fe2O3–ZnO NNHs and ZnO nanoparticles was investigated under simulated solar light (DC Xenon, 450 W) by using rhodamine B (RhB), methyl orange (MO) or methylene blue (MB). In a typical experiment, 40 mg catalyst (α-Fe2O3 NWs, α-Fe2O3/ZnO NNHs and ZnO nanoparticles) were added to 100 mL aqueous solution of 20 μM respective organic dye. The mixture was stirred in the dark for 30 min to obtain a colloidal dispersion of the catalyst, and importantly, to ensure adsorption equilibrium of the dye with the photocatalyst surface. Then, the photocatalytic experiment was conducted with continuous purging of O2 gas with the solar light source placed horizontally above the liquid surface. Stirring was continued throughout the experiment to ensure uniform dispersion of the catalyst. The temperature of the photoreactor was maintained constant at room temperature (∼22 °C) by a jacketed water cooling system during the photocatalytic reaction. During the photocatalytic experiment, 4 mL of solutions aliquots were extracted at intervals of 15 min, subsequently centrifuged and then the supernatants was filtered. The concentration of the dyes was monitored by measuring the absorbance of filtrate supernatants at λmax (665, 465 and 554 nm for MB, MO, and RhB, respectively) on a Shimadzu UV-VIS-NIR spectrophotometer (UV-3600).
Characterization techniques
Transmission electron microscopy (TEM) images were recorded on a JEOL 1200 EX electron microscope operated at 120 kV. High resolution TEM (HRTEM) images were obtained on a Hitachi H-9500 instrument operated at 300 kV. Powder X-ray diffraction (XRD) patterns were recorded on a Rigaku Ultima IV diffractometer with a Cu Kα X-ray source. Nitrogen adsorption–desorption measurements used a TriStar II 3020 Micrometrics instrument and yielded surface area and porosity data (via Brunauer–Emmett–Teller, BET modeling). Magnetic hysteresis loops were measured using an alternating gradient magnetometer (AGM) with magnetic field of 14 kOe. For alignment of NWs, the mixture of ethanol dispersion of nanowires and epoxy were sonicated for 2 min. This composite was then poured into a mold and allowed to cure under an external magnetic field of 20 kOe.
3. Results and discussion
Structural properties of α-Fe2O3, Fe3O4 and α-Fe NWs
The crystal structure and phase of the as-prepared ɑ-FeOOH NWs and as-transformed samples were characterized using XRD (Fig. 1). Fig. 1a shows the XRD pattern of the as-synthesized α-FeOOH NWs, where all the diffraction peaks can be indexed as orthorhombic α-FeOOH with lattice parameters of a = 4.62 Å, b = 9.95 Å, and c = 3.02 Å (ICDD No-81-0462). The XRD patterns of the samples obtained after phase transformation at different temperatures are shown in Fig. 1b–d. The diffraction pattern of the NWs obtained by annealing the α-FeOOH NWs at 200 °C for 3 h (Fig. 1b) matches well with rhombohedral structure of α-Fe2O3 with lattice parameters of a = b = 5.03 Å, c = 13.76 Å (ICDD No-85-0987). It confirms the transformation of α-FeOOH to α-Fe2O3. Fig. 1c shows the XRD pattern of Fe3O4 NWs obtained by annealing the α-FeOOH NWs at 300 °C for 3 h; all the diffraction peaks can be indexed to a cubic spinel structure with lattice parameters of a = b = c = 8.39 Å (ICDD No-72-8151). A mixture of Fe3O4 and Fe phases is obtained by annealing the α-FeOOH NWs at 400 °C as confirmed from the XRD pattern shown in Fig. S1 (ESI†). Finally, the XRD pattern shown in Fig. 1d can be assigned to the body-centered cubic crystal structure of Fe (ICDD No. 71-3763). It is obtained by annealing α-FeOOH NWs at 450 °C for 30 min without any byproducts (such as α-Fe2O3 or Fe3O4). The XRD data reveal that a complete phase transformation of α-FeOOH to α-Fe2O3, Fe3O4 and α-Fe can be achieved by annealing it at 200, 300 and 450 °C, respectively.
 |
| Fig. 1 XRD patterns of (a) as-synthesized α-FeOOH, (b) α-Fe2O3, (c) Fe3O4, and (d) α-Fe NWs. | |
A representative TEM image of the as-prepared α-FeOOH NWs is shown in Fig. 2. The length and diameter of α-FeOOH NWs were ∼550 nm and ∼30 nm, respectively. The corresponding HRSEM micrograph clearly showed that the product consisted of large scale uniform NWs (Fig. S2a, ESI†). An HRTEM image of a single α-FeOOH NW is shown in Fig. 2b. The α-FeOOH NWs synthesized by a hydrothermal method in this work had cylindrical shape and controllable size, as well as high aspect ratio (∼18). Usually by hydrolysis method, spindle shape α-FeOOH nanostructures are formed.24 However, in our case the high-pressure synthesis condition might be playing an important role in forming high aspect ratio NWs. Fig. 2c shows a magnified view of the highlighted area marked by a white square in Fig. 2b. It reveals the single-crystal structure of these NWs with an interplanar spacing of 0.41 nm, corresponding to the (110) crystallographic orientation of α-FeOOH.
 |
| Fig. 2 (a) TEM image and (b) corresponding HRTEM image of α-FeOOH NWs obtained by hydrolysis of FeCl3 at 160 °C for 12 h. (c) Magnification of selected mark zone in (b) shows the lattice spacing of FeOOH. (d) Yellow colored α-FeOOH NWs powder produced by a single experiment. | |
Fig. 3a shows a TEM image of α-Fe2O3 NWs obtained by annealing of FeOOH NWs at 200 °C for 3 h. By comparison with the precursor α-FeOOH, we can observe that on conversion from α-FeOOH to the α-Fe2O3 phase, not only the NWs shape but also the size is perfectly maintained. It can be seen in the HRSEM image (Fig. S2b, ESI†), that all nanowires have similar morphology as the α-FeOOH precursor. It should be noted that α-FeOOH transforms to α-Fe2O3 with only minor structural alterations, as expected for a topotactic transformation.25 However, careful observation of the TEM image in Fig. 3a revealed many pores on the α-Fe2O3 NWs. Thermal annealing of as-prepared α-FeOOH NWs releases the H2O molecules in the structure, and ultimately the α-FeOOH NWs transform to mesoporous α-Fe2O3 NWs. An HRTEM image of the NWs (Fig. 3b) and magnified view of the highlighted area marked by a white square in Fig. 3c reveal the single-crystal structure of these NWs. The interplanar spacing was measured as 0.25 nm which corresponds to the (110) crystallographic orientation of α-Fe2O3. The color of the dried precipitates also changed from yellow to reddish brown after heating at 200 °C, confirming the phase transformation to hematite (Fig. 3d).
 |
| Fig. 3 (a) TEM image and (b) corresponding HRTEM image of α-Fe2O3 NWs prepared by annealing α-FeOOH NWs at 200 °C for 3 h. The yellow encircled area represents pores. (c) Magnification of selected white square zone in (b) depicting the lattice spacing of α-Fe2O3 NWs. (d) Reddish brown color α-Fe2O3 NWs powder obtained by annealing α-FeOOH NWs at 200 °C. | |
TEM observation (Fig. 4a) of Fe3O4 NWs revealed that the shape and size of these NWs were maintained even after the annealing at 300 °C for 3 h. However, the removal of water molecules from the FeOOH NWs makes these Fe3O4 NWs porous. The size of the pores was found to be slightly larger than the Fe2O3 NWs and was in the range: 10–14 nm (marked yellow in Fig. 4b). Compared to FeOOH and α-Fe2O3 NWs, the average diameter of the Fe3O4 NWs was increased from 30 to 35 nm. A higher magnification HRSEM image indicates that the surfaces of Fe3O4 nanowires are relatively rough compared to α-Fe2O3 (Fig. S2c, ESI†). The conversion from α-FeOOH or α-Fe2O3 to Fe3O4 involves the sheaving of the oxide ion planes from AB to ABC stacking.26 Fig. 4c shows the lattice-resolution HRTEM image of the NWs marked by a white square in Fig. 4b. The interplanar spacing was measured to be 0.48 nm, corresponding to the (111) crystallographic orientation of magnetite.
 |
| Fig. 4 (a) TEM image and (b) corresponding HRTEM image of Fe3O4 NWs obtained by annealing α-FeOOH NWs at 300 °C for 3 h. The yellow encircled area represents pores. (c) Magnification of selected white square zone in (b) shows the lattice pattern. (d) Black color Fe3O4 NW powder obtained by annealing α-FeOOH NWs at 300 °C for 3 h. | |
When the precursor α-FeOOH NWs were fully reduced at 450 °C, Fe NWs were obtained, as shown in Fig. 5a and Fig. S2d (ESI†). We found that although the NW shape was preserved, there was a substantial decrease in the length of the NW from 550 to 200 nm on conversion from α-FeOOH to Fe. The decrease of NW length and diameter could be due to removal of all the oxygen and hydrogen atoms from α-FeOOH during the phase transformation at 450 °C. In addition, high temperature annealing can also break the NWs into smaller size due to the surface self-diffusion of Fe atoms, fragmentation and aggregation. Fig. 5b shows a high magnification TEM image of Fe NWs. Many pores can be observed on the Fe NWs, due to the reduction of α-FeOOH and release of H2O.
 |
| Fig. 5 (a) HRSEM image and (b) TEM image of α-Fe NWs obtained by heating α-FeOOH NWs at 450 °C for 30 min. | |
To investigate the porous morphology of the as-prepared α-FeOOH, α-Fe2O3, Fe3O4 and α-Fe NWs, nitrogen adsorption–desorption analyses were carried out. From the data in Fig. 6, the BET specific surface areas of α-FeOOH, α-Fe2O3, Fe3O4 and α-Fe NWs are 52.71, 82.00, 55.20 and 24.77 m2 g−1, respectively. The higher specific surface area of α-Fe2O3 and Fe3O4 NWs relative to the non-porous α-FeOOH is due to their porous morphology. Further, the steady decrease of BET surface areas from α-Fe2O3 to α-Fe NWs is due to the increased annealing temperature that resulted in coarsening ligaments, fragmentation and aggregation.27,28 The average pore diameters calculated from the nitrogen isotherms for α-Fe2O3, Fe3O4 and α-Fe NWs were 13.7, 13.9 and 8.3 nm, respectively. It is not yet clear why the pore diameter was reduced for the α-Fe NWs, although it is reasonable to assume that atomic diffusion during the reduction heat treatment could cause some filling of the pore structure of the NWs.
 |
| Fig. 6 Nitrogen adsorption–desorption isotherms of the (a) α-FeOOH NWs, (b) α-Fe2O3 NWs, (c) Fe3O4 NWs and (d) α-Fe NWs. | |
Magnetic properties of α-FeOOH, α-Fe2O3, Fe3O4 and α-Fe NWs
To understand the magnetic properties, hysteresis loops of aligned NWs were measured at room temperature using an AGM. Fig. 7a shows the magnetic hysteresis (M – H) loop of as-synthesized α-FeOOH NWs. A paramagnetic response of the α-FeOOH sample is apparent. Fig. 7b shows the hysteresis loops for aligned α-Fe2O3 NWs measured along the parallel and perpendicular directions to the alignment direction. The effect of alignment is clear in the expanded view of the hysteresis loops in the inset of Fig. 7b. A remanence of Mr = 0.64 Ms and coercive field Hc of 412 Oe were obtained when measured parallel to the alignment direction, while a remanence Mr = 0.32 Ms and coercive field Hc of 355 Oe were obtained when measured perpendicular to the aligned wires. The enhanced remanent along the alignment direction results from magnetic anisotropy and is consistent with previous reports.29,30 Compared to the hematite nanoparticles reported in previous studies, these porous nanowires show high saturation magnetization due to their smaller diameter.31
 |
| Fig. 7 Room temperature magnetic hysteresis loops of (a) as-prepared α-FeOOH NWs, (b) α-Fe2O3 NWs, (c) Fe3O4 NWs, and (d) α-Fe NWs. The inserts show the low-field magnetization loops. | |
Fig. 7c and d show the M – H loops for Fe3O4 and Fe NWs measured parallel and perpendicular to the aligned direction. The magnetization curves for Fe3O4 and Fe NWs parallel to aligned NWs exhibited a Mr of 0.51 Ms and 0.43 Ms and a Hc of 583 Oe and 628 Oe (Fig. 7c and d), respectively. When the samples were measured perpendicular to the alignment direction, remanence of Mr = 0.30 Ms and 0.27 Ms were obtained, indicating the influence of shape anisotropy. However, this change in the loop shape does not lead to dramatic changes in the coercive field, which may be explained as follows: high-temperature annealing had caused a recrystallization (change in grain size); the influence of preferred orientation of the crystallites in NWs on magnetic anisotropy was thus ameliorated.32,33 Saturation magnetization values of 3, 77 and 197 emu/g were obtained for α-Fe2O3, Fe3O4 and Fe NWs, respectively. As the phase transformation proceeded from α-FeOOH to α-Fe, the magnetic properties of the samples gradually transformed from paramagnetic to ferromagnetic. Since the magneto-crystalline anisotropy of the Fe-based materials is weak, the coercivity could originate from the shape anisotropy as well.34
α-Fe2O3/ZnO NNHs and their photocatalytic properties
Fig. 8a shows a TEM image for the as-prepared α-Fe2O3/ZnO NNHs with an average diameter of 50 nm and a length of 500 nm. The α-Fe2O3 NWs are clearly decorated with ZnO nanoparticles of average diameter of 10 nm. The presence of ZnO overlayer was further confirmed by HRTEM and selected area electron diffraction (SAED) pattern as shown in Fig. 8a inset and Fig. 8b. As shown in Fig. 8a inset, the diffraction spots with interplanar spacings of 0.248, 0.282 nm are indexed to the (101) and (100) planes of ZnO and 0.184, 0.220 nm are indexed to the (024) and (113) planes of α-Fe2O3, respectively. In the HRTEM image of NNHs, the lattice spacing of 0.270 nm corresponds to the (104) plane of α-Fe2O3 and the lattice spacing of 0.248 nm correspond to the (101) plane of ZnO.
 |
| Fig. 8 (a) HRTEM image of α-Fe2O3/ZnO NNHs and insert shows the corresponding SAED pattern (b) lattice fringes of the α-Fe2O3/ZnO NNHs. (c) XRD patterns of α-Fe2O3 NWs, ZnO nanoparticles, and α-Fe2O3/ZnO NNH. The standard XRD patterns of α-Fe2O3 and ZnO drawn from the respective ICDD files are shown at the bottom in blue and red, respectively. (d) UV-visible absorption spectra of α-Fe2O3 NWs, ZnO nanoparticles, and α-Fe2O3/ZnO NNHs. | |
Fig. 8c shows the XRD patterns of pristine α-Fe2O3, ZnO and Fe2O3/ZnO samples. XRD peaks of the α-Fe2O3 and ZnO can be well indexed to the standard patterns for ZnO (ICDD No. 01-079-2205, hexagonal phase) and α-Fe2O3 (ICDD No-01-85-0987 rhombohedral phase), respectively. Fig. 8d shows a comparison of UV-visible absorption spectra of the ZnO nanoparticles, α-Fe2O3 NWs, and the α-Fe2O3/ZnO NNHs sample. The pure ZnO NPs presented typical absorption with an intense transition in the UV region, which may be assigned to the intrinsic band gap absorption of ZnO (376 nm, 3.3 eV). However, α-Fe2O3/ZnO NNH showed enhanced absorption in the visible light region due to the visible absorption component, α-Fe2O3 (2.2 eV). The band gap energies estimated from the Tauc plots were 3.5 and 2.2 eV for the pure ZnO nanoparticles and α-Fe2O3 NWs (Fig. S3, ESI†). The band gap energy for α-Fe2O3/ZnO NNHs was found to be 2.5 eV (Fig. S3, ESI†). The enhanced absorption in the visible light region of these α-Fe2O3/ZnO NNHs is expected to result in improved photocatalysis under solar light irradiation (see below).
The photocatalytic activity of α-Fe2O3 NWs and α-Fe2O3/ZnO NNHs was explored using the degradation of MB, RhB and MO dyes as probes under simulated solar light. A time-dependent absorption spectrum for RhB in presence of α-Fe2O3/ZnO NNHs is shown in Fig. 9a. The intensity of the absorption peaks of RhB, i.e., 554 nm decreased gradually with the passage of time, suggesting that the RhB was steadily degraded by the α-Fe2O3/ZnO NNHs. RhB concentration in the dark condition (for 30 min) decreases slightly, which could be due to the physical adsorption of dyes on the porous surface of α-Fe2O3/ZnO NNHs. The decoloration of RhB solution under irradiation of simulated sunlight for 90 min (Fig. S4, ESI†) clearly revealed that the RhB dye had been completely degraded. To compare the photocatalytic efficiency of α-Fe2O3/ZnO NNHs, with the pristine counterparts, the photocatalytic characteristics of as-prepared α-Fe2O3 NWs, commercial α-Fe2O3, ZnO nanoparticles and commercial TiO2 (P25) were performed under similar condition as α-Fe2O3/ZnO NNHs. No significant change was observed in the concentration of dyes for the as-prepared α-Fe2O3 NWs, commercial α-Fe2O3 and ZnO nanoparticles (ESI, Fig. S5 and S6†). In contrast, the concentration of RhB dyes decreased rapidly in the presence of α-Fe2O3/ZnO NNHs with exposure to simulated solar light. A similar trend in the photocatalytic activity of α-Fe2O3/ZnO NNHs was also found for MB and MO dyes (Fig. S6a and b, ESI†).
 |
| Fig. 9 (a) Absorption spectra for RhB, dye as a function of irradiation time in simulated solar light in the presence of α-Fe2O3/ZnO NNHs (40 mg). The initial concentration of dye used for the photo degradation experiment was 20 μM. (b) Comparison of the degradation efficiency of α-Fe2O3/ZnO NNHs for different dyes. (c) Pseudo first-order plots of normalized dye concentration as a function of irradiation time under simulated solar light. (d) Recycling ability of the α-Fe2O3/ZnO NNHs for degradation of RhB dye under simulated solar light. | |
Fig. 9b shows comparative degradation profiles for MB, MO and RhB dyes under simulated solar light. It is worth noting that in all the cases, complete dye degradation took place within 90 min of exposure to sunlight. Both MB and RhB are cationic dyes whereas MO is an anionic dye; therefore, the rate constants for MB and RhB degradation was higher than that of MO, presumably due to the electrostatic interaction between negatively charged α-Fe2O3/ZnO NNHs and the cationic dyes. The pseudo first-order reaction rate constant k (ln (C0/C) vs. time) of the α-Fe2O3/ZnO NNHs for MB, MO and RhB were found to be 6.3 × 10⁻², 5.2 × 10⁻² and 3.9 × 10⁻² min−1, respectively (Fig. 9c). The enhancement in photocatalytic activity relative to the parent particles can be attributed to several attributes of α-Fe2O3/ZnO NNHs, namely mesoporous morphology, high surface area and effective electron–hole separation at the particle junctions.
The photocatalytic activity of α-Fe2O3/-ZnO NNHs was also studied with loading of different concentrations of ZnO nanoparticles (Fig. S6c, ESI†). The photocatalytic ability of α-Fe2O3/ZnO NNHs increased with an increase of ZnO content from 0–2 mM and then decreased with further increase in ZnO content to 5 mM. This trend presumably reflects the decrease in active sites on the surface after the ZnO content exceeded an optimum value (i.e., 2 mM). A higher loading of ZnO nanoparticles also shields visible light absorption by the α-Fe2O3 phase and hence decreases the photocatalytic activity. Further, excess ZnO nanoparticles loading can act as charge carrier recombination centers due to the electrostatic attraction between negatively charged ZnO and positively charged holes.
The photocatalyst was recovered by using an external magnet after completion of the reaction (Fig. S7, ESI†) and washed thoroughly with water and ethanol. In addition, α-Fe2O3/ZnO NNHs showed excellent recycling capability for degradation of organic dyes under simulated sunlight. A typical plot for degradation efficiency of RhB under simulated sunlight is shown in Fig. 9d. It can be seen that even after the 4th cycle, ∼91% degradation efficiency was retained after 75 min of irradiation. The HRSEM micrograph of Fe2O3/ZnO NNHs before and after the 4th cycle of dye photodegradation is given in Fig. S8 (ESI†). It shows no change in size, shape and the attachment of ZnO on the surface of Fe2O3 NWs even after the 4th cycle of photocatalytic experiment.
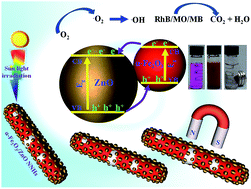
The possible mechanism for the enhanced photocatalytic performance of the α-Fe2O3/ZnO NNHs is pictorially depicted in Scheme 2. The ZnO nanoparticles are active in the ultraviolet region, while α-Fe2O3 can utilize the visible window of light. Thus on solar light illumination of the catalyst, electron–hole pairs are generated in the conduction band (CB) and valence band (VB) of both the semiconductors (ZnO and α-Fe2O3) by the absorption of photons having energy higher than their band gaps. The intimate contact between the ZnO nanoparticles and α-Fe2O3 NWs facilitates the transfer of photogenerated electrons in the CB of α-Fe2O3 to the CB of ZnO due to the decreased potential energy. This rapid charge transfer across the heterojunction suppresses electron–hole pair recombination.21,22 Consequently, the electrons and holes are transferred to the surfaces of α-Fe2O3 and ZnO, respectively, and finally generate reactive oxygen species (ROS). These ROS effectively decompose the organic dyes. Further, because of the mesoporous morphology, active sites for the photocatalytic reactions are high; these highly accessible active sites could be another reason for the enhanced photocatalytic activity of α-Fe2O3/ZnO NNHs.
 |
| Scheme 2 Schematic view of the band alignment and charge transfer in the α-Fe2O3/ZnO NNHs on solar light irradiation (see also text). | |
4. Conclusions
In summary, α-Fe2O3, Fe3O4 and α-Fe NWs were successfully synthesized by the fluidized bed reduction of α-FeOOH NWs in H2/Ar. The as-synthesized α-Fe2O3, Fe3O4 and α-Fe NWs exhibited high surface area due to the mesoporous structure. Magnetic hysteresis measurements of the as-synthesized α-Fe2O3, Fe3O4 and α-Fe NWs showed ferromagnetic behavior. The aligned α-Fe2O3, Fe3O4 and α-Fe NWs showed enhanced remanence in the parallel direction compared to the perpendicular direction reflecting the effect of magnetic anisotropy. Magnetic α-Fe2O3/ZnO NNHs were synthesized by decorating ferromagnetic mesoporous α-Fe2O3 NWs with ZnO nanoparticles using the seed-mediated hydrothermal method and investigated for photocatalysis applications. The photocatalytic performance of α-Fe2O3/ZnO NNHs was evaluated for the degradation of methylene blue, rhodamine B, and methyl orange dyes and found to be superior relative to the components. In addition, magnetically recovered catalyst is reusable and showed 91% retention up to 4 cycles.
Acknowledgements
This work was supported by US. DoD/ARO under Grant W911NF-11-1-0507 (to JPL), and the Center for Nanostructured Materials, Characterization Center for Materials and Biology, University of Texas at Arlington. KR thanks the National Science Foundation for funding under Grant CHE-1303803. The authors thank Mr Mohammad Islam and Prof. Frederick MacDonnell for their help with the BET measurements.
References
- Y. Xia, P. Yang, Y. Sun, Y. Wu, B. Mayers, B. Gates, Y. Yin, F. Kim and H. Yan, Adv. Mater., 2003, 15, 353–389 CrossRef CAS.
- H. Dai, J. H. Hafner, A. G. Rinzler, D. T. Colbert and R. E. Smalley, Nature, 1996, 384, 147–150 CrossRef CAS.
- K. Gandha, K. Elkins, N. Poudyal, X. Liu and J. P. Liu, Sci. Rep., 2014, 4, 5345 CAS.
- N. Poudyal, G. S. Chaubey, V. Nandwana, C.-b. Rong, K. Yano and J. P. Liu, Nanotechnology, 2008, 19, 355601 CrossRef PubMed.
- K. Gandha, P. Tsai, G. Chaubey, N. Poudyal, K. Elkins, J. Cui and J. P. Liu, Nanotechnology, 2015, 26, 075601 CrossRef PubMed.
- K. Gandha, N. Poudyal, Q. Zhang and J. P. Liu, IEEE Trans. Magn., 2013, 49, 3273–3276 CrossRef CAS.
- K. Gandha, K. Elkins, N. Poudyal and J. P. Liu, J. Appl. Phys., 2015, 117, 17A736 CrossRef.
- Y. Soumare, C. Garcia, T. Maurer, G. Chaboussant, F. Ott, F. Fiévet, J.-Y. Piquemal and G. Viau, Adv. Funct. Mater., 2009, 19, 1971–1977 CrossRef CAS.
- J. Mohapatra, A. Mitra, H. Tyagi, D. Bahadur and M. Aslam, Nanoscale, 2015, 7, 9174–9184 RSC.
- J. Yang, C. Bao, T. Yu, Y. Hu, W. Luo, W. Zhu, G. Fu, Z. Li, H. Gao, F. Li and Z. Zou, ACS Appl. Mater. Interfaces, 2015, 7, 26482–26490 CAS.
- H. Zeng, R. Skomski, L. Menon, Y. Liu, S. Bandyopadhyay and D. J. Sellmyer, Phys. Rev. B: Condens. Matter Mater. Phys., 2002, 65, 134426 CrossRef.
- J. R. Morber, Y. Ding, M. S. Haluska, Y. Li, J. P. Liu, Z. L. Wang and R. L. Snyder, J. Phys. Chem. B, 2006, 110, 21672–21679 CrossRef CAS PubMed.
- N. Liakakos, C. Achkar, B. Cormary, J. Harmel, B. Warot-Fonrose, E. Snoeck, B. Chaudret, M. Respaud, K. Soulantica and T. Blon, ACS Nano, 2015, 9, 9665–9677 CrossRef CAS PubMed.
- R. Han, W. Li, W. Pan, M. Zhu, D. Zhou and F. S. Li, Sci. Rep., 2014, 4, 7493 CrossRef CAS PubMed.
- W. Zhang, M. E. Bowden and K. M. Krishnan, J. Appl. Phys., 2013, 113, 17B502 Search PubMed.
- A. K. Patra, S. K. Kundu, A. Bhaumik and D. Kim, Nanoscale, 2016, 8, 365–377 RSC.
- H. Yang, D. Dahu, Z. Minshen, M. Wenjun, H. Yan, G. Fengxia, L. Jie, L. Jing, T. Chengchun, L. Zhongfang, Z. Zhenya and Z. Chunyi, Sci. Technol. Adv. Mater., 2015, 16, 014801 CrossRef.
- A. Ruiz-Baltazar, S. Y. Reyes-Lopez, R. Esparza, M. Estevez, A. Hernandez-Martnez, G. Rosas and R. Perez, Adv. Condens. Matter Phys., 2015, 2015, 6 Search PubMed.
- W. Wu, J. Changzhong and V. A. L. Roy, Nanoscale, 2015, 7, 38–58 CAS.
- A. Mao, W. J. Kim, J. K. Kim, K. Shin, G. Y. Han and J. H. Park, Electrochim. Acta, 2013, 97, 404–408 CrossRef CAS.
- W. Wu, S. Zhang, X. Xiao, J. Zhou, F. Ren, L. Sun and C. Jiang, ACS Appl. Mater. Interfaces, 2012, 4, 3602–3609 CAS.
- J. Liu, S. Yang, W. Wu, Q. Tian, S. Cui, Z. Dai, F. Ren, X. Xiao and C. Jiang, ACS Sustainable Chem. Eng., 2015, 3, 2975–2984 CrossRef CAS.
- J. Liu, W. Wu, Q. Tian, Z. Dai, Z. Wu, X. Xiao and C. Jiang, Dalton Trans., 2016, 45, 12745–12755 RSC.
- H. Kumazawa and K. Higashimae, Chem. Eng. Commun., 1999, 171, 15–27 CrossRef CAS.
- Y. Cudennec and A. Lecerf, J. Solid State Chem., 2006, 179, 716–722 CrossRef CAS.
- F. Jiao, J.-C. Jumas, M. Womes, A. V. Chadwick, A. Harrison and P. G. Bruce, J. Am. Chem. Soc., 2006, 128, 12905–12909 CrossRef CAS PubMed.
- Y. H. Tan, J. A. Davis, K. Fujikawa, N. V. Ganesh, A. V. Demchenko and K. J. Stine, J. Mater. Chem., 2012, 22, 6733–6745 RSC.
- D. Ciuculescu, F. Dumestre, M. Comesaña-Hermo, B. Chaudret, M. Spasova, M. Farle and C. Amiens, Chem. Mater., 2009, 21, 3987–3995 CrossRef CAS.
- Y. L. Chueh, M. W. Lai, J. Q. Liang, L. J. Chou and Z. L. Wang, Adv. Funct. Mater., 2006, 16, 2243–2251 CrossRef CAS.
- L. Sun, P. C. Searson and C. L. Chien, Appl. Phys. Lett., 1999, 74, 2803–2805 CrossRef CAS.
- C. Carbone, F. Di Benedetto, C. Sangregorio, P. Marescotti, L. A. Pardi and L. Sorace, J. Phys. Chem. C, 2008, 112, 9988–9995 CAS.
- Q. Han, Z. Liu, Y. Xu and H. Zhang, J. Cryst. Growth, 2007, 307, 483–489 CrossRef CAS.
- C. Terrier, M. Abid, C. Arm, S. Serrano-Guisan, L. Gravier and J. P. Ansermet, J. Appl. Phys., 2005, 98, 086102 CrossRef.
- L. Mohaddes-Ardabili, H. Zheng, S. B. Ogale, B. Hannoyer, W. Tian, J. Wang, S. E. Lofland, S. R. Shinde, T. Zhao, Y. Jia, L. Salamanca-Riba, D. G. Schlom, M. Wuttig and R. Ramesh, Nat. Mater., 2004, 3, 533–538 CrossRef CAS PubMed.
Footnotes |
† Electronic supplementary information (ESI) available. See DOI: 10.1039/c6ra18530d |
‡ Authors contributed equally. |
|
This journal is © The Royal Society of Chemistry 2016 |
Click here to see how this site uses Cookies. View our privacy policy here.