Pattern recognition for cytotoxicity mode of action (MOA) of chemicals by using a high-throughput real-time cell analyzer

Jiao Chenab, Tianhong Pan*a, Shan Chen*c and Xiaobo Zoud
aSchool of Electrical & Information Engineering, Jiangsu University, Zhenjiang, Jiangsu 212013, China. E-mail: thpan@ujs.edu.cn; Fax: +86 511 88780088; Tel: +86 15805298357
bSchool of Electronics and Electrical Engineering, Changzhou College of Information Technology, Changzhou, Jiangsu 213164, China. E-mail: 576473370@QQ.com
cSchool of Electrical & Information Engineering, Jiangsu University, Zhenjiang, Jiangsu 212013, China. E-mail: schen@ujs.edu.cn
dSchool of Food and Biological Engineering, Jiangsu University, Zhenjiang, Jiangsu 212013, China. E-mail: zou_xiaobo@ujs.edu.cn

Received 21st July 2016 , Accepted 25th October 2016

First published on 10th November 2016


Abstract

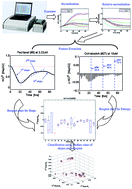
Although the end-point cell-based in vitro assay can provide clear indications of chemical activities, typically fewer clues are given to screen chemicals based on their mode of action (MOA) except reflecting toxicity in a single time-point after living cells are exposed to those chemicals. To determine distinct chemical effects characterized by MOA, a statistical pattern recognition analysis using multi-concentration time-dependent cellular response profiles (TCRPs) has been developed. By monitoring the dynamic cytotoxicity response profile of living cells via the xCELLigence RTCA HT system, changes in cell number (termed as CI) caused by different MOAs are recorded on-line as a time series. By comparing the cellular response of the treated cells to untreated cells (terms as negative control), a relative normalized cell index (NCIR) is presented which achieves the same baseline for in vitro assay and reduces variation caused by different experiments. Dynamic features, which reflect the cell killing, cell lysis, cellular proliferation and certain cellular pathological changes, are extracted from TCRPs. Finally, a hierarchical clustering analysis integrated with k-means clustering algorithm is employed to classify the extracted features, and develop MOA assays to detect and distinguish chemicals. The proposed method, including feature extraction, statistical analysis and clustering algorithm, can be readily automated and enables relatively high throughput screening for MOA hits at the cellular level.


1 Introduction

In vitro cytotoxicity testing has been used in different cell lines for screening level assessment and hazard ranking of chemicals.1 The integration and use of mathematical models in cytotoxicity testing has the potential to improve chemical hazard identification and prioritization of substances for further toxicity testing in vivo, and to facilitate the development of biologically based health risk assessment models for environmental chemicals.2,3 One of the approaches for better understanding of tissue specific toxicity is cell based high throughput screening (HTS) assay. In this assay chemical compounds with a range of concentrations are tested in various cell types. This assay is also helpful in understanding potential mode of action (MOA) of chemicals which is relevant to adverse human cell effects. Further, HTS assays could also be helpful in the assessment and characterization of environmental chemicals in well-established in vitro systems.4,5 This MOA based data driven approach is also useful in understanding the source-to-outcome continuum and improves dose–response assessments in the current health risk assessment paradigm.6,7

Screening of chemicals with known MOA in cell-based assays has been proved useful for detecting and distinguishing chemical activities based on underlying biological pathways that may also be relevant to chemical action in vivo.8 Bioassay profiling signatures or patterns using chemical probes and environmental chemical, in HTS assays combined with relevant toxicological information were found to be useful in the development of predictive models of potential toxicity for new chemicals.9,10

A cell-based HTS assay using a real-time cell analyzer system (RTCA HT) has been used for predicting general or basal toxicity.11–13 The RTCA system has been described in detail by Abassi and Slanina,14,15 and it is now marketed under the trade name xCELLigence by Roche.16 The RTCA system uses 96× or 384× well micro plates integrated with gold micro-electrode arrays on glass substrate in the bottom of the wells, also called E-plates, to measure electrical impedance changes in real-time. The measured electrical impedance is converted to a cell index (CI) that reflects cellular responses such as cell growth, growth inhibition, and cell death (apoptosis). In addition to number of cells, the CI may also be influenced by morphological changes and cell attachment quality. This impedance-based high-throughput technology provides an efficient screening tool for generating information-rich data sets including cellular response profiles and cell population kinetics over a desired range of chemical concentrations.

The TCRP patterns generated from this assay, performed in HepG2 cell line (Fig. 1), were found to be related to molecular pathways or activities such as disturbance of cytoskeletal organization, membrane integrity, DNA or protein synthesis, and cell-cycle. Those patterns can be used to screen 2000 small molecule compounds consisting of US Food and Drug Administration (FDA) approved drugs, natural products, bioactive compounds, herbicides, and insecticides.17 Linking knowledge on the cellular toxicity to mode of action (MOA) may lead to better understanding of biological causes and aid in hazard identification.18


image file: c6ra18515k-f1.tif
Fig. 1 Cell index (CI) and time-dependent cellular response profiles (TCRPs) in the RTCA HT system. The normal cell growth was within 24 hours cell seeding (phase I). In the TCRP of paclitaxel (# 8), the cells were inhibited or partially killed after 6 hours exposure (phase II), mostly killed after 24 hours exposure and partially re-grew after 24 hours exposure (phase III), and mostly re-grew after 48 hours exposure (phase IV).

A multi-center collaborative study is underway to validate the usefulness of the xCELLigence RTCA HT system as an alternative platform technology for cytotoxicity testing, and as a tool for classifying substances into MOA categories based on their cellular profiles. The focus of this article is on the details of MOA pattern recognition for 32 chemicals using HepG2 cell line. Here, we present a hierarchical pattern recognition algorithm which distinguishes between the different shapes of TCRPs and clusters chemical compounds with similar TCRPs together into the same group. Thus each cluster represents a group of chemical compounds with similar TCRPs and possibly the same mode of action.

2 Materials and methods

2.1 Experimental design

2.1.1 Chemicals, cell line and cell culture. A total of 32 chemicals used for assay were obtained from the Sigma-Aldrich (St. Louis, MO, USA). Stock solutions were prepared in water (H2O), 5% dimethyl sulfoxide (DMSO), or ethanol (EtOH). Eleven working concentrations for each chemical with 1[thin space (1/6-em)]:[thin space (1/6-em)]3 serial dilution were prepared. The 32 chemicals and their working solutions are presented in Table 1. Human hepatocellular carcinoma cells (HepG2) (order # HB – 8065, Cat.# 30 – 2003, ATCC, Manassas, VA) were routinely maintained in EMEM supplemented with 10% (v/v) fetal bovine serum (FBS) at 37 °C incubator with 95% relative humidity and 5% CO2. The Cedex automated cell counter was used for determining cell density.
Table 1 Chemical compounds with multi-concentration and their TCRPs
Cluster No. Compound MoA suggested by GRAC (molecular level) sub-MoA (molecular level) Concentrations tested (11 point curve, 1[thin space (1/6-em)]:[thin space (1/6-em)]3 step dilutions) Solution TCRPs
I 4 Cytochalasin D Protein Actin filaments 0.00034–20 DMSO image file: c6ra18515k-u1.tif
5 Cytochalasin B Protein Actin filaments 0.00034–20 DMSO image file: c6ra18515k-u2.tif
31 Latrunculin A Protein Actin filaments 3.387 × 10⁻⁵ to 2 DMSO image file: c6ra18515k-u3.tif
II 6 Latrunculin B Protein Actin filaments 0.00034–20 DMSO image file: c6ra18515k-u4.tif
8 Paclitaxel Protein Tubulin 0.00034–20 DMSO image file: c6ra18515k-u5.tif
15 Vincristine sulfate Protein Tubulin 0.00423–250 H2O image file: c6ra18515k-u6.tif
III 3 Cordycepin DNA/RNA Nucleic acid 0.00339–200 DMSO image file: c6ra18515k-u7.tif
IV 14 Valproic acid Ion channels/enzyme Voltage-gated Ca+ channel 0.85–50[thin space (1/6-em)]000 H2O image file: c6ra18515k-u8.tif
16 Doxorubicin DNA/RNA enzyme Lyases/intercalation 0.00169–100 H2O image file: c6ra18515k-u9.tif
V 17 Brefeldin A Transport proteins Vesicle transporter (intracellular) 0.00068–40 DMSO image file: c6ra18515k-u10.tif
19 EXO1 (exonuclease 1) Transport proteins Vesicle transporter (intracellular) 0.00508–300 DMSO image file: c6ra18515k-u11.tif
21 Concanamycin A Transport proteins Proton pump (intracellular) 3.39 × 10⁻⁶ to 0.2 DMSO image file: c6ra18515k-u12.tif
32 CCCP (carbonyl cyanidem-chlorophenylhydrazone) Transport protein Mitochondrial membrane transport protein 0.00169–100 DMSO image file: c6ra18515k-u13.tif
VI 9 Actinomycin D DNA/RNA Complexation 3.387 × 10⁻⁵ to 2 DMSO image file: c6ra18515k-u14.tif
18 Leptomycin B Transport proteins Nuclear transporter 3.4 × 10⁻⁷ to 0.02 DMSO image file: c6ra18515k-u15.tif
27 Ochratoxin A DNA/RNA enzyme Adduction ligase 0.00017–10 DMSO image file: c6ra18515k-u16.tif
VII 10 Puromycin Ribosome 50S subunit 0.01694–1000 H2O image file: c6ra18515k-u17.tif
VIII 12 Clofarabine DNA/RNA enzyme Oxidoreductase 0.00042–25 H2O image file: c6ra18515k-u18.tif
13 Hydroxyurea DNA/RNA enzyme Oxidoreductase 0.17–10[thin space (1/6-em)]000 H2O image file: c6ra18515k-u19.tif
IX 20 Monensin Transport proteins Na+/H+ antiporter (intracellular) 6.774 × 10⁻⁵ to 4 DMSO image file: c6ra18515k-u20.tif
29 FK-506 Enzyme Phosphatase 0.00085–50 DMSO image file: c6ra18515k-u21.tif
X 1 5-FU (fluorouracil) DNA/RNA enzyme Synthase (ligase) 0.00339–200 DMSO image file: c6ra18515k-u22.tif
2 Etoposide phosphate DNA/RNA enzyme Lyases 0.00339–200 DMSO image file: c6ra18515k-u23.tif
XI 7 Emetine Ribosome 50S subunit 0.00085–50 H2O image file: c6ra18515k-u24.tif
11 Anisomycin Ribosome 50S subunit 0.17–10[thin space (1/6-em)]000 H2O image file: c6ra18515k-u25.tif
XII 28 Cyclosporin A Enzyme Phosphatase 0.00169–100 DMSO image file: c6ra18515k-u26.tif
XIII 25 Thapsigargin Transport proteins Ca2+-ATPase (intracellular) 3.387 × 10⁻⁵ to 2 DMSO image file: c6ra18515k-u27.tif
26 BHQ (2,5-di-(t-butyl)-1,4-benzohydroquinone) Transport proteins Ca2+-ATPase (intracellular) 0.00677–400 DMSO image file: c6ra18515k-u28.tif
XIV 22 Oligomycin Transport protein Mitochondrial membrane transport protein 0.00034–20 DMSO image file: c6ra18515k-u29.tif
23 Antimycin A Transport protein Mitochondrial membrane transport protein 0.00339–200 DMSO image file: c6ra18515k-u30.tif
24 Rotenone Transport protein Mitochondrial membrane transport protein 0.00339–200 DMSO image file: c6ra18515k-u31.tif
30 BAPTA-am Ion channels Voltage-gated Ca+ channel 0.00102–60 DMSO image file: c6ra18515k-u32.tif


2.1.2 RTCA HT assay. The xCELLigence RTCA HT system consists of four 384× well E-plates mounted on four HT stations where reading of the cell index (CI) is recorded simultaneously. This continuous cell monitoring enables recording of both transient and long term effects. The system was integrated with the Biomek® FX System and Cytomat hotels which enables fully automated liquid handling and plate shuffles. The HepG2 cells were seeded onto the E-plates (4000 cells per well) and left for approximately 24 hours for initial attachment to reach exponential growth phase. Eleven concentrations of each chemical were injected in the wells using automatic pipetting. The CI reading frequency was once per minute in the first 8 min, once every 15 min in the following 7 hours, and once every 2 hours thereafter until completion of experiment. The experiment is conducted for 89 hours. The same experiment was repeated on three different days for reliability analysis.

2.2 Data processing

2.2.1 The normalized CI (NCI) and relative NCI (NCIR). Based on the measured impedance in each well, a dimensionless parameter termed cell index (CI) is derived to provide quantitative information about the biological status of the cells such as the cell number. CI is calculated using the following formula:
 
image file: c6ra18515k-t1.tif(1)
where Rb(fk) and Rcell(fk) are the frequency-dependent electrode impedance (resistance) without and with cells present in the wells respectively, and k is the number of the frequency points at which the impedance is measured.

To eliminate the effect of different initial cell population, TCRPs are normalized by dividing all CI values by the CI at a reference time-point. Thus, the NCI is 1 at the reference time-point as shown in Fig. 2(a). In this figure, the TCRP pattern through the variability of NCIs is observed. In order to distinguish the TCRP patterns of test chemicals from the control patterns, the relative NCI denoted as NCIR is calculated by dividing NCI of the test chemical (termed as NCIdk) by the NCI of the negative or vehicle control if DMSO is the solvent for test solution (termed as NCIck) at the corresponding time point (k), namely19

 
image file: c6ra18515k-t2.tif(2)


image file: c6ra18515k-f2.tif
Fig. 2 Preprocessing procedures including normalized CI, relative normalized CI and identification of eligible TCRPs. (a) The NCI value of one served as a reference point for observing cell profiles (antimycin A (# 23)). (b) The NCIR value of one for the negative control line served as a baseline. The patterns of TCRPs for the tested chemical were only compared to the baseline (antimycin A (# 23)). (c) The TCRP at a concentration of 0.82 μM of 5-FU (#1) was not considered as an eligible TCRP because of the NCIR value within threshold (0.2) of the baseline with frequent occurrence less than 10 times (Ξm = 7). (d) The TCRP at a concentration of 2.47 μM of 5-FU (#1) was considered as an eligible TCRP for cellular response differing from the negative control because the NCIR value at a reading time point was greater than threshold (0.2) around the baseline for more than 10 times (Ξm = 33).

In this case, the TCRP corresponding to the control is served as a baseline which has a NCIR value of one (see the Fig. 2(b)).

2.2.2 Feature extraction. The first step in building a classification model is to analyze characteristics of TCRPs by extracting feature using statistical and kinematic methods. The TCRPs contain information such as:

• Different cell behaviors at different concentrations, expressed as positive or negative patterns (determined by the first slope);

• Different intensity of cellular response as compared to the response in the controls (variability of NCIR changes);

• Different rate of cell growth or inhibition/killing (the changes in slope of a TCRP with certain period of exposure time or NCIR changes per unit time).

The procedures for feature extraction are described next. MATLAB (©2011b, Mathworks, Natick, MA, USA) was used for data processing.


Step 1: identification of eligible TCRPs. An eligible TCRP for a chemical is defined as the TCRP that demonstrates different cellular response from the TCRP of the negative control. The initial screening index (Ξ) is defined for screening eligible TCRPs, expressed as:
 
image file: c6ra18515k-t3.tif(3)
where m = 1, 2,…, M is the mth TCRP at the corresponding concentration; M is the total numbers of TCRPs recorded in the experiment (here, M = 11); k = 1,2,…, K is the sampling instant within a TCRP; and δ is an adjustable default empirical threshold for evaluating eligible TCRP (here, δ = 0.2). The statistical index Ξ is a measure of variability of a TCRP relative to the negative control line. An eligible TCRP is selected for further analysis if the number of discrete samples (NCIR) exceeds the boundary 1 ± 0.2 more than 10 times (Fig. 2(d)). This selection rule can be stated as follows:
 
image file: c6ra18515k-t4.tif(4)

Step 2: characterization of TCRP based on the slopes. The shape of a TCRP is determined by the different rates of cell growth/inhibition/killing at a specific time. The shapes represent unique characteristics of cellular response after exposure to chemicals. One approach to capture such feature is to examine the slopes of the TCRP. A TCRP is divided into serval phases, each phase can be approximated by a line. Slope (Bi) is obtained by assuming a linear model, expressed as:
 
image file: c6ra18515k-t5.tif(5)
where L is a time span of each phase, ki is the selected start point of each phase for calculation of the slope, i is the number of phases considered in each TCRP, and tki is time corresponding to the sample ki. The positive Bi value indicates predominated cell growth or re-growth and the negative Bi value indicates predominated cell inhibition/killing. An absolute value of slope, denoted as |Bi|, represents the rate of NCIR change.

Three distinct phases captured by three slopes {B1, B2, B3} are commonly observed in a typical TCRP (Fig. 3), which characterize various shapes of TCRPs. The length of each phase is determined by identifying the turning points, called curvature κ, in each phase.20 The kth curvature κk is calculated by:

 
image file: c6ra18515k-t6.tif(6)
where image file: c6ra18515k-t7.tif, image file: c6ra18515k-t8.tif is rate of NCIR change, and k = 1, 2,…, K − 1.


image file: c6ra18515k-f3.tif
Fig. 3 Characterization of the shape of a TCRP by using a slope approach. (a) U and reverse-U shapes with three distinct slopes for paclitaxel (# 8) at 2.22 μM. The curve shape contains the information on initial cell killing, slight cell re-growth and then re-killing. (b) Small reverse-U shape and big sigmoidal shape with three distinct slopes for etoposide (# 2) at 22.22 μM. The curve shape contains the information on slight cell growth short after substance exposure, sharply cell inhibition and killing shapely, and then cell killing slowly. (c) Harp-U shape and hill shape with two distinct slopes for cytochalasin B (# 5) at 6.67 μM. The curve shape contains the information on dramatically cell killing immediately after chemical exposure, and then cell killing slowly and gradually. (d) Small reverse-U shape and down-hill linear shape with two distinct slopes for 5-Fu (# 1) at 2.47 μM. The curve shape contains the information on slight cell growth short after substance exposure, and then cell inhibition and killing with relative constant speed.

A fast cell killing could occur in less than 1 hour after exposure to chemical, and when this happens B1 has a large negative value. In this case, a default B1 value of −0.1 was used to cap the slope for numerical reasons (shown in Fig. 3(c)). Furthermore, only two phases of the slopes B1, B2 could be identified in some cases, and a default |B3| value of 0.3 was set as the third phase slope in such cases (shown in Fig. 3(c) and (d)).


Step 3: separation of cell behaviors at different concentrations. TCRPs above the baseline indicate a dominant cell proliferation (Fig. 4(a)). This pattern is defined as a positive pattern for the purpose of classification (left box in Fig. 4(c)). TCRPs below the baseline indicate dominant cytotoxicity response (Fig. 4(b)). This pattern is defined as negative pattern (right box in Fig. 4(c)). The TCRPs demonstrate time kinetics with varying response to chemicals with different concentrations, and the TCRPs also contain other cellular information such as cell morphological changes or cell attachment quality, dynamic cell inhibition/killing (declining curve) or re-growth (increasing curve) at any period of time. The proportion of such cellular events is difficult to estimate. For the purpose of developing a model, the cellular events are assumed to be a result of either cell proliferation or cell inhibition/killing.
image file: c6ra18515k-f4.tif
Fig. 4 Identification of positive and negative patterns. (a) Positive pattern for etoposide (# 2) due to positive value of the median of 1st slopes for eligible TCRPs (left boxplot in (c)). (b) Negative pattern for cytochalasin D (# 4) due to negative value of the median of 1st slopes for eligible TCRPs (right boxplot in (c)). (c) The 1st slope boxplot for etoposide (# 2) and cytochalasin D (# 4). The 1st slopes (B12) of etoposide (# 2) are all greater than zero, which is named the positive pattern. Most of B14 in cytochalasin D (# 4) are less than zero, which is named negative pattern.

Step 4: characterization of TCRP patterns based on the growth rates. In this experiment, there are a total of 82 samples for each TCRP after chemical treatment in HepG2 cell line. The irregular TCRP patterns for a given time range are observed by examining the growth rates, which is the rate of change of NCIR per unit time (2 hour interval) (Fig. 5). To characterize such irregular patterns (uncertainty), the entropy H is calculated as follows:21
 
image file: c6ra18515k-t9.tif(7)
where i (=1, 2, 3) is the ith time interval. For this analysis, three time intervals [24 h, 48 h], [48 h, 72 h] and [72 h, 89 h] are considered. The higher entropy value indicates the higher variability. The entropy is determined in a given time interval to reflect the variability of cell growth and killing within the specified period of time.

image file: c6ra18515k-f5.tif
Fig. 5 TCRP patterns based on the change of growth rates. (a) The negative pattern of the NCIR was observed for ochratoxin A (# 27) at a concentration of 10 μM during the entire incubation time. (b) The negative pattern of the NCIR was observed for doxorubicin (# 16) at a concentration of 1.23 μM during 48 hours exposure period of time. (c) The negative-to-positive patterns were observed for CCCP (# 32) at a concentration of 3.7 μM. (d) The negative–positive–negative patterns were observed for paclitaxel (# 8) at a concentration of 20 μM.

2.3 MOA pattern recognition algorithm

Even though different chemicals have different time-dependent cytotoxic kinetics, chemicals with similar MOA often have similar impedance-based TCRP.17 The features obtained from those TCRPs can be classified into different groups so that the TCRPs within a cluster share the same or similar pattern.
2.3.1 Hierarchical clustering. In this work, a divisive hierarchical clustering analysis integrated with k-means clustering algorithm is used to evaluate groups of features reflecting the differences in TCRPs.22 Three types of feature parameters Ξ, {B1, B2, B3} and {H1, H2, H3} are used in the hierarchical clustering algorithm.
2.3.2 k-Means clustering. The working principle behind k-means clustering algorithm is to build classification models based on a single mean vector. When the chemicals are classified into fixed clusters (c), the k-means clustering is used to optimize classification based on features which distinguish between the shapes of TCRPs. At appropriate hierarchical stages, k-means clustering algorithm is used to divide the selected features into a smaller number of clusters.

Let a dataset Ω = {zn}Nn=1 be the representation of N chemicals where znd is the d dimensional feature vector corresponding to the chemical n. The features are classified into a set of groups {Ci}ci=1. As a result, chemicals sharing same or similar biological activities are grouped together, i.e.

 
image file: c6ra18515k-t10.tif(8)
where c is the number of clusters, Ci is the group in which chemicals have same or similar TCRP pattern. At different stages of classification in hierarchical clustering, zn has different form.

The hierarchical classification procedure is described as follows:


Step 1: data management and QA/QC. The experimental data were organized in the format suitable for MATLAB programming. The TCRPs in the controls from different days were evaluated by inspection of consistency of TCRP patterns and acceptable inter-plate and intra-plate repeatability to ensure the acceptable quality of data for clustering analysis.
Step 2: selection of eligible TCRPs for each chemical. The eligible TCRPs at the mth concentrations (m = 1, 2,…, 11) were identified by calculating the Ξ values. The parameters of slopes {B1n,m, B2n,m, B3n,m} and entropies {H1n,m, H2n,m, H3n,m} were calculated for all eligible TCRPs.
Step 3: initial screening of eligible chemicals for classification. Chemicals which were not qualified for further clustering analysis were excluded based on the criterion Γn:
 
image file: c6ra18515k-t11.tif(9)

If only one of 11 TCRPs were identified as eligible TCRP (Γn < 2), the chemical was considered as an ineligible chemical. The chemicals with more than one eligible TCRP were selected as the first group for further analysis.


Step 4: identification of positive and negative patterns. The 1st group was further divided into two subgroups: positive and negative pattern groups by calculating the median of the 1st slope parameters of all eligible TCRPs for each selected chemical:
 
image file: c6ra18515k-t12.tif(10)

If the median of the 1st slope is greater than zero ([B with combining macron]1n ≥ 0), the chemical is classified into a positive pattern group; otherwise, the chemical is classified as a negative pattern group (see the Fig. 5(c)).


Step 5: classification based on the slope parameters. The positive and negative pattern groups were divided into a number of clusters (c) through analysis of hierarchical clustering based on the slope parameters {[B with combining macron]1n, [B with combining macron]2n, [B with combining macron]3n} and k-means clustering. The optimal number of clusters (copt) was evaluated by a user-defined satisfactory value combined with the Davies–Douldin (DB) index:23
 
image file: c6ra18515k-t13.tif(11)
where cmax is the maximum predefined classification number, νi is the center of the ith cluster, Si is the scatter within the ith cluster, and dij is the separation between cluster Ci and Cj. The DB index is defined as a minimum ratio of the sum of within-cluster scatter to between-cluster separation. The smaller DB value indicates better clustering performance.

Step 6: classification based on the entropy parameters. The chemicals which were not classified using the slope parameter were further analyzed based on the entropy parameters zn = [[H with combining macron]1,n, [H with combining macron]2,n,[H with combining macron]3,n] and k-means clustering:
 
image file: c6ra18515k-t14.tif(12)

3 Results

In order to ensure the quality of clustering analysis, it is important to examine the reproducibility of experimental data for different days on which the experiment was performed. As mentioned before, the experiment of 32 chemicals has been repeated three times in this study. Limited by the capacity of E-plate of RTCA, 16 chemicals have been arranged in each experiment. As a result, we had six batches of data. The inter/intra-plate reproducibility was measured by the coefficient of variation (CV%). Taking the negative control and DMSO for example, the maximum CV% of intra-plate (six batches) and inter-plate in negative control and DMSO were less than 15% and 30%, respectively (shown in Fig. 6). The median values of CV% in inter-plates were less than 10% which were within acceptable limits.
image file: c6ra18515k-f6.tif
Fig. 6 The intra/inter-plate reproducibility assessment. (a) CV% of negative control. The CV%s of intra-plate (six batches) are less than 17.9%, and the CV%s of inter-plate are less than 30% (median is 8.5%). (b) CV% of DMSO (high). The CV%s of intra-plate (six batches) are less than 11.5%, and the CV%s of inter-plate are less than 30% (median is 8.7%). (c) CV% of DMSO (low). The CV%s of intra-plate (six batches) are less than 8.7%, and the CV%s of inter-plate are less than 30% (median is 9.5%). (E1_R1 in the x-label means that the first experiment is repeated at the first time; E1_R2 means that the first experiment is repeated at the second time; and so on.)

The results revealed that examination of the TCRP patterns in controls was the first step for quality assurance of the experimental data. It was recommended to examine the TCRP patterns on the controls after completing experiments. If the TCRP patterns of controls were not consistent or do not show reasonable shapes (e.g. all TCRPs should be above the baseline in the entire exposure period of time), the experiments for the same plate should be repeated.

After quality analysis, data from two experiments were used in the subsequent analysis.

At the TCRPs screening stage, newly defined cell index NCIR as in eqn (2) was adopted to conform the same assays baseline. After TCRPs screening was performed by using the index Ξ, the TCRPs that were similar to the negative control line were excluded. Since these TCRPs were close to the negative control, they did not reflect on the MOA (TCRPs of 32 chemicals are shown in Table 1). At the chemicals screening level, BAPTA-am (# 30) was excluded according to the index Γn.

At the first stage where chemical compounds were classified using positive/negative pattern, the first slope values ([B with combining macron]1n) were used. Fig. 7(a) and (b) described the Box-plot of {[B with combining macron]1n}32n=1 values. Based on the location of median [B with combining macron]1n with respect to zero, these chemicals can be divided into positive (Fig. 7(b)) and negative pattern groups (Fig. 7(a)). It could be seen that some chemicals had larger range of variation in the initial slope (such as # 5 chemical in Fig. 7(a)) while some had smaller range (such as # 8 chemical in Fig. 7(a)). This phenomenon reflects the complex MOA of the tested chemicals and challenge to classify them.


image file: c6ra18515k-f7.tif
Fig. 7 Classification results for the tested compounds. (a) Box plots of the 1st slopes ([B with combining macron]1, n < 0) and the compounds are categorized into the negative pattern group. (b) Box plots of the 1st slopes ([B with combining macron]1, n ≥ 0) and the compounds are categorized into the positive pattern group. (c) The graph for the cluster number vs. the DB index in negative pattern. The optimal clustering number was set as 4 (i.e. k = 4) because the DB index kept approximated const or deteriorated after taking 4 clusters. (d) The classification results of negative pattern based on statistical slopes by using k-means (k = 4) cluster algorithm. (e) The graph for the cluster number vs. the DB index in positive pattern. The optimal clustering number was set as 6 (i.e. k = 6) because the DB index had a little changes after taking 6 clusters. (f) The classification results of positive pattern based on slopes by using k-means (k = 6) cluster algorithm. (The red “+” was the outliers. Each red line “−” in the Box represent the median [B with combining macron]1n values calculated from eligible TCRPs for each substance. D—DNA/RNA enzyme; T—transport protein; P—protein; R—ribosome; M—mitochondrial membrane transport protein; I—ion channels; E—enzyme.)

At the stage of slopes classification, we used slopes {B1n,m, B2n,m, B3n,m} to differentiate between two patterns. The median values {[B with combining macron]1n, [B with combining macron]2n, [B with combining macron]3n} selected by eqn (9) were used for the purpose of classification. Moreover, to find an optimal number of clusters, we implemented the k-means clustering algorithm multiple times from c = 2 to c = 10 and calculated the DB index using eqn (10). Fig. 7(c) and (e) showed the value of the DB index. After analyzing the results for different values of c, the optimal values c = 4 and c = 6 were found for the group number of negative and positive patterns, respectively. These clustering results were shown in Fig. 7(d) and (f).

In Fig. 7(d), the negative pattern group including 16 chemicals were classified into 4 clusters. Cytochalasin D (# 4), cytochalasin B (# 5), latrunculin A (# 31) and latrunculin B (# 6) were actin inhibitors under the guide to receptors and channels (GRAC) class at the molecular level.24 Latrunculin B (# 6) showed different TCRP patterns from those of other 3 actin inhibitors: cell killing in short-term exposure and cell re-growth in long-term (around 12 hours) exposure. The TCRP patterns were similar to those of two tubulin inhibitors paclitaxel (# 8) and vincristine sulfate (# 15). Paclitaxel (# 8) and vincristine sulfate (# 15) were anticancer drugs and had metabolic pathways (CYP) in the liver. After activating the metabolic pathways, the drugs were less toxic at the beginning of exposure, so that the re-growth curves were observed after 12 hours exposure. From the cell profiling perspective, latrunculin B (# 6), paclitaxel (# 8) and vincristine sulfate (# 15) shared the similar TCRP patterns in HepG2. They were classified into the cluster II by using the proposed clustering method. The clustering results for other chemicals were shown in Fig. 7(d) and (f) in detail.

To further subdivide the unclassified chemicals, the entropies {H1n,m, H2n,m, H3n,m} were used. Following the same procedure as before, the median values of entropies {[H with combining macron]1n, [H with combining macron]2n, [H with combining macron]3n} were selected by eqn (11), and Fig. 8 showed the classification results of these unclassified chemicals. After this clustering, the chemicals # 9, # 27 (Fig. 8(a)), # 28 (Fig. 8(c)), # 10 (Fig. 8(d)) were separated. It should be noted that chemicals # 3, # 16 and # 14 were grouped at the cellular level which was different from the Table 1 (shown in Fig. 8(b)), because the TCRPs reflected more than one MOA target and the net effects were not linearly deducible from a single chemical effect at the molecular level.


image file: c6ra18515k-f8.tif
Fig. 8 Classification results based on statistical entropies {H1n,m, H2n,m, H3n,m} by using k-means clustering analysis. (a) # 17, # 19, # 21 and # 32 were classified into cluster I, and # 9, # 18 and # 27 were classified into cluster II. In this case, # 32 reflected main target (transport protein) and is classified with # 17, # 19 and # 21. But the TCRPs of # 18 reflected more than one target and were unclassified. (b) # 14 and # 16 were classified and excluded # 3. In this case, three chemicals were unclassified. (c) # 7 and # 11 were classified and excluded # 28. (d) # 12 and # 13 were classified and excluded # 10.

Based on above analysis, the classification results were summarized in the Table 1. There were 14 clusters among 32 chemicals. Chemicals with similar shapes of TCRPs were clustered together into one group based on the proposed method. It also should be noted that some clusters had only one chemical, because they had different TCRP shapes and cannot be grouped into the GRAC-suggested MOA.

4 Discussion

GARC target labels to chemicals refer to molecular structures that undergo a specific interaction with chemicals to produce effects. The dynamics of chemical-target interactions also called mechanism of action are observed in a living organism. The mechanism of action describes the static or dynamic target of chemical effects at the molecular level.25 Interactions of the cellular molecular target with chemicals and signaling events lead to targeted changes in the cell numbers, cell morphology and cellular function, followed by a corresponding modification of a physiological function at tissue and organ levels.26,27 The consequences of chemical-target action leading to a series of cellular events such as stimulating cell growth, inhibiting cell growth, or combined both effects refer to the term of mode of action (MOA) at the cellular level.

The class label of the selected 32 substances comes from the GRAC-based classification,24 which is at the molecular level. The GRAC-based substances are slightly different from the clusters through cellular profiling. Some chemicals have multiple biological pathways, and will not fall into the same clusters as the GRAC classes suggested.

The primary goal of this work is to explore a pattern recognition strategies so that TCRPs can be used to assay the toxicant mechanism of compounds. The success of the proposed method is based on the concept that the compounds sharing similar MOA produce similar TCRPs. Compared to the conventional end-point assays, which only choose a single time-point to assess the effect of compounds, the TCRPs can capture the kinetically distinct activities at any time that is critical in assessing chemical activity. To simplify the classification, the ample kinetic information of TCRPs is captured by several features that can describe dynamic changes in cellular behavior including cell growth, cell inhibition, killing and spreading, etc. Fig. 1 demonstrates the cell viability after exposure to toxins. The TCRP generated on the RTCA system can provide insight into dynamic cytotoxicity effects of toxicants on the cells, which can be described by the proposed statistical feature. Furthermore, the proposed slope can capture the short term and long term chemical activities.

In the proposed strategy, only three slopes are extracted according to the typical shape of these TCRPs in the two experiments. The feature extraction approach can be easily extended to the case where compounds have multiple kinetically distinct effects. Their entropies have the same interpretation and application.

In this study, only HepG2 cell line is selected to do the MoA classification. The method can be easily used to assay other cell lines. The following guidelines may be followed for selecting different cell lines other than HepG2. (1) Human source or harbouring human genes; (2) representative of various tissue source: e.g., central nervous system, skin or sense organs, cardiovascular system, kidney, gastrointestinal system, liver, respiratory system, etc.; (3) easy to maintain in culture and (4) sensitive to chemical stimulation.

The δ value in eqn (3) determines the number of curves used for the further feature extraction. Larger δ will result in a small number of TCRPs. To get more TCRPs for pattern recognition and the reasonable features, the variation of negative control is suggested as reference. As shown in Fig. 6(a), the CV%s of all intra-plates are less than 17.9%, the δ value must be greater than the maximum CV% of negative control. Therefore, the δ = 0.2 is suggested.

The valuable information reflected in the extracted features relies on the mechanism-specific profiles which are introduced by three cellular parameters, namely, cell number, morphology, and attachment quality. Thus the design of experiment plays a key role in getting high quality TCRPs.

The success of this strategy also depends on the quality of experiments. However, the repeatability of biological experiments is not always satisfactory. Therefore improving repeatability of the cell experiment will lead to better classification.

The developed strategy can be used as a screening tool to identify compounds with unknown function and classify compounds according to similarity of MOA.

The ultimate objective of this study is to achieve the goals set up in the “Toxicology Testing in the 21st Century”; strategies including prioritization of substances for further in-depth toxicological evaluation, identification of MOA for further investigation (e.g., disease-associated pathways), and development of predictive models for in vivo biological response (predictive toxicology).4 Though the goal is stated clearly, it has been difficult to achieve it at the practical level because of several challenges. One of the challenges is the lack of conceptual frameworks to deal with high-dimensional biological and chemical data. The other challenge is that of high-dimensional data collection, from a large number of compounds toward the same culture environment, which is typically very expensive. Our work represents considerable progress towards the identification of MOA problem on HTS system, using easy-to-adopt statistical methods based on multi-concentration TCRPs.

Acknowledgements

The work was supported by the National Nature Science Foundation of China (grant number 61273142), the Priority Academic Program Development of Jiangsu Higher Education Institutions (PAPD), Foundation for Six Talents by Jiangsu Province (grant number 2012-DZXX-045), and Technology research project of Ministry of public security of China (grant number 2015JSYJC029). We also thank Xiao Xu, Xiaobo Wang and Yama Abassi from ACEA Biosciences Inc., David Kinniburgh and Dorothy Yu Huang from Alberta Centre for Toxicology, Fred Ackah and Weiping Zhang from Alberta Health, Swanand Khare and Biao Huang from University of Alberta (Canada) for scientific advice and technical support.

References

  1. T. Seidle and H. Spielmann, Alternative testing strategy report - AXLR8-2 workshop report on a roadmap to innovative toxicity testing, Freie Universität Berlin, Institute of Pharmacy, Berlin, Germany, 2011 Search PubMed.
  2. R. Kavlock, G. Ankley, J. Blancato, M. Breen, R. Conolly, D. Dix, K. Houck, E. Hubal, R. Judson, J. Rabinowitz, A. Richard, R. Setzer, I. Shah, D. Villeneuve and E. Weber, Toxicol. Sci., 2008, 103, 14–27 CrossRef CAS PubMed.
  3. R. Kavlock and D. Dix, J. Toxicol. Environ. Health, Part B, 2010, 13, 197–217 CAS.
  4. National Research Council, Toxicity testing in the twenty-first century: a vision and a strategy, National Academies Press, Washington DC, USA, 2007 Search PubMed.
  5. M. Andersen and D. Krewski, Toxicol. Sci., 2010, 117, 17–24 CrossRef CAS PubMed.
  6. B. Blaauboer, Toxicol. Lett., 2008, 180, 81–84 CrossRef CAS PubMed.
  7. D. Krewski, M. Westphal, M. Al-Zoughool, M. Croteau and M. Andersen, Annu. Rev. Public Health, 2011, 32, 161–178 CrossRef PubMed.
  8. E. Berg, E. Kunkel, E. Hytopoulos and I. Plavec, J. Pharmacol. Toxicol. Methods, 2006, 53, 67–74 CrossRef CAS PubMed.
  9. A. Richard, Chem. Res. Toxicol., 2006, 19, 1257–1262 CrossRef CAS PubMed.
  10. R. Judson, A. Richard, D. Dix, K. Houck, M. Martin, R. Kavlock, V. Dellarco, T. Henry, T. Holderman, P. Sayre, S. Tan, T. Carpenter and E. Smith, Environ. Health Perspect., 2009, 117, 685–695 CrossRef CAS PubMed.
  11. H. Du, J. Li, B. Moe, C. McGuiganb and X. Li, Anal. Methods, 2014, 6, 2053–2058 RSC.
  12. J. Xing, L. Zhu, S. Gabos and L. Xie, Toxicol. in Vitro, 2006, 20, 995–1004 CrossRef CAS PubMed.
  13. J. Boyd, L. Huang, L. Xie, B. Moe, S. Gabos and X. Li, Anal. Chim. Acta, 2008, 615, 80–87 CrossRef CAS PubMed.
  14. Y. Abassi, Biochemica, 2008, 3, 8–11 Search PubMed.
  15. H. Slanina, A. König, H. Claus, M. Frosch and A. Schubert-Unkmeir, J. Microbiol. Methods, 2011, 84, 101–108 CrossRef CAS PubMed.
  16. Roche, xCELLigence system application note No.16: RTCA HT instrument high-throughput GPCR screening, 2011 Search PubMed.
  17. Y. Abassi, B. Xi, W. Zhang, P. Ye, S. Kirstein, M. Gaylord, S. Feinstein, X. Wang and X. Xu, Chem. Biol., 2009, 16, 712–723 CrossRef CAS PubMed.
  18. W. Schoonen, W. Westerink and G. Horbach, Molecular, Clinical and Environmental Toxicology, 2009, vol. 99, pp. 401–452 Search PubMed.
  19. T. Pan, B. Huang, J. Xing, W. Zhang, S. Gabos and J. Chen, Anal. Chim. Acta, 2012, 724, 30–39 CrossRef CAS PubMed.
  20. V. Vapnik, The Nature of Statistical Learning Theory, Springer-Verlag, New York, NY, USA, 2nd edn, 1999 Search PubMed.
  21. A. Denis and F. Crémoux, Methematical Geology, 2002, 34, 889–905 Search PubMed.
  22. T. Mitchell, Machine learning, McGraw-Hill, Inc., New York, NY, USA, 1997 Search PubMed.
  23. X. Rui and W. Donald, IEEE Trans. Neural Network., 2005, 16, 645–678 CrossRef PubMed.
  24. S. Alexander, A. Mathie and J. Peters, Br. J. Pharmacol., 2009, 158, S1–S254 CrossRef CAS PubMed.
  25. P. Imming, Medicinal chemistry: definitions and objectives, drug activity phases, drug classification system, in The Practice of Medicinal Chemistry, Prestwick Chemical Inc., Illkrich, France, 2008, pp. 63–71 Search PubMed.
  26. J. Nowicki and B. Scatton, Measurement and expression of drug effects, in The Practice of Medicinal Chemistry, Prestwick Chemical Inc., Illkrich, France, 2008, pp. 73–84 Search PubMed.
  27. J. Gies and Y. Landry, Molecular drug targets, in The Practice of Medicinal Chemistry, Prestwick Chemical Inc., Illkrich, France, 2008, pp. 85–105 Search PubMed.

This journal is © The Royal Society of Chemistry 2016
Click here to see how this site uses Cookies. View our privacy policy here.