
Facile synthesis of carbon-doped graphitic C3N4@MnO2 with enhanced electrochemical performance†
Qian Yuan Shana,
Bo Guana,
Shi Jin Zhua,
Hai Jun Zhang*b and
Yu Xin Zhangac
aCollege of Materials Science and Engineering, Chongqing University, Chongqing 400044, P. R. China. E-mail: zhangyuxin@cqu.edu.cn
bState Key Laboratory of Refractories and Metallurgy, Wuhan University of Science and Technology, Wuhan 430081, P. R. China. E-mail: zhanghaijun@wust.edu.cn
cNational Key Laboratory of Fundamental Science of Micro/Nano-Devices and System Technology, Chongqing University, Chongqing 400044, P. R. China
First published on 16th August 2016
Abstract
Exploiting the synergistic advantages of two dimensional-two dimensional architectures, carbon-doped graphitic carbon nitride (CCN) and birnessite manganese oxides (MnO2) were coupled to design a highly efficient novel carbon-doped graphitic carbon nitride@MnO2 (CCNM) composite for supercapacitors via a facile hydrothermal method. The structural, morphological and electrochemical properties of the composite were characterized by various physicochemical techniques. These findings indicate that the existence of carbon doping can improve the rate performance of composite electrodes. The specific capacitance in a three-electrode system was 324 F g−1 at a current density of 0.2 A g−1 with capacitance retention of 80.2% after 1000 cycles. In principle, the supercapacitor performance was correlated with the hierarchical structure of the CCNM.
1. Introduction
Two-dimensional (2D) materials such as MoS2, graphene, layered double hydroxide and g-C3N4 are favorable as electrode materials due to their ability to promote ion diffusion and their excellent mechanical and thermal properties.1–5 However, the specific capacitance of these materials is limited, and their layered structures tend to pile up. To improve these limitations, we introduced a 2D–2D structure to enlarge their specific surface area and improve the conductivity of the materials. Considering the important role of surface species in electrochemical behavior, a thin 2D–2D nanosheet is a fairly advantageous morphology for supercapacitor applications.6Graphitic carbon nitride (CN), as a two-dimensional graphite-like structure, has attracted a considerable amount of attention owing to its high nitrogen content, excellent chemical and thermal stability, special optical features, appealing electronic structure and environmentally friendly features, which lead to multifunctional catalytic activities for photocatalysis and other energy conversion processes.7–10 CN is mainly restricted in electrochemical-related applications due to its inherent low electronic conductivity and low surface area. A lot of research has been carried out in the usage of CN hybridized with other materials to enhance its supercapacitive performance.4,11–13 Interestingly, carbon self-doping can not only fine-tune the surface architecture and electronic properties of the semiconductor, but also reduce the introduction of foreign impurities and defects that act as recombination centers.14 Carbon self-doping can induce intrinsic electronic and band structure changes in CN via the formation of delocalized π bonds to increase the visible light absorption, electrical conductivity and surface area.15 Carbon-doped graphitic C3N4 (CCN) could be a promising substrate for active materials as supercapacitor electrodes, and CCN-composites have rarely been applied in energy storage.
On the other hand, MnO2 has, in particular, received an increasing amount of attention owing to its high specific capacitance, low cost, natural abundance, and environmental benignity.16,17 2D MnO2 nanosheets have been widely used to coat carbon nanotubes, graphene, Ni foam, Co3O4 nanowires, etc.18–22 A large number of exposed surface active sites make MnO2 nanosheets ideal building blocks for the synthesis of electrode materials.23 The nanoscale MnO2 structure is capable of incorporating highly porous and electrically conductive materials to form hybrid or composite nanostructures in order to maximize their capabilities and electrochemical performance.24,25 It has been found that a thin film morphology has the highest specific capacitance, and the specific capacitance drops dramatically when the MnO2 thickness is increased.26 MnO2-based nanocomposites used for high-performance supercapacitors have been developed rapidly.
Due to the advantages of CCN and MnO2, herein, we introduce a one-pot strategy to prepare CCN@MnO2 (CCNM) nanocomposites using commercially available polyporous melamine foam as a template and perform a facile hydrothermal method to decorate CCN with flaky MnO2. The electrochemical measurements indicate that the CCNM composites exhibit high specific capacitance resulting from its layered structure.
2. Experimental
2.1 Materials and synthesis
All chemical reagents purchased from Alfa Aesar, were of analytical purity and were used without any further purification. The synthetic process used to prepare CCNM is illustrated in Scheme 1. | ||
| Scheme 1 A schematic representation of the process used to prepare CCNM. | ||
2.2 Materials characterization
The structure and morphology investigations of the samples were carried out with focused ion beam scanning electron microscopy (ZEISS AURIGA FIB/SEM). The chemical composition and crystal phases of the as-prepared products were established by powder X-ray diffraction (XRD, Rigaku D/max 1200, Cu Kα) and thermogravimetric analysis-differential scanning calorimetry (TGA-DSC NETZSCH SYA 449C). Nitrogen adsorption–desorption isotherms were obtained using a micrometrics ASAP 2020 sorptometer to assess surface area and porosity. The specific surface area was calculated using the Brumauer–Emmett–Teller (BET) equation, and the pore size distribution was calculated from the adsorption curve using the Barrett–Joyner–Halenda (BJH) method. A Kratos Axis Ultra X-ray photoelectron spectrometer (Al Kα source) was employed to record the XPS spectra.2.3 Electrochemical measurements
The electrochemical properties of the electrodes were conducted using an electrochemical workstation (CHI 660E) with a three-electrode configuration in a 1 M Na2SO4 aqueous solution. The working electrode consisted of nickel foam as a current collector and electroactive material. This material was comprised of a mixture of active materials, acetylene black and polyvinylidene difluoride (PVDF) at a weight ratio of 7![[thin space (1/6-em)]](https://www.rsc.org/images/entities/char_2009.gif) :2:1. Platinum plate was used as the counter electrode and saturated calomel electrode (SCE) as the reference electrode, respectively. For the tests in a three-electrode configuration, the working electrodes (1 × 1 cm2) were active materials with a mass loading of 2.0 mg cm−2. The positive electrodes were investigated by cyclic voltammetry (CV) in the potential range between −0.2 V and 0.6 V at scan rate between 20–200 mV s−1. Galvanostatic charge–discharge (CC) experiments were performed at current densities ranging between 0.2–2 A g−1 with a potential range of −0.2 to 0.6 V. Electrochemical impedance spectroscopy (EIS) was conducted in the frequency range between 100 kHz and 0.01 Hz with a perturbation amplitude of 5 mV versus the open-circuit potential.
:2:1. Platinum plate was used as the counter electrode and saturated calomel electrode (SCE) as the reference electrode, respectively. For the tests in a three-electrode configuration, the working electrodes (1 × 1 cm2) were active materials with a mass loading of 2.0 mg cm−2. The positive electrodes were investigated by cyclic voltammetry (CV) in the potential range between −0.2 V and 0.6 V at scan rate between 20–200 mV s−1. Galvanostatic charge–discharge (CC) experiments were performed at current densities ranging between 0.2–2 A g−1 with a potential range of −0.2 to 0.6 V. Electrochemical impedance spectroscopy (EIS) was conducted in the frequency range between 100 kHz and 0.01 Hz with a perturbation amplitude of 5 mV versus the open-circuit potential.
3. Results and discussion
3.1 Structure and morphology
Fig. 1a and b display the surface morphology of CCN, which is composed of small irregular sheets with a relatively smooth surface. The morphology of CCNM (Fig. 1c–h) indicates that the CCN layers were uniformly decorated with smaller and film-like nanosheets of MnO2. CCNM-2, which was prepared under 140 °C, has denser and more regular flaky MnO2 than CCNM-1, which was prepared under 120 °C. The region marked by a yellow line is CCN. The CCN nanosheets were covered with smaller and thinner MnO2 nanosheets, as indicated by red arrows. The average thickness of the MnO2 nanosheets calculated from Fig. 1f was 3 nm. The existence of MnO2 nano-pieces not only increases the distance between the CCN layers, but also greatly increases the specific surface area. When the hydrothermal temperature was increased to 160 °C, the oxidizing ability of KMnO4 increased greatly. KMnO4 oxidized the CCN nanosheets partly and caused the nanosheets to become smaller and more irregular (Fig. 1g and h).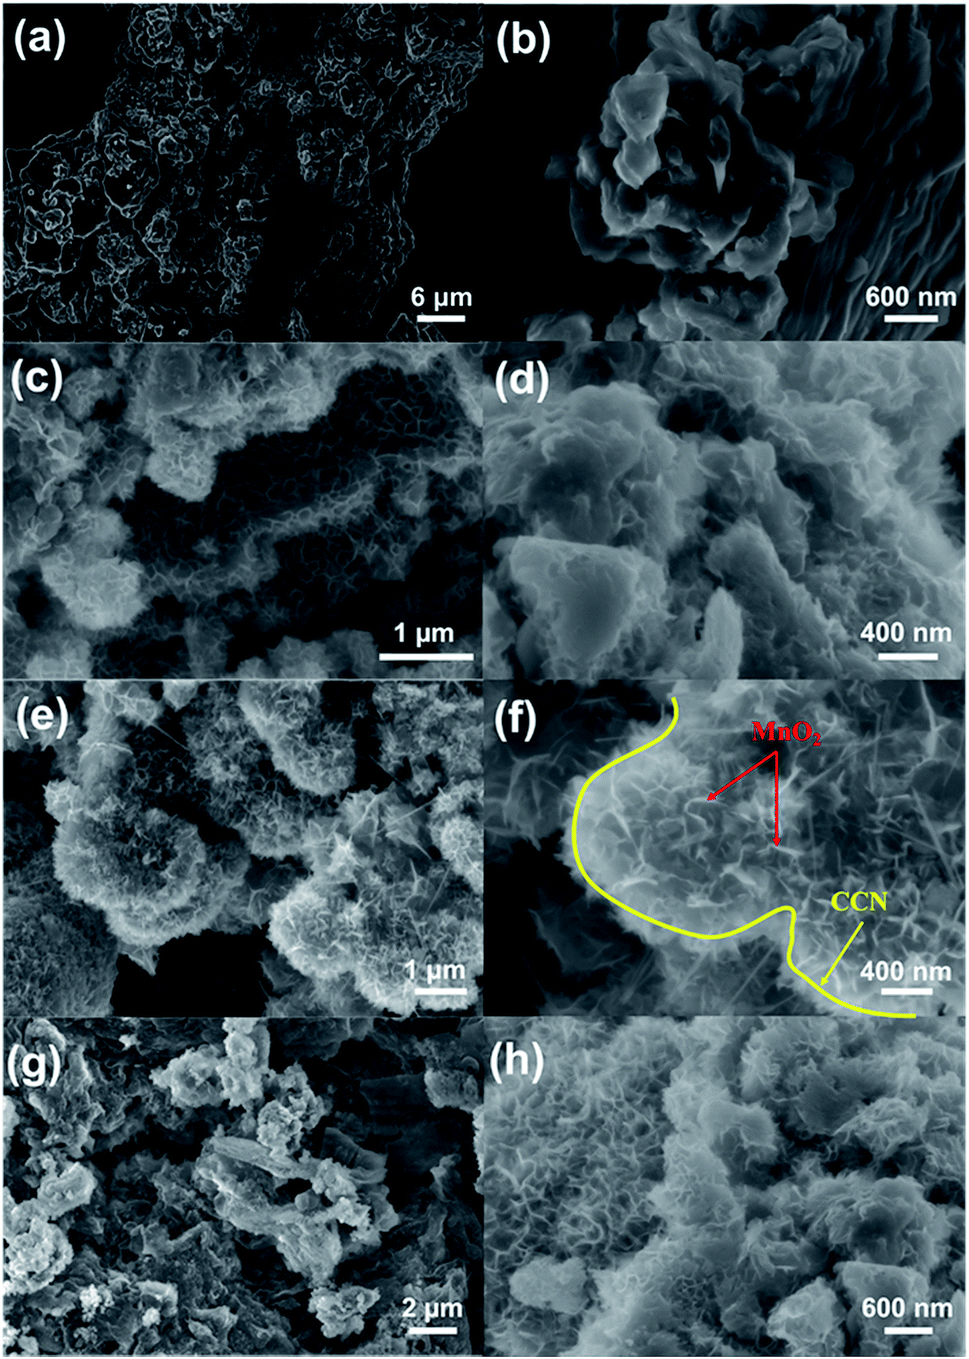 | ||
| Fig. 1 SEM images of (a and b) CCN, (c and d) CCNM-1, (e and f) CCNM-2 and (g and h) CCNM-3. | ||
The XRD patterns of the as-prepared CCN and CCNM composites are presented in Fig. 2. The diffraction pattern of CCN fits well with the characteristic structure without any impurity phase. It has been observed that CCN exhibits a polymeric layered structure, in which the in-phase layers are composed of periodically repeating strands of polymeric melon units.27,28 CCN shows two diffraction peaks around 13.2° and 27.5° indexed as the (100) and (002) planes (JCPDS card no. 87-1526). The peak at 13.2° has much weaker intensity because of the in-plane structural packing motif of the tristriazine units. The peak at 27.5°, assigned to the (002) plane, is related to the stacking of the conjugated aromatic rings.29 When compared with pure CN, the peak at 27.5° of CCN slightly shifted towards a lower 2θ value as the carbon self-doping in CN caused crystal lattice distortion.15 In the spectra of the as-prepared CCNM-1 and CCNM-2 samples, the characteristic peak at 27.5° is observed clearly, indicating the preservation of the well-crystalline CCN structure in the composites. Meanwhile, new peaks at 12.5°, 25.2° and 27.1° can be observed corresponding to a basal spacing of 0.73 nm in the sample CCNM. Those peaks are almost in accordance with characteristic diffraction peaks of birnessite-type manganese crystal (JCPDS card no. 80-1098). In the spectra of CCNM-3, the peak at 27.5° can hardly be observed because the synergistic effect of KMnO4 and high temperature destroyed the lattice structure of CCN.
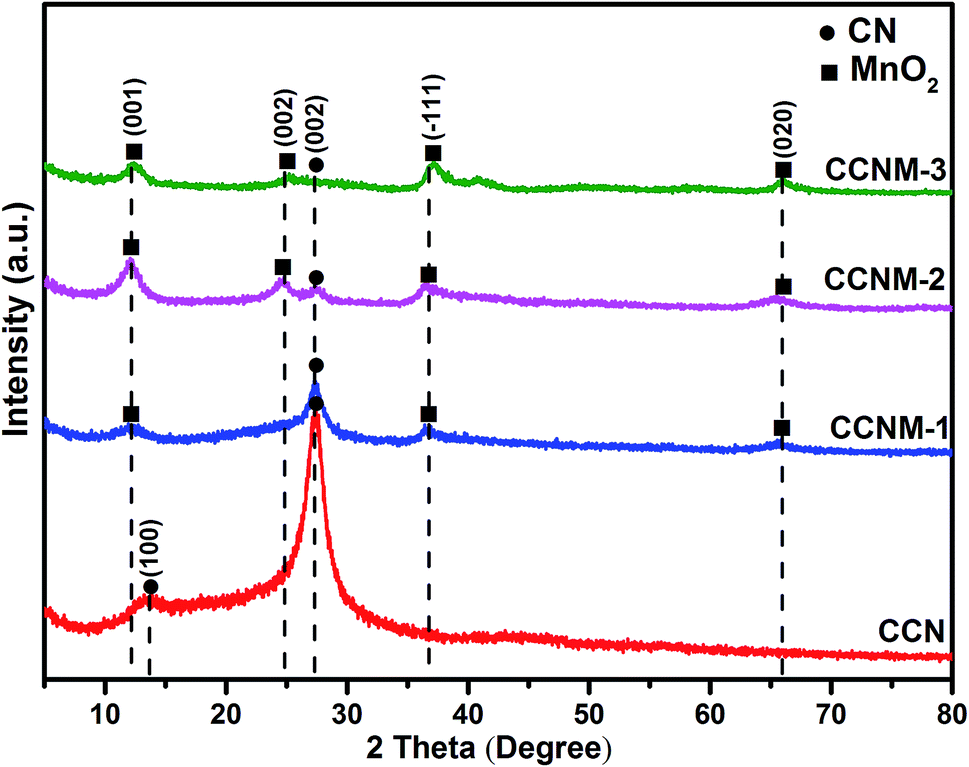 | ||
| Fig. 2 The XRD patterns obtained for the CCN and CCNM samples. | ||
XPS was carried out to determine the chemical compositions of CCNM-2. The XPS survey spectrum (Fig. 3a) displays the presence of the elements C, N, O and Mn. The high-resolution N 1s spectrum of CCNM can be fitted into three peaks (Fig. 3b). The peaks centered at 399.1 and 400.9 eV correspond to the sp2-hybridized aromatic, N bonded to carbon atoms (C![[double bond, length as m-dash]](https://www.rsc.org/images/entities/char_e001.gif) N–C), and the tertiary N groups (N–(C)3), respectively.30–32 According to the NIST XPS database, the weak peak centered at 406.2 eV can be ascribed to the nitrogen atom in the –NO2 group. The present result is consistent with previous reports.33,34 The concentration of the C dopant was estimated to be 7% on the basis of the XPS results. It can be seen that the sample has two C 1s peaks at binding energies of 284.8 and 288.4 eV. The former was stronger, corresponding to C–C coordination of the surface adventitious carbon species from the XPS instrument itself. The latter one can be attributed to sp3-bonded carbon in the N-containing aromatic rings (N–CN).35 Both of them, together with the aforementioned sp2-bonded N, substantiate the existence of the heptazine heterocyclic ring (C6N7) units, which is the elementary building block of CN. The peak area ratios are 0.170, which belong to CCN. These results uphold that the bridging N has been replaced by C due to the self-doping by carbon.14 According to the fitted curve, the Mn 2p1/2 and Mn 2p3/2 peaks are centered at the binding energy of 654.3 and 642.8 eV, respectively. The positions match well with the reported MnO2 values.36,37
N–C), and the tertiary N groups (N–(C)3), respectively.30–32 According to the NIST XPS database, the weak peak centered at 406.2 eV can be ascribed to the nitrogen atom in the –NO2 group. The present result is consistent with previous reports.33,34 The concentration of the C dopant was estimated to be 7% on the basis of the XPS results. It can be seen that the sample has two C 1s peaks at binding energies of 284.8 and 288.4 eV. The former was stronger, corresponding to C–C coordination of the surface adventitious carbon species from the XPS instrument itself. The latter one can be attributed to sp3-bonded carbon in the N-containing aromatic rings (N–CN).35 Both of them, together with the aforementioned sp2-bonded N, substantiate the existence of the heptazine heterocyclic ring (C6N7) units, which is the elementary building block of CN. The peak area ratios are 0.170, which belong to CCN. These results uphold that the bridging N has been replaced by C due to the self-doping by carbon.14 According to the fitted curve, the Mn 2p1/2 and Mn 2p3/2 peaks are centered at the binding energy of 654.3 and 642.8 eV, respectively. The positions match well with the reported MnO2 values.36,37
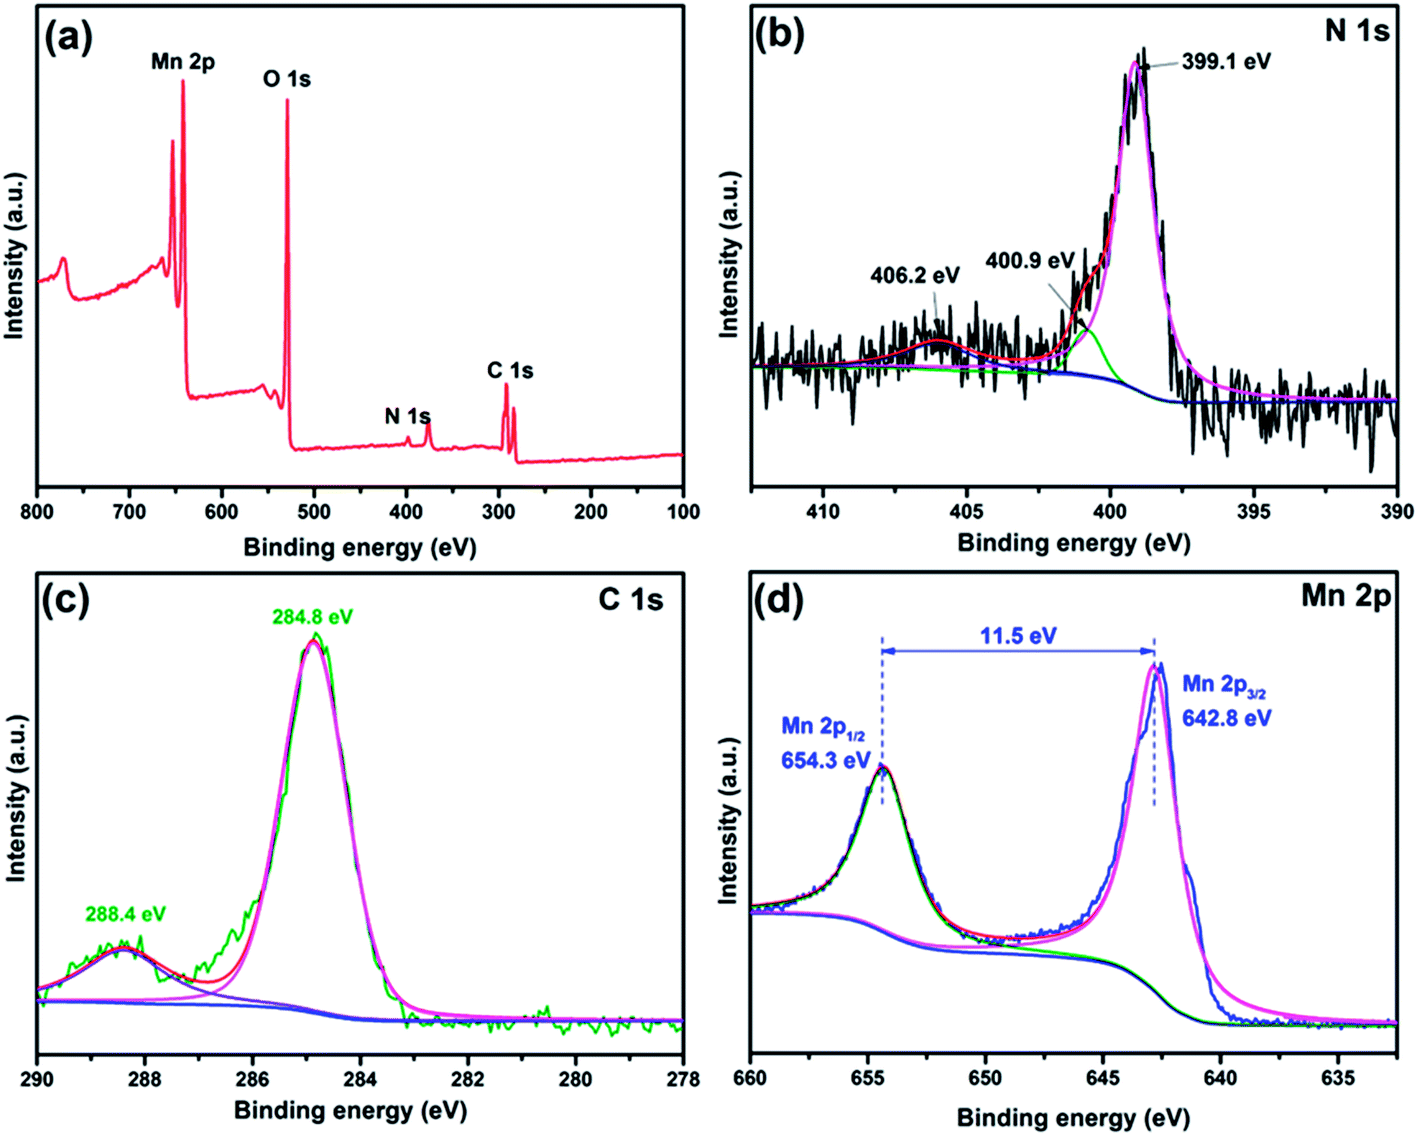 | ||
| Fig. 3 XPS spectra of the CCNM-2 sample: (a) the XPS survey scan; (b) N 1s spectrum; (c) C 1s spectrum and (d) Mn 2p spectrum. | ||
TGA and differential thermal analysis (DTA) are shown in Fig. 4. Fig. 4a shows the overall weight loss of the CCN and CCNM samples. It is certain that with an increase in hydrothermal temperature, the proportion of CCN gradually decreases. The detailed analysis can be seen in Fig. 4c and d. The TG curve obtained for CCN (Fig. 4b) displays a decrease in the temperature around 100 °C, which can be associated with the loss of moisture. The TG curve presents a quite sharp decline between 550–750 °C, which is due to the decomposition of CCN mainly producing gaseous products, consistent with a previous report.8 According to Fig. 5c, there is a decrease at around 200 °C, which is related to the loss of moisture. The weight loss (18.5%) between 300–500 °C corresponds to the loss of oxygen from the MnO2 lattice, resulting in the formation of Mn2O3.38 The temperature of decomposition for CCN is raised to 700 °C because the existence of MnO2 protects CCN from decomposition. Calculated by the TG curves, the molar ratio of MnO2 and CCN in CCNM-1, CCNM-2 and CCNM-3 was 9.18:1, 9.86:1 and 19.09:1, respectively.
 | ||
| Fig. 4 (a) TGA curves obtained for the CCN and CCNM samples. TGA and DTA curves obtained for (b) CCN and (c) CCNM-2. | ||
 | ||
| Fig. 5 Nitrogen adsorption–desorption isotherms and the corresponding BJH pore-size distribution of (a) CCN and (b) CCNM-2. | ||
3.2 Surface area and porosity analysis
The mesoporous architecture was confirmed by N2 adsorption–desorption isotherms and BJH characterization. Fig. 5a and b depict the adsorption–desorption isotherms and pore size distributions of CCN and CCNM-2, respectively. The isotherm can be classified as type IV according to the profile of a hysteresis loop in a relative pressure (PP0−1) range of 0.5–1.0. This reveals that both CCN and CCNM-2 have a typical mesoporous structure, which is further verified from the BJH pore size distribution data (inset of Fig. 5). The nitrogen adsorption–desorption results indicate that CCNM-2 have a specific surface area of 40.2 m2 g−1 with a pore volume of 0.125 cm3 g−1, which is much larger than that of CCN (12.9 m2 g−1). The pore size distribution obtained from the adsorption branch using the BJH method indicates that the average pore size of CCN and CCNM-2 were 19.3 and 13.7 nm, respectively. The moderate specific surface area and porous structure of CCNM-2 provide the possibility of efficient transport of electrons and ions in the electrode, hence leading to enhanced electrochemical properties. The nitrogen adsorption–desorption isotherms and the corresponding BJH pore-size distribution of CCNM-1 and CCNM-3 are shown in Fig. S1.† The BET surface area measurement reveals that CCNM-1 has a surface area of 20.5 m2 g−1 with a pore volume of 0.076 cm3 g−1 and CCNM-3 has a surface area of 19.2 m2 g−1 with a pore volume of 0.089 cm3 g−1. The surface area of CCNM-1 and CCNM-3 are smaller than that of CCNM-2.3.3 Electrochemical properties
For potential supercapacitor applications, the CCNM samples were first adopted to make supercapacitor electrodes in a three-electrode configuration as displayed in Fig. 6. Cyclic voltammetry (CV) tests were performed at a scanning rate of 50 mV s−1 in 1 M Na2SO4 (Fig. 6a). Although there are no distinct redox peaks, the shape of the CV curves deviates from the ideal rectangle, which is suggestive of a faradic pseudocapacitive nature. The galvanostatic charge–discharge plots are given in Fig. 6b and were measured at a constant current density of 1 A g−1 with voltages ranging between −0.2 and 0.6 V. The presence of the triangular symmetry and linear slopes, with respect to the charging/discharging curves confirm the good electrochemical performance. Both of the plots show that CCNM-2 has the best electrochemical behavior in that flaky MnO2 is coated on CCN nanosheet uniformly and constructs a 2D–2D architecture. This structure enables these two materials to co-act well to optimize performance. Table S1† shows the specific capacitance of the samples measured in a 1 M Na2SO4 solution at a current density of 0.2 A g−1. The g-C3N4 barely has any specific capacitance, and the aggregated MnO2 has a relatively low capacitance. While the performance of CCNM-1 and CCNM-3 has increased, they are much lower than that of CCNM-2 because the temperature of the hydrothermal reaction has a profound influence on the formation of the MnO2 nanosheets. When the reaction temperature is too low (120 °C), the decomposition of KMnO4 is very slow and inadequate, and the resulting loaded MnO2 nanosheets are too little and irregular. When the reaction temperature is too high (160 °C), the fast decomposition of KMnO4 causes the MnO2 nanosheets to be thicker and tend they to aggregate. The appropriate reaction environment can maximize the specific capacitance. | ||
| Fig. 6 The electrochemical performance measured in 1 M Na2SO4 solution. (a) CV curves obtained for the CCNM samples at the scan rate of 50 mV s−1. (b) The galvanostatic charge–discharge curves obtained for the CCNM samples at the current density of 1 A g−1. | ||
To further demonstrate whether CCN plays an important role in the as-prepared sample, pure CN was introduced to produce CN@MnO2 (CNM) under the same hydrothermal environment as used for CCNM-2 and the capacitor behavior was investigated. The results are presented in Fig. 7 and 8. Fig. 7a and c present the CV curves obtained for the CCNM-2 and CNM electrodes in 1 M Na2SO4 aqueous electrolyte at various scan rates. In Fig. 7a the shape of the CV curves deviated from rectangle more with an increase in the scan rate because in fast charge and discharge, ion cannot be conducted efficiently. Galvanostatic constant current charging–discharging of CCNM-2 and CNM was investigated at different current densities with an electrochemical window of −0.2 to 0.6 V (Fig. 6b and d). The specific capacitance of CCNM-2 obtained from the discharging curve is calculated to be 324 F g−1 at the current density of 0.2 A g−1, which is much higher than that of the CNM (89 F g−1; Fig. 6d), indicating that the doping of carbon greatly facilitates ion transfer and increases the specific surface area. The nitrogen in CCNM improves the electrode wettability and ion diffusion, and thus, improves the rate capability.39 Previous reports demonstrated that N-containing species are very helpful for increasing the electrical conductance of the material.40
 | ||
| Fig. 7 The CV curves obtained for (a) CCNM-2 and (c) CNM; the galvanostatic charge/discharge curves obtained for (b) CCNM-2 and (d) CNM at different current densities. | ||
 | ||
| Fig. 8 (a) The specific capacitance of CCNM-2 and CNM measured at different current density; (b) the electrochemical impedance spectra of CCNM-2 and CNM under an open circuit potential in the frequency range from 0.01 Hz to 100 kHz; (c) the cycling performance of CCNM-2 and CNM at a current density of 1 A g−1. | ||
Fig. 8a presents that the specific capacitance decreases with an increase in the current density. The CCNM-2 electrode exhibits moderate rate behavior, i.e., 55.9% of its initial capacitance is maintained when the current density increases to 2 A g−1. The decrease in specific capacitance at high current densities is because of the decrease in the efficiency of the utilization of active material. The EIS of the CCNM-2 and CNM electrodes were obtained in the frequency range from 100 kHz to 0.01 Hz under an open circuit potential. The typical Nyquist plots are shown in Fig. 8b. The solution resistance (Rs) values are 1.6 Ω and 1.4 Ω for CCNM-2 and CNM, respectively. The calculated charge-transfer resistance (Rct) values for CCNM-2 and CNM are 16 Ω and 8 Ω, respectively. The combined series resistance of the electrolyte, electrode and current collectors increases gradually with an increase in the loading of MnO2. CCN has thinner nanosheets than CN, which enables it to be decorated with more MnO2. MnO2 is the main contributor to Rs and Rct. It can be seen that the slope of the straight line for the CCNM samples was larger than that of CNM. This observation indicates that the CCNM-2 electrode has a lower diffusive resistance than that of CNM. Fig. 8c shows the cycling stability of the active materials by conducting charge–discharge tests at a current density of 1 A g−1 for 1000 cycles. It can be seen that the specific capacitance of the CCNM-2 electrode maintains 80.2% of its initial value after 1000 cycles while CNM electrode maintains only 59.1%. The loss of capacity during long cycle testing suggests a small increase in the internal resistance.41 Also, during the fast charge/discharge process, some active material became inactive, causing the loss of capacitance.
The improved electrochemical capacitance of CCNM-2 is mainly attributed to the following aspects: (i) the synergistic contribution from CCN and MnO2. The high content of carbon in CCN increases the electrical conductivity, the MnO2 nanosheets provide high capacitance; (ii) the MRF template can reduce the aggregation of sulfourea crystals, which can reduce the thickness of the CCN nanosheets and increase the specific surface area. Also, CCN can provide a direct pathway for electron transport.
4. Conclusions
A 2D–2D architecture of ultrathin MnO2 nanosheets decorated on layered CCN has been prepared via a one-step hydrothermal treatment without any surfactant. The electrochemical tests show that CCNM has a higher utilization and superior properties for electrolyte diffusion when compared to CNM. The obtained CCNM exhibits a larger specific capacitance (324 F g−1) and better stability (80.2% after 1000 cycles) than CCN. These findings indicate that the CCNM composites can be promising active materials for large-scale, cost-effective, environmentally friendly and electrochemically stable supercapacitors.Acknowledgements
The authors gratefully acknowledge the financial support provided by the National Natural Science Foundation of China (Grant no. 21576034), National Training Program of Innovation and Entrepreneurship for Undergraduates (201510611102) and State Key Laboratory of Refractories and Metallurgy (GZ201602). Dr Yuxin Zhang would like to thank Prof. Fan Dong and Dr Zaiwang Zhao for their sincere help and discussions on the synthesis of g-C3N4. Miss Shan appreciates the kind support from Mr Chengcheng Wang and Miss Yishu Bao. The authors would also like to thank the Electron Microscopy Center of Chongqing University for characterization of the materials.References
- K.-J. Huang, L. Wang, Y.-J. Liu, H.-B. Wang, Y.-M. Liu and L.-L. Wang, Electrochim. Acta, 2013, 109, 587–594 CrossRef CAS.
- H. Wang, H. Feng and J. Li, Small, 2014, 10, 2165–2181 CrossRef CAS PubMed.
- H. Chen, L. Hu, M. Chen, Y. Yan and L. Wu, Adv. Funct. Mater., 2014, 24, 934–942 CrossRef CAS.
- L. Xu, J. Xia, H. Xu, S. Yin, K. Wang, L. Huang, L. Wang and H. Li, J. Power Sources, 2014, 245, 866–874 CrossRef CAS.
- X. Li, T. Zhao, K. Wang, Y. Yang, J. Wei, F. Kang, D. Wu and H. Zhu, Langmuir, 2011, 27, 12164–12171 CrossRef CAS PubMed.
- K. M. L. Min-Sun Song, Y. R. Lee, I. Y. Kim, T. W. Kim, J. L. Gunjakar and S.-J. Hwang, J. Phys. Chem. C, 2010, 114, 22134–22140 Search PubMed.
- X. Wang, K. Maeda, A. Thomas, K. Takanabe, G. Xin, J. M. Carlsson, K. Domen and M. Antonietti, Nat. Mater., 2009, 8, 76–80 CrossRef CAS PubMed.
- A. Akhundi and A. Habibi-Yangjeh, Ceram. Int., 2015, 41, 5634–5643 CrossRef CAS.
- W. Ho, Z. Zhang, W. Lin, S. Huang, X. Zhang, X. Wang and Y. Huang, ACS Appl. Mater. Interfaces, 2015, 7, 5497–5505 CAS.
- X. Ma, Y. Lv, J. Xu, Y. Liu, R. Zhang and Y. Zhu, J. Phys. Chem. C, 2012, 116, 23485–23493 CAS.
- P. Wen, P. Gong, J. Sun, J. Wang and S. Yang, J. Mater. Chem. A, 2015, 3, 13874–13883 CAS.
- L. Shi, J. Zhang, H. Liu, M. Que, X. Cai, S. Tan and L. Huang, Mater. Lett., 2015, 145, 150–153 CrossRef CAS.
- Q. Chen, Y. Zhao, X. Huang, N. Chen and L. Qu, J. Mater. Chem. A, 2015, 3, 6761–6766 CAS.
- Z. Zhao, Y. Sun, F. Dong, Y. Zhang and H. Zhao, RSC Adv., 2015, 5, 39549–39556 RSC.
- G. Dong, K. Zhao and L. Zhang, Chem. Commun., 2012, 6178–6180, 10.1039/c2cc32181e.
- X. L. Guo, M. Kuang, F. Li, X. Y. Liu, Y. X. Zhang, F. Dong and D. Losic, Electrochim. Acta, 2016, 190, 159–167 CrossRef CAS.
- H. Zhang, J. Gu, J. Tong, Y. Hu, B. Guan, B. Hu, J. Zhao and C. Wang, Chem. Eng. J., 2016, 286, 139–149 CrossRef CAS.
- X.-J. Li, Y. Zhao, W.-G. Chu, Y. Wang, Z.-J. Li, P. Jiang, X.-C. Zhao, M. Liang and Y. Liu, RSC Adv., 2015, 5, 77437–77442 RSC.
- Y. Liu, X. Miao, J. Fang, X. Zhang, S. Chen, W. Li, W. Feng, Y. Chen, W. Wang and Y. Zhang, ACS Appl. Mater. Interfaces, 2016, 8, 5251–5260 CAS.
- Y. Sun, W. Zhang, D. Li, L. Gao, C. Hou, Y. Zhang and Y. Liu, Electrochim. Acta, 2015, 178, 823–828 CrossRef CAS.
- J. Liu, J. Jiang, C. Cheng, H. Li, J. Zhang, H. Gong and H. J. Fan, Adv. Mater., 2011, 23, 2076–2081 CrossRef CAS PubMed.
- D. Yan, Y. Liu, Y. Li, R. Zhuo, Z. Wu, P. Ren, S. Li, J. Wang, P. Yan and Z. Geng, Mater. Lett., 2014, 127, 53–55 CrossRef CAS.
- X. Wang, H. Liu, X. Chen, D. G. Evans and W. Yang, Electrochim. Acta, 2012, 78, 115–121 CrossRef CAS.
- C. Xiong, T. Li, A. Dang, T. Zhao, H. Li and H. Lv, J. Power Sources, 2016, 306, 602–610 CrossRef CAS.
- M. Kuang, Z. Q. Wen, X. L. Guo, S. M. Zhang and Y. X. Zhang, J. Power Sources, 2014, 270, 426–433 CrossRef CAS.
- S.-L. Chou, J.-Z. Wang, S.-Y. Chew, H.-K. Liu and S.-X. Dou, Electrochem. Commun., 2008, 10, 1724–1727 CrossRef CAS.
- S. Nayak, L. Mohapatra and K. Parida, J. Mater. Chem. A, 2015, 3, 18622–18635 CAS.
- L. Liu, Y. Qi, J. Lu, S. Lin, W. An, Y. Liang and W. Cui, Appl. Catal., B, 2016, 183, 133–141 CrossRef CAS.
- F. Dong, Z. Zhao, T. Xiong, Z. Ni, W. Zhang, Y. Sun and W. K. Ho, ACS Appl. Mater. Interfaces, 2013, 5, 11392–11401 CAS.
- Z. Tong, D. Yang, J. Shi, Y. Nan, Y. Sun and Z. Jiang, ACS Appl. Mater. Interfaces, 2015, 7, 25693–25701 CAS.
- M. Tahir, C. Cao, N. Mahmood, F. K. Butt, A. Mahmood, F. Idrees, S. Hussain, M. Tanveer, Z. Ali and I. Aslam, ACS Appl. Mater. Interfaces, 2014, 6, 1258–1265 CAS.
- Q. Liu, C. Fan, H. Tang, X. Sun, J. Yang and X. Cheng, Appl. Surf. Sci., 2015, 358, 188–195 CrossRef CAS.
- G. H. Dong, K. Zhao and L. Z. Zhang, Chem. Commun., 2012, 48, 6178–6180 RSC.
- Z. W. Zhao, Y. J. Sun, F. Dong, Y. X. Zhang and H. Zhao, RSC Adv., 2015, 5, 39549–39556 RSC.
- R. Hao, G. Wang, H. Tang, L. Sun, C. Xu and D. Han, Appl. Catal., B, 2016, 187, 47–58 CrossRef CAS.
- X. Liu, G. Chen, H. Guan, C. Dong, X. Xiao and Y. Wang, Electrochim. Acta, 2016, 189, 83–92 CrossRef CAS.
- J. Liu, J. Jiang, M. Bosman and H. J. Fan, J. Mater. Chem., 2012, 22, 2419–2426 RSC.
- J. Ma, S. Zhu, Q. Shan, S. Liu, Y. Zhang, F. Dong and H. Liu, Electrochim. Acta, 2015, 168, 97–103 CrossRef CAS.
- Q. H. Liang, L. Ye, Q. Xu, Z. H. Huang, F. Y. Kang and Q. H. Yang, Carbon, 2015, 94, 342–348 CrossRef CAS.
- F. Su, C. K. Poh, J. S. Chen, G. Xu, D. Wang, Q. Li, J. Lin and X. W. Lou, Energy Environ. Sci., 2011, 4, 717–724 CAS.
- Y. L. Wang, B. B. Chang, D. X. Guan and X. P. Dong, J. Solid State Electrochem., 2015, 19, 1783–1791 CrossRef CAS.
Footnote |
| † Electronic supplementary information (ESI) available. See DOI: 10.1039/c6ra18265h |
| This journal is © The Royal Society of Chemistry 2016 |