A new parameter for the stimulation effect and its application in the prediction of the hormetic effect in chemical mixtures

Ting Wanga, Zhifen Lin*abc, Chunsheng Yin*d, Qingqing Ana, Xiaoxian Zhanga, Dali Wanga and Ying Liuc
aState Key Laboratory of Pollution Control and Resource Reuse, College of Environmental Science and Engineering, Tongji University, Shanghai 200092, China. E-mail: lzhifen@tongji.edu.cn
bShanghai Key Lab of Chemical Assessment and Sustainability, Shanghai, China
cCollaborative Innovation Center for Regional Environmental Quality, Beijing, China
dCollege of Marine Science, Shanghai Ocean University, Shanghai 201306, China

Received 18th July 2016 , Accepted 5th November 2016

First published on 23rd November 2016


Abstract

It is important and necessary to study the prediction methods for chronic mixture toxicity at low concentration, particularly mixtures containing chemicals with hormetic effects because pollutants in the real environment exist at low-doses in the form of mixtures. However, this issue is restricted by the question of how to accurately quantify the size of the hormetic effect. The available parameters to qualify the hormetic effect, including the maximum stimulation effect (Ymax) and maximum stimulation effect concentration (M), only characterize the vertical characteristics (effect characteristics) or horizontal variation (concentration characteristics), respectively. A parameter considering both the vertical characteristics and horizontal variation, named “integrated area” (AreaSim), which is the closed area of the fitting curve and abscissa axis (Y = 0) to symbolize the size of the stimulation effect at low concentrations, was raised based on the toxicity mechanism of sulfonamides (SAs) on Vibrio fischeri. Furthermore, the calculation method of integrated area for mixtures was formulated based on the integrated area for a single chemical as follows: AreaSim-mix = aAreaSim-A + bAreaSim-B + c. Then, this formula was applied in different mixed systems containing different chemicals on different organisms, and different formulas were devised. All of the above formulae have good correlation, which implies the general applicability of the integrated area for mixtures. This study provides a new method to accurately determine the size of the hormetic effect of a single chemical and a prediction equation for the hormetic effect in mixtures.

Introduction

It is well known that wild organisms are exposed to complex mixtures at low concentrations for long periods of time rather than individual chemicals at a high concentration for short periods of time, as tested in ordinary laboratory conditions.6,10 Therefore, it is essential for toxicological researchers to direct their attention from single substances at high concentrations to complex mixtures at low concentrations. Single chemicals at low concentrations tend to exhibit the hormetic effect, an interesting dose–response relationship phenomenon characterized by a low-dose stimulation and a high-dose inhibition. Moreover, hormesis likely occurs in reality because there are pollutants in the natural environment at low doses in the form of mixtures.2,3 Mechanisms for hormesis in mixtures have been revealed to some extent.14,15,17 However, quantitative prediction methods for the hormetic effect based on mechanisms are not well raised. Therefore, it is important and necessary to study prediction methods for chronic mixture toxicity at low concentrations, particularly for the mixtures of chemicals with a hormetic effect.

The research on quantitative prediction methods of hormetic effect is in a preliminary stage, and the main methods can be divided into two types according to different concerns: (1) methods that focus on the entire dose–response curves; (2) methods that merely focus on the simulation effect. The former type includes the CA model1,8,11 and six-point methods.20 The CA model has recently been gradually applied to predict hormesis in mixtures. Ge et al.8 studied the hormetic effect of ionic liquids and found that although the CA model can be used to accurately predict the toxicity effect at high concentrations, complete curves cannot be obtained at low concentrations because of the model limitation. Moreover, the CA model can be used only for mixtures whose joint effects are additive instead of antagonistic and synergistic. To overcome the model limitations, Zou et al.20 established the “six-point” method to predict the hormetic effect in mixtures whose joint effects were additive, antagonistic and synergistic at both low and high concentrations. However, the “six-point” method also has certain limitations. For example, this approach has been developed in binary mixtures, whereas pollutants are not typically present as simple binary mixtures, but as multi-component mixtures in the real environment. Therefore, this approach must be improved to predict the hormetic effects of complex mixtures in future.

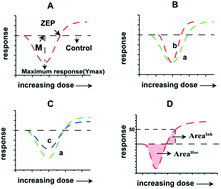
In addition to the CA model and six-point method, the methods that only focus on the stimulation effect include the maximum stimulation effect in mixtures (Ymixmax) and maximum stimulation effect concentration in mixtures (Mmix) (Fig. 1(A)). Belz et al. first found the correlation of Ymixmax and Mmix with the concentration of single chemicals in mixtures, and a prediction model was formulated. The quantization method of Ymixmax and Mmix was simple and easy to use.


image file: c6ra18239a-f1.tif
Fig. 1 The shortcomings of the available stimulation parameters and proposal of a new parameter. (A) The classic parameters to quantify hormetic effect (B and C) the shortcoming of the classic parameters (D) the proposal of the integrated area.

However, Ymax and M characterize individual properties of the hormetic effect. Specifically, Ymax only focuses on the vertical characteristics (effect characteristics), whereas M concentrates on the horizontal variation (concentration characteristics). Calabrese2 revealed that most Ymax values have been 30–60% above the control response, whereas most M values have been less than 10-fold, and approximately 8% of the stimulatory ranges have exceeded a dose range of 100. Furthermore, nearly 4% are greater than 1000-fold. Hence, for both Ymax and M, there is a large variation in different dose–response curves, which makes the individual parameter unable to accurately quantify the hormetic effect. Consequently, this study will examine and resolve the problem of whether we can find a new parameter to characterize the hormetic effect in terms of both verticalness and horizontalness.

As is known, integrated area is a common method used to calculate the area between the curve and the coordinate axes that considers both vertical and horizontal variations of the curve. There are two types of curves: curves with constant vertical variation and varied horizontal variation (identical curves in different variable intervals), and curves with constant horizontal variation and varied vertical variation (different curves in the same variable interval). The integrated area can accurately quantify the differences of both curve types. In recent years, the integrated area has become the standard quantitation method in chromatographic analysis7,16 because integrated area considers both vertical characteristics (response value) and horizontal variation (retention time) of the tested chemicals. Hence, the integrated area comprehensively considers both vertical and horizontal variation, and it may be the parameter we can use to quantify the hormetic effect. This study aims to examine whether the integrated area can be used to solve the abovementioned question.

This study intends to select antibiotics and quorum-sensing inhibitor as the objects because they may exist as mixtures in future after a large application of quorum-sensing inhibitor. Our previous study demonstrated that the single and mixture toxicities of antibiotics and quorum-sensing inhibitors exhibited the hormetic effect. E. coli, Vibrio fischeri and Photobacterium phosphoreum (p.p) were selected as the model organisms. Thus, toxicity bioassays were performed for the following purposes: (1) to determine the chronicity of the single/mixture toxicity of QSIs and sulfonamides on E. coli, Vibrio fischeri and p.p; (2) to propose a new parameter using the integrated area to symbolize the stimulation effect based on the single toxicity mechanism of SAs; (3) based on this parameter, to propose the prediction method for the hormetic effect in mixtures; (4) verify its accuracy and discuss its influence factors.

Method and materials

Tested organisms and chemicals

The tested pharmaceuticals are listed in Table 1 and were purchased from Sigma-Aldrich Company or obtained from the Aladdin Industrial Corporation. All chemicals were of analytical reagent grade or above (≥95%) and used as received without further purification.
Table 1 Name, abbreviation, CAS number and molecular weight of the tested chemicals
No. Name Abbreviation CAS Molecular weight
1 Sulfamonomethoxine SMM 1220-83-3 280.30
2 Sulfadiazine SD 68-35-9 250.28
3 Sulfamethoxypyridazine SMP 80-35-3 280.30
4 Sulfisoxazole SIX 127-69-5 267.30
5 Sulfamerazine SMR 127-79-7 264.30
6 Sulfachloropyridazine SCP 80-32-0 284.72
7 Sulfamethazine SMZ 57-68-1 278.33
8 Sulfapyridine SPY 144-83-2 249.29
9 Sulfaquinoxaline SQ 59-40-5 300.34
10 Sulfameter SM 651-06-9 280.30
11 Sulfadiazine SDX 2447-57-6 310.33
12 Benzofuran-3(2H)-one B3O 7169-34-8 134.13


The tested bacteria E. coli K-12 (MG1655) was purchased from Biovector Science Lab Inc. and subsequently revived and maintained on Luria–Bertani agar slants at 4 °C.

The freeze-dried marine bacterium, Vibrio fischeri (No. ATCC 7744), was supplied by the Institute of Microbiology, Chinese Academy of Sciences (Beijing PRC) and reconstituted and maintained on agar slants at 4 °C.

Chronic toxicity

The toxicity test for Vibrio fischeri was carried out as follows: bioluminescence assays were performed using the diluted bacteria, which were cultured at 20 °C in a yeast–tryptone–salt–glycerol broth for 12–14 h. The toxicity was measured by quantifying the decrease in light emission from the luminous bacteria as a result of exposure to a 3% NaCl solution of a single test chemical or a mixture of test chemicals for 24 h (chronic toxicity). Negative controls (blank test medium that contained 3% NaCl and 0.1% DMSO) were tested with the test solutions. The decrease in light emission was measured at different concentrations, and each concentration was tested in triplicate. Then, the EC50 was calculated using a logistic model based on the relationship between the decrease in light emission and the corresponding concentrations.9,13

The toxicity tests for E. coli were carried out as follows: the chemicals were appropriately dissolved in DMSO to a concentration of not more than 0.1% and subsequently diluted with 1% NaCl solution. A series of concentration-gradient antibiotic solutions and liquid bacteria were successively added to the 96-well plates. Then, the mixture systems were cultured for 24 h at 37 °C for E. coli. The initial and final values of the optical density (OD) were determined. Based on the relationship between the decreases in optical density and the corresponding antibiotic concentrations, the half maximal effective concentration (EC50) was determined.

Curve fitting of the dose–response curve

The relationship between the expected response (y) and toxin concentration (x) was modeled using a logistic regression model if there was no hormetic effect (eqn (1)). The revised logistic regression model enables hormesis (eqn (2)).
 
image file: c6ra18239a-t1.tif(1)
 
image file: c6ra18239a-t2.tif(2)
where δ denotes the expected response at indefinitely large concentrations, α denotes the expected response of the untreated controls, γ denotes the initial rate of increase in response at sub-inhibitory concentrations, EC50 denotes the concentration that causes 50% inhibition of the control response, and β denotes the rate of change around EC50.

The CA model is a classic method to predict mixture toxicity. For binary mixtures, its calculation method is described by eqn (3):8,18

 
image file: c6ra18239a-t3.tif(3)
where PA and PB are the concentrations of chemicals A and B in a mixture, respectively, and ECx,A and ECx,B are the x% concentration of the chemicals when they are separately tested.

Homology modeling and molecular docking

Homology modeling was performed using MODELLER in Discovery Studio 3.1 (Accelrys Software, San Diego, CA, USA). The target sequences of dihydropteroate synthase (Dhps) and LuxR proteins were obtained from NCBI (NCBI accession code: YP-203863, AAQ90196). The templates were prepared by scanning the Protein Data Bank database at NCBI with the BLAST module as implemented in DS. The Dhps modeling used 1AJ0 as the template, and the LuxR modeling used 2UV0, 3IX3 and 3SZT as multiple templates. Homology models were built using the homology modeling protocol and improved by subsequent refinement of the loop conformation using Loop Refinement.

Molecular docking was performed with Discovery Studio 3.0 (ref. 7 and 15) (Accelrys Software Inc., San Diego, CA, USA). CDOCKER is an implementation of a CHARMM (Chemistry at Harvard Macromolecular Mechanics)-based docking tool, which has been shown to be viable. CHARMM has been incorporated into Discovery Studio 3.0 through the Dock Ligands (CDOCKER) protocol.

Statistical analyses

Statistical analyses were performed using the ORIGIN 8.0 software (OriginLab Inc.). The coefficients of determination (R2), standard deviations (SD), F ratios and P values were considered in testing the regression quality.

Results

Proposal of the integrated area based on the toxicity mechanism

Shortcoming of the available stimulation parameters. The maximum stimulation (Ymax) and dosage width of the stimulatory response (M) are the most commonly used parameters to quantify the hormetic effect.2 Relative studies have demonstrated that the maximum stimulatory response was, generally, approximately 30–60% greater than the control value; and the vast majority of dosage widths of the stimulation were less than 100-fold. Based on the two parameters, we can compare the levels of the hormetic effect for different chemicals. As shown in Fig. 1(B), curves a and b have identical values of Ymax, but curve a has a larger M value than curve b; hence, curve a has a stronger hormetic effect than curve b. Similarly, in Fig. 1(C), although curves a and c have identical values of M, curve a has a larger Ymax than curve c; thus, curve a has a stronger hormetic effect than curve c.

There are some defects if the parameters are individually used to symbolize the hormetic effect. The abovementioned analysis indicates that Ymax positively correlates with the hormetic effect only when the values of M are almost identical. Similarly, the width of the stimulatory response positively correlates with the hormetic effect only when the values of Ymax are almost identical.

Toxicity mechanism

Our previous study demonstrated that SAs exhibited hormetic effect by affecting the quorum-sensing system.5 Fig. 2 shows the quorum sensing of luxI/luxR.4 AHL (an autoinducer that is largely generated in Vibrio fischeri) can bind to the luxR protein and produce luxR–AHL complexes. The luxR–AHL complexes can promote the expression of luxI, which increases the Vibrio fischeri luminescence.
image file: c6ra18239a-f2.tif
Fig. 2 luxR/luxI-type quorum-sensing system.

The mechanism of the hormetic effect of SA was speculated in Fig. 3 in our previous study:5 SAs can facilitate the expression of luxR at low dosages, promote the luminescence of Vibrio fischeri and inhibit the activity of Dhps at high dosage; thus, SA have a negative effect on the metabolism of folate.


image file: c6ra18239a-f3.tif
Fig. 3 Toxicity mechanism of SAs proposed by Deng et al. (2012).

Proposal of the integrated area as a parameter based on the toxicity mechanism

To overcome the shortcoming of Ymax and M, we intend to apply the enclosed area (Fig. 1(D), AreaSim) of the fitting curve and abscissa axis (Y = 0) to symbolize the size of the stimulation effect at low concentrations.

Moreover, we apply the enclosed area (Fig. 1(D), AreaInh) of the fitting curve at the EC50 point and the abscissa axis (Y = 0) to symbolize the size of the inhibition effect at high concentrations. The calculation method of AreaInh infers that two aspects jointly determine the size of AreaInh: (1) the concentration of the chemicals and (2) the response of the chemicals. For AreaInh, the response of the chemicals is constant (50%), so AreaInh only correlates with the chemical concentrations. To confirm this speculation, the chronic single toxicities of 10 sulfonamides to Vibrio fischeri were determined, and their AreaInh values were calculated. The results are listed in Table 2 and Fig. 4. A linear regression was performed between toxicity (log(1/EC50)) and AreaInh (eqn (4)); an R-squared value of 0.67 was obtained, which implies that AreaInh can be used to quantify the toxicity of chemicals.

 
log(1/EC50) = −2683.6AreaInh + 5.03 (4)

Table 2 Toxicity of SAs on Vibrio fischeri and docking results
Chemical log(1/EC50) AreaSim AreaInh Eb-dhps Eb-luxR pKa
SMM 4.93 −1.90 × 10⁻⁴ 6.70 × 10⁻⁵ −30.42 −42.48 5.90
SD 4.23 −4.29 × 10⁻⁴ 3.37 × 10⁻⁴ −37.00 −35.42 6.50
SMP 4.83 −1.40 × 10⁻⁴ 9.41 × 10⁻⁵ −33.02 −42.95 7.20
SIX 4.56 −2.61 × 10⁻⁴ 1.25 × 10⁻⁴ −31.09 −38.23 5.00
SMR 4.49 −4.40 × 10⁻⁴ 2.02 × 10⁻⁴ −36.09 −36.31 7.06
SCP 5.07 −2.27 × 10⁻⁴ 5.46 × 10⁻⁵ −28.89 −40.08 6.00
SMZ 4.41 −3.35 × 10⁻⁴ 1.14 × 10⁻⁴ −34.33 −40.93 7.58
SPY 4.81 −4.43 × 10⁻⁴ 1.44 × 10⁻⁵ −30.35 −37.69 8.56
SQ 4.91 −1.58 × 10⁻⁴ 4.74 × 10⁻⁵ −31.28 −46.69 5.50
SM 4.29 −3.23 × 10⁻⁴ 2.04 × 10⁻⁴ −33.60 −42.37 6.80


image file: c6ra18239a-f4.tif
Fig. 4 Single hormetic effects of SAs and QSI on Vibrio fischeri.

N = 10, R2 = 0.67, SD = 0.18, F = 15.88, P = 0.004.

Moreover, the previous study demonstrated that the toxicity of SAs correlated with the pKa and the docking energy between SAs and the Dhps protein (Eb-dhps).19 Hence, AreaInh may be predicted using Eb-dhps and pKa. A multi-linear regression was formulated as follows:

 
AreaInh = −3.10 × 10⁻⁵Eb-Dhps − 1.80 × 10⁻⁵pKa − 7.71 × 10⁻⁴ (5)

N = 10, R2 = 0.68, SD = 0.17, F = 7.38, P = 0.02.

The R-squared value of 0.68 implies that AreaInh can be predicted using Eb-dhps and pKa.

Similarly, we deduced that AreaSim can be predicted using pKa and Eb-luxR. Hence, the values of Eb-luxR between different SAs and LuxR were calculated. A multi-linear regression was performed, and the result is shown in eqn (6). The R-squared value is 0.72, which indicates that AreaSim can be predicted using pKa and Eb-luxR.

 
AreaSim = −2.42 × 10⁻⁵Eb-luxR − 3.95 × 10⁻⁵pKa − 0.001 (6)

N = 10R2 = 0.72, SD = 0.12, F = 12.45, P = 0.005.

Similarly, for the mixed system, the hormetic effects of 27 groups of binary mixtures of SAs on Vibrio fischeri were determined, and the results are listed in Fig. 5 and ESI (Table S6). The values of AreaSim-mix for the mixtures were calculated. image file: c6ra18239a-t4.tif, image file: c6ra18239a-t5.tif, image file: c6ra18239a-t6.tif, image file: c6ra18239a-t7.tif were used to symbolize the contributions of single chemicals to the mixtures. The regression equation is as follows:

 
image file: c6ra18239a-t8.tif(7)


image file: c6ra18239a-f5.tif
Fig. 5 Hormetic effects of SAs and SAs on Vibrio fischeri.

N = 27, R2 = 0.67, SD = 0.18, F = 14.55, P = 0.000.

The consistency of the equations demonstrates that AreaSim-mix can be predicted using the pKa and Eb-luxR of single chemicals.

Accordingly, the relationship between AreaSim-mix for mixtures and AreaSim-A AreaSim-B for single chemicals can be obtained as follows:

 
AreaSim-mix = aAreaSim-A + bAreaSim-B + c (8)

In conclusion, the integrated area for mixtures can be predicted using the integrated area of single chemicals in the mixtures.

Application of the integrated area for mixtures

In this paper, we intend to discuss the hormetic effects of four mixed systems as follows:

(1) The hormetic effects of 27 groups of binary mixtures of SAs on Vibrio fischeri when the toxic ratio was 1[thin space (1/6-em)]:[thin space (1/6-em)]1 were determined. Their fitting parameters and the corresponding stimulation area are listed in the ESI (Table S6). Fig. 5 illustrates parts of the data, and the remainder can be acquired from the ESI (Table S6).

Using the method in Section 3.1, the AreaSimmix values were calculated, and the results are in the ESI. image file: c6ra18239a-t9.tif and image file: c6ra18239a-t10.tif were used to symbolize the contributions of single chemicals to the mixtures. The relationship among AreaSim-mix, image file: c6ra18239a-t11.tifand image file: c6ra18239a-t12.tif can be formulated as follows:

 
image file: c6ra18239a-t13.tif(9)

n = 27, R2 = 0.77, SD = 1.67 × 10⁻⁴, F = 90.83, P = 0.000where ni is the ratio of the actual concentration of chemicals i to EC50, AreaSimA is the stimulation area of chemical A and AreaSimB is the stimulation area of chemical B.

The consistency of eqn (9) implies that the stimulation area of the mixtures can be predicted using the single stimulation area.

(2) The hormetic effects of 30 groups of binary mixtures of SA and B3O on Vibrio fischeri when the toxic ratios were 1[thin space (1/6-em)]:[thin space (1/6-em)]100, 1[thin space (1/6-em)]:[thin space (1/6-em)]10, 1[thin space (1/6-em)]:[thin space (1/6-em)]5, 5[thin space (1/6-em)]:[thin space (1/6-em)]1, 10[thin space (1/6-em)]:[thin space (1/6-em)]1 and 100[thin space (1/6-em)]:[thin space (1/6-em)]1 were determined. Their fitting parameters and the corresponding stimulation area are listed in the ESI (Table S6). Fig. 6 illustrates parts of the data, and the remainder can be acquired from the ESI (Table S6).


image file: c6ra18239a-f6.tif
Fig. 6 Hormetic effects of SAs and B3O on Vibrio fischeri at different ratios.

The relationship amongAreaSim-mix, image file: c6ra18239a-t14.tif and image file: c6ra18239a-t15.tif can also be formulated as follows:

 
image file: c6ra18239a-t16.tif(10)

n = 35, R2 = 0.75, SD = 0.021, F = 51.65, P = 0.000

The consistency of eqn (10) implies that the stimulation area of the mixtures can be predicted using the single stimulation area.

(3) The hormetic effects of 24 groups of binary mixtures of SAs on E. coli when the exposure times were 16, 17, 18, 19, 20, 21, 22 and 23 h were determined. Their fitting parameters and the corresponding stimulation area are listed in the ESI (Table S4). Fig. 7 illustrates parts of the data, and the remainder can be acquired from the ESI (Table S4).


image file: c6ra18239a-f7.tif
Fig. 7 Hormetic effects of SAs on E. coli at different exposure times.

The relationship amongAreaSim-mix, image file: c6ra18239a-t17.tif and image file: c6ra18239a-t18.tif can also be formulated as follows:

 
image file: c6ra18239a-t19.tif(11)

n = 24, R2 = 0.97, SD = 3.96 × 10⁻⁵, F = 437.75, P = 0.000

The consistency of eqn (11) implies that the stimulation area of the mixtures can be predicted using the single stimulation area.

(4) The hormetic effects of 54 groups of binary mixtures on p.p when the toxic ratios were 1[thin space (1/6-em)]:[thin space (1/6-em)]320, 1[thin space (1/6-em)]:[thin space (1/6-em)]180, 1[thin space (1/6-em)]:[thin space (1/6-em)]100, 1[thin space (1/6-em)]:[thin space (1/6-em)]56, 1[thin space (1/6-em)]:[thin space (1/6-em)]32, 1[thin space (1/6-em)]:[thin space (1/6-em)]18, 1[thin space (1/6-em)]:[thin space (1/6-em)]10, 1[thin space (1/6-em)]:[thin space (1/6-em)]3, 1[thin space (1/6-em)]:[thin space (1/6-em)]1, 3[thin space (1/6-em)]:[thin space (1/6-em)]1, 10[thin space (1/6-em)]:[thin space (1/6-em)]1, 18[thin space (1/6-em)]:[thin space (1/6-em)]1, 32[thin space (1/6-em)]:[thin space (1/6-em)]1, 56[thin space (1/6-em)]:[thin space (1/6-em)]1, 100[thin space (1/6-em)]:[thin space (1/6-em)]1, 180[thin space (1/6-em)]:[thin space (1/6-em)]1 and 320[thin space (1/6-em)]:[thin space (1/6-em)]1 were determined (Zou et al., 2013). Their fitting parameters and the corresponding stimulation area are listed in Table S6. Fig. S1 illustrates parts of the data, and the remainder can be acquired from the ESI (Table S5).

 
image file: c6ra18239a-t20.tif(12)

n = 54, R2 = 0.78, SD = 3.71 × 10⁻⁴, F = 94.02, P = 0.000

The consistency of eqn (12) implies that the stimulation area of the mixture can be predicted using the single stimulation area.

Fig. S1 hormetic effect of SAs on p.p under different toxic ratios.

In addition, the studied hormetic effects in mixtures in this paper include different organisms: Vibrio fischeri, E. coli and p.p. Furthermore, all prediction models have good correlation for any of these organisms, which implies the general applicability of the integrated area.

Discussion

Influencing factors of the integrated area for mixtures

In eqn (8), we formulated the relationship between AreaSim-mix for mixtures and AreaSim-A and AreaSim-B for single chemicals. This is a novel equation. It is well known that every equation has restrictive conditions. Mixture toxicity can be affected by many factors such as the properties of single chemicals and interaction among different components. In order to assess the effect of these factors on the integrated area for mixtures, we will discuss the influencing factors from four aspects: joint effect, tested organism, composition of the mixed system and single-chemical properties.

Joint effects on the integrated area for mixtures

Based on the calculation method of integrated area for mixtures (eqn (5)), the integrated area for mixtures only correlates with the integrated area of single chemicals in the mixtures and has no relationship with the interaction among single chemicals. Consequently, the joint effects have no influence on the integrated area for mixtures.

The speculation is demonstrated in eqn (9), where 54 groups of mixed systems included the mixtures of SA and SA, SAs and sulfonamides potentiator (TMP), tetracyclines (THs) and TMP. These mixtures have different joint effects. For example, SA and SA exhibit simple addition, SAs and TMP produce synergism, and THs and TMP show antagonism. Although the joint effects of these mixtures are different, they can be predicted using the same equation, which proves that the joint effects have no influence on the integrated area for mixtures.

Effect of the tested organism on the integrated area for mixtures

The hormetic effects of identical chemicals on different tested organisms are different. For example, for the mixtures of SAs on Vibrio fischeri and E. coli:

For Vibrio fischeri, bioluminescence was selected as the endpoint. The Ymax values of the selected SAs in this paper were 40–80%, and their toxicities (EC50) on Vibrio fischeri were almost identical. Therefore, the integrated areas of single SA were almost identical, i.e., single-chemical integrated areas make identical contributions to the integrated area for mixtures. Thus, the parameter ratio of AreaSimA and AreaSimB in the equation was 1.56 (which is nearly 1).

For E. coli, OD was selected as the endpoint. The Ymax of the selected SAs in this paper were 15–30%, and their toxicity effects were dissimilar. Thus, the integrated areas of single SAs were different, i.e., every single-chemical integrated area contributed differently to the integrated area for mixtures. The parameter ratio of AreaSimA and AreaSimB in the equation was 0.055, which is far below 1.

Hence, the prediction equations of the same mixed system on different tested organisms were different, and different equations must be formulated for different organisms.

Effects of the composition of a mixed system on the integrated areas for mixtures

Considering the derivation process of the integrated area for mixtures, it is known that the integrated area for mixtures correlates with two aspects: (1) single integrated area and (2) molar ratio of single chemicals in the mixed system. If all single chemicals have almost identical toxicities and integrated areas, the parameter ratio in eqn (5) tends to be 1. However, if both toxicities and integrated areas of the single chemicals are different, the parameter ratio in eqn (5) is far from 1. Consequently, the composition of a mixed system affects the integrated area for mixtures.

Prediction equations for different mixed systems on the same organism were formulated in this paper, and the results are listed in eqn (6) and (7). In these two equations, AreaSimA and AreaSimB were 1.36 and 0.87, respectively, in eqn (6) and 0.07 and 4.54, respectively, in eqn (7). The differences in parameters of the two equations result from different compositions of the mixed systems. In Fig. 6, B3O has lower toxicity but higher integrated area than SAs considering the dose–response curves of B3O and SAs. Thus, the contribution of B3O is far larger than that of SAs in the mixed system, and the parameter ratio in eqn (7) is far below 1 (parameter ratio is 0.016); whereas the parameter ratio in eqn (6) is close to 1 (parameter ratio is 1.59).

The above analysis shows that the composition of a mixed system can affect the integrated area for mixtures.

Effect of whether the single chemical exhibits a hormetic effect on the integrated area for mixtures

As known from the calculation process of integrated area for mixtures, the integrated area for mixtures only correlates with the integrated area of single chemicals. If chemical A in the mixtures shows no hormetic effect, but chemical B does, the integrated area for mixtures only depends on the integrated area of chemical B. Hence, whether the single chemical exhibits a hormetic effect is not related to the integrated area for mixtures.

This speculation is demonstrated by eqn (9), where three types of mixtures were included in 54 groups of mixed systems. They are the mixtures of SA and SA, SA and TMP and SA and THs. In the mixtures of SA & SA and TMP & SA, both compositions exhibit hormesis. However, in the mixtures of SA & THs, THs do not show the hormetic effect. The integrated area for mixtures can be predicted using the same equation in these two cases, so whether a single chemical exhibits a hormetic effect does not affect the integrated area for mixtures.

In conclusion, different joint effects of a mixed system and whether a single chemical exhibits hormesis do not affect the integrated-area approach. Hence, the joint toxicity of mixtures can be predicted using the same equations regardless of specific types and with or without a hormetic effect. The organisms and compositions of the mixed systems affect the integrated-area approach. Thus, for the same mixture on different organisms and mixtures with different compositions, different equations must be formulated.

Limitations of the integrated area for mixtures

The integrated area for mixtures has some limitations.

First, the integrated area considers the stimulation effect as a whole and can be used to predict the stimulation effect at specific concentration points, but it cannot describe the entire dose–response curves.

Second, in order to calculate integrated area for mixtures, integrated area for single chemicals must be obtained first. In our study we used a revised logistic regression model to enable a hormetic effect (eqn (2)), and then used the enclosed area module in origin to obtain an integrated area for single chemicals. However, eqn (2) contains severe parameters and is notably inflexible; thus, the reasonable initiation of parameters should be performed but is typically time-consuming. This makes it difficult for us to obtain the integrated area of single chemicals.

Third, the equations in this study have poor quality. This is because stimulation effect of chemicals occurs at low concentration. It is difficult to acquire stable experiment data because stimulation effect is quite modest, with only approximately 30–60% greater responses than the control response.2,3 Hence, the hormetic effect is difficult to replicate than high dose toxicity effects.20 This characterization of stimulation effect caused the poor quality of QSAR models using parameters concerning stimulation effect. For example, Wang et al.14 applied Ymax to predict the toxicity of antibiotics. The value of R2 was only 0.65, which was almost equal to the ones in our manuscript.”

Moreover, the hormetic effect of a mixture is the same as the inhibition effect of a mixture, which is used to symbolize the total biological effect. They both belong to the study of joint effects of a mixture. However, joint effect was affected by many different factors, such as the number of components, the dominating components, the toxic ratios and the interaction between single chemicals.12,13 These factors are difficult to quantify, particularly the interaction between single chemicals. Hence, it is difficult for us to add more parameters to the equations to improve their dependency.

Finally, the integrated area was developed in binary mixtures, whereas pollutants are not typically present as simple binary mixtures but as multi-component mixtures in the real environment. Therefore, this approach must be improved to a hormetic dose–response curve.

Advantages of the integrated area approach compared with the CA model

Although the integrated-area approach has some limitations, it provides some application advantages compared with the CA model.

The CA model is the commonly used method to predict mixture toxicity. In recent years, it has been used to predict the hormetic effect. In this study, the hormetic effects of binary mixtures of SAs on Vibrio fischeri were predicted using the CA model. The results are listed in Fig. 6, which shows that for the mixtures without interaction, the CA model can accurately predict the mixture toxicity at both low and high concentrations. However, for the mixtures with interaction, the CA model cannot be used. Nonetheless, the integrated-area approach can be applied to both interactive and non-interactive mixtures, which is one advantage of the integrated area compared with the CA model.

In addition, the stimulatory section below the lowest stimulatory effect of individual chemicals cannot be predicted by the CA model,10 which results in the NP-zone in the fitted hormetic dose–response curve. Setting the mixtures of SCP and SIX as an example in Fig. 8, the CA model can accurately predict zone A, but cannot predict zone B; however, the integrated area approach considers the stimulation effect as a whole and can be used to accurately predict the hormetic effect, which is another advantage of the integrated area approach compared with the CA model.


image file: c6ra18239a-f8.tif
Fig. 8 Comparisons of the CA model and the integrated area approach.

Acknowledgements

This work was funded by the Foundation of the State Key Laboratory of Pollution Control and Resource Reuse, China (PCRRY16007), the National Natural Science Foundation of China (21377096, and 21577105), the “Climbing” Program of Tongji University (0400219287), the 111 Project and the Science & Technology Commission of Shanghai Municipality (14DZ2261100).

References

  1. T. Backhaus, Å. Arrhenius and H. Blanck, Environ. Sci. Technol., 2004, 8, 6363–6370 CrossRef.
  2. E. J. Calabrese, Hum. Exp. Toxicol., 2010, 29, 249–261 Search PubMed.
  3. E. J. Calabrese and L. A. Baldwin, Trends Pharmacol. Sci., 2002, 23, 331–337 CrossRef CAS PubMed.
  4. T. Defoirdt, G. Brackman and T. Coenye, Trends Microbiol., 2013, 21, 619–624 CrossRef CAS PubMed.
  5. Z. Deng, Z. Lin, X. Zou, Z. Yao, D. Tian, D. Wang and D. Yin, Environ. Sci. Technol., 2012, 46, 7746–7754 CrossRef CAS PubMed.
  6. R. I. L. Eggen, R. Behra, P. Burkhardt-Holm, B. I. Escher and N. Schweigert, Environ. Sci. Technol., 2004, 38, 58A–64A CrossRef CAS PubMed.
  7. V. Ferracci, A. S. Brown, P. M. Harris and R. J. C. Brown, J. Chromatogr. A, 2015, 1383, 144–150 CrossRef CAS PubMed.
  8. H. L. Ge, S. S. Liu, X. W. Zhu, H. L. Liu and L. J. Wang, Environ. Sci. Technol., 2011, 45, 1623–1629 CrossRef CAS PubMed.
  9. Z. Lin, J. Du, K. Yin, L. Wang and H. Yu, Chemosphere, 2004, 54, 1691–1701 CrossRef CAS PubMed.
  10. F. J. Sánchez-Martín, Y. Fan, V. Carreira, J. L. Ovesen, A. Vonhandorf, Y. Xia and A. Puga, Toxicol. Sci., 2015, 146, 52–64 CrossRef PubMed.
  11. S. Stolte, J. Arning, U. Bottin-Weber, M. Matzke, F. Stock, K. Thiele, M. Uerdingen, U. Welz-Biermann, B. Jastorff and J. Ranke, Green Chem., 2006, 8, 621–629 RSC.
  12. D. Y. Tian, Z. F. Lin, D. Q. Yin, Y. L. Zhang and D. Y. Kong, Environ. Toxicol. Chem., 2012, 31, 270–278 CrossRef CAS PubMed.
  13. D. Y. Tian, Z. F. Lin, X. H. Zhou and D. Q. Yin, Toxicol. Appl. Pharmacol., 2013, 272, 551–558 CrossRef CAS PubMed.
  14. T. Wang, D. Wang, Z. F. Lin, Q. Q. An, C. S. Yin and Q. H. Huang, Chemosphere, 2016, 150, 159–167 CrossRef CAS PubMed.
  15. R. H. You, H. Y. Sun, Y. Yu, Z. F. Lin, Q. M. Nan and Y. Liu, Environ. Toxicol. Pharmacol., 2016, 41, 45–53 CrossRef CAS PubMed.
  16. Y. J. Yu, H.-Y. Fu, L. Zhang, X.-Y. Wang, P.-J. Sun, X.-B. Zhang and F.-W. Xie, J. Chromatogr. A, 2015, 1399, 65–73 CrossRef CAS PubMed.
  17. J. Zhang, S. S. Liu and X. W. Zhu, Chemosphere, 2014, 112, 420–426 CrossRef CAS PubMed.
  18. Y. Zeng, L. Wang, L. Jiang, X. Cai and Y. Li, Bull. Environ. Contam. Toxicol., 2015, 95, 260–264 CrossRef CAS PubMed.
  19. X. Zou, Z. Lin, Z. Deng, D. Yin and Y. Zhang, Chemosphere, 2012, 86, 30–35 CrossRef CAS PubMed.
  20. X. M. Zou, Z. F. Lin, Z. Q. Deng and D. Q. Yin, Chemosphere, 2013, 90, 2070–2076 CrossRef CAS PubMed.

Footnote

Electronic supplementary information (ESI) available. See DOI: 10.1039/c6ra18239a

This journal is © The Royal Society of Chemistry 2016
Click here to see how this site uses Cookies. View our privacy policy here.