
Dissolution of brass alloys naturally aged in neutral solutions – an electrochemical and surface analytical study
Federica Cocco a,
Marzia Fantauzzia,
Bernhard Elsener*ab and
Antonella Rossi*a
a,
Marzia Fantauzzia,
Bernhard Elsener*ab and
Antonella Rossi*a
aDipartimento di Scienze Chimiche e Geologiche, Università Degli Studi di Cagliari, Campus di Monserrato S.S. 554 – Italy and INSTM, UdR Cagliari, Italy. E-mail: rossi@unica.it; elsener@ethz.ch
bETH Zurich, Institute for Building Materials, Stefano Franscini Platz 5, 8093 Zurich, Switzerland
First published on 12th September 2016
Abstract
The ageing process of brass alloys, the dissolution rate versus time, was studied in artificial saliva (pH 7.4) and in a phosphate buffer solution (pH 7). Mechanically polished brass alloys (Zn content 18–38 wt%) were exposed for 1, 3 and 16 hours to the solutions open to air at room temperature. The open circuit potential (OCP) and linear polarization resistance (Rp) increased asymptotically with ageing time, indicating a decrease of the dissolution rate upon time. In the artificial saliva the corrosion rate decreased from initially 60 μm per year to 0.5 μm per year after 16 h of exposure, and alloys with a higher zinc content in the alloy showed higher dissolution rates. In the less aggressive phosphate buffer solution the corrosion rate decreased only by a factor of two. This different reaction mechanism can be interpreted on the basis of the surface film composition determined by X-ray photoelectron spectroscopy (XPS) and X-ray induced Auger electron spectroscopy (XAES): while following the exposure to artificial saliva a thick protective film of CuSCN and zinc phosphate was formed, the film present on the brass alloys was very thin and was made of copper oxide Cu2O and ZnO.
1. Introduction
Copper and its alloys as bronze (Cu–Sn) and brass (Cu–Zn) are materials which have been used for centuries in cultural heritage (statues, sculptures, etc.) but also in construction (roofs, facades, etc.) due to their beneficial physical and mechanical properties as well as their good corrosion resistance.1,2 Brass has been used as a material for musical wind instruments since the 16th century, mainly due to its very good acoustic properties, the ease of manufacturing of the instruments and its good corrosion resistance.3 Most of the historical brass wind instruments are now conserved in private or public collections in museums, e.g. the Burri Museum in Bern (Switzerland) with more than 1200 brass wind instruments.4 On the other hand contemporary musical practice intends more and more to play these original instruments in concerts, following the “historically informed performance practice” (HIP).5 When historical instruments get regularly played, the main concern of conservators is the occurrence of corrosion of the brass due to the high humidity inside the instruments during playing which might last for long time.6 The humidity might also condensate and thus damage the artefacts on long-term. The aim of the multi-disciplinary project “Brass instruments of the 19th and early 20th centuries between long-term conservation and use in historically informed performance practice” was to get an insight in the corrosion of brass used for the wind instruments in order to provide the conservators the necessary information on the corrosion rates that might be expected inside the instruments.Many investigations were carried out for understanding the electrochemical behaviour of brass alloys in slightly alkaline,7–9,13–15 neutral9–13,16 and acidic9,13 solutions covering a pH range from 2 to 12. The influence of the pH,9,13 chloride concentration12,14 and alloy composition8,11,13,14 on the film formation was scrutinized. The results have largely been explained on the basis of selective dissolution and dezincification mechanism caused by the difference in the electrochemical potential between copper and zinc. Chloride ions were found to facilitate the dissolution of possibly protective corrosion product layers, causing an increase of the corrosion rate of brass.12 Regarding corrosion ongoing inside the brass wind instruments, the aqueous solutions present in the instruments during and after playing are unknown. Essentially it might be condensed water (pH near neutral or slightly acidic) but with different ions at different concentrations according to the musician, playing time and intensity.17
In this work the electrochemical and corrosion behaviour of brass alloys with zinc content ranging from 18 to 37 wt% of zinc were investigated over time at the open circuit potential (OCP) in contact with two neutral solutions: artificial saliva solution, as an aggressive medium, and diluted phosphate buffer solution of pH 7 as a mild exposure condition. OCP and the polarization resistance (Rp) were measured and allowed to compare the corrosion rate and the reaction mechanism in the two solutions. A further insight on the composition of surface films was gained by XPS/XAES surface analysis. The composition of surface films as determined by XPS, additionally contributed to explain the dissolution mechanism and the corrosion behaviour.
2. Experimental
2.1 Materials and surface preparation
Five different brass alloys with a zinc content ranging from 18 to 38 wt% Zn were produced as thin sheets (ca. 0.5 mm) with a special technology in order to get similar composition and metallurgical structure as found in the historical brass wind instruments from the 19th century.18–20 The alloys were characterised for their metallographic structure (optical microscopy) and composition (XRF). The instrument was a handheld XF Spectrometer – SPECTRO xSORT (Ametek Materials Analysis Division). The measurement methods use an acceleration voltage of 50 kV, while for light elements 15 kV. Each measurement takes 60 seconds. The results are provided in Table 1. In order to get reproducible starting conditions, the surface of the alloys was first ground with emery paper using water as lubricant and mirror-like polished in ethanol (analytical grade supplied by Carlo Erba, Italy) using diamond pastes up to 1 μm (Struers, Bellerup DK) before each measurement. Samples were rinsed with ethanol. At least three independent measurements were carried out for each solution investigated.| Nominal | wt% copper | wt% zinc | wt% lead |
|---|---|---|---|
| Cu | 99.9 (0.1) | <0.05 | — |
| CuZn18 | 84.3 (0.3) | 15.6 (0.1) | — |
| CuZn28 | 71.5 (0.1) | 28.5 (0.1) | — |
| CuZn37 | 64.4 (0.2) | 35.6 (0.1) | — |
| CuZn35Pb1 | 65.2 (0.9) | 33.7 (0.4) | 0.8 (0.1) |
| CuZn38Pb2 | 60.4 (0.4) | 37.8 (0.3) | 1.8 (0.1) |
2.2 Solutions
In order to simulate the environment that could be present inside the brass wind instruments during playing, the following solutions were used:1. Artificial saliva according to Tani–Zucchi21 with pH 7.2–7.8 (Table 2).
| Compound | Concentration |
|---|---|
| KSCN | 0.515 g dm−3 |
| NaHCO3 | 1.264 g dm−3 |
| KCl | 1.490 g dm−3 |
| NaH2PO4 | 0.123 g dm−3 |
| CH4N2O (urea) | 0.100 g dm−3 |
| α-Amilase | 0.9687 g dm−3 |
2. Phosphate buffer solution pH 7 (Carlo Erba) diluted 1![[thin space (1/6-em)]](https://www.rsc.org/images/entities/char_2009.gif) :10.
:10.
All solutions were left open to air. All reagents were of at least ACS grade and the solutions were made up with distilled water having a conductivity of 0.8 μS cm−1.
2.3 Electrochemical tests
A VersaSTAT 4 Model 400 potentiostat/galvanostat (Ametek Inc. PAR, USA) was used to perform the electrochemical measurements under computer control (USB port, software Versa Studio v2). The electrochemical cell was a conventional three-electrode cell described in ref. 22 with a platinum counter electrode and a saturated calomel reference electrode (E = +0.241 V vs. NHE). All potentials are referred to the saturated calomel electrode (SCE). All measurements were performed at room temperature (25 ± 2 °C) in naturally aerated solutions. Each experiment was carried out in a freshly prepared solution and with a newly polished electrode surface. Each experiment was performed three times.2.4 XPS surface analysis and data processing
Surface composition was monitored by X-ray photoelectron spectroscopy (XPS). Survey and detailed spectra were acquired by using a focused Alkα source (1486.6 eV) mounted on a ThetaProbe (ThermoFisher, East Grinsted UK). The pass energy was set at 200 eV and at 100 eV respectively; in these conditions the full-width at half-maximum (fwhm) of the peak height for Ag 3d5/2 was found to be equal to 0.71 eV. The spectrometer was used in the lens standard mode; the emission angle was 53° and the angle between the X-ray source and the axis of the lens was 67°.The residual pressure was always in the 10−8 Pa range. The spectrometer was calibrated according to ISO 15472:2014 and the accuracy was found to be ±0.05 eV. Detailed spectra were processed with CasaXPS software (V2.3.16, Casa Software Ltd, UK). An iterated Shirley–Sherwood background subtraction was applied before peak fitting using a linear-least-squares algorithm. Minor charging was observed and corrected by referencing to the aliphatic carbon at 285.0 eV. The quantitative analysis was carried out on the basis of the first principle approach.23 Details are given in ref. 24.
The lateral resolution was determined using the O 1s line scans over a SiO2 sharp edge. The X-ray beam size of the Thetaprobe, using the analysis conditions presented in this work (nominal beam size diameter 400 μm), was found to be 374.5 μm. This value was obtained by measuring the distance required for a 20–80% increase when scanning over the SiO2 edge. This method follows the instructions provided in the technical report (TR) on the determination of the lateral resolution, better defined as edge spread function, published by the International Organization for Standardization (ISO):ISO/TR 19319:2013. In these conditions the analysed area resulted to be 0.36 mm2.
The sample surfaces were observed by using an optical microscope and no different phases were observable with the 100× magnification, assuming that different phases would have had a different appearance under the microscope light. With the 1000× magnification some dark spots were detectable, but their size was smaller than the smallest XPS nominal spatial resolution achievable with the Thetaprobe (15 μm spot size corresponding to an area of about 0.0007 mm2).
3. Results
3.1 Open circuit potential measurements
The open circuit potential (OCP) measurements of all the alloys were performed for 1 h, 3 h and 16 h of immersion in solutions open to air. The OCP versus time curves in artificial saliva for pure copper and copper–zinc alloys exhibited all the same trend as for CuZn18 (Fig. 1a) and CuZn37 (Fig. 1b): immediately after immersion the potential (initial potential Et0) was relatively positive, diminished then rapidly to more negative values and started to increase after ca. one hour reaching asymptotically a stable value (potential E16h). The average potential values and their standard deviations are summarized in Table 3. With increasing zinc content in the alloys the potentials became more negative. | ||
| Fig. 1 Open circuit potential versus time curves for (a) CuZn18 and (b) CuZn37 following mechanical polishing and exposure to artificial saliva. Inserts show OCP vs. time for the first three hours. | ||
| Sample | 1 h | 3 h | 16 h | |||
|---|---|---|---|---|---|---|
| Et0 | E1h | Et0 | E3h | Et0 | E16h | |
| Cu | −223 (13) | −348 (4) | −214 (10) | −311 (20) | −224 (9) | −195 (19) |
| CuZn18 | −300 (8) | −344 (5) | −309 (11) | −260 (35) | −297 (11) | −222 (6) |
| CuZn28 | −305 (7) | −320 (11) | −298 (16) | −292 (2) | −308 (14) | −265 (7) |
| CuZn37 | −307 (27) | −319 (3) | −309 (11) | −281 (21) | −306 (33) | −266 (9) |
| CuZn35Pb1 | −306 (16) | −322 (14) | −283 (33) | −310 (16) | −292 (35) | −269 (11) |
| CuZn38Pb2 | −310 (21) | −321 (16) | −310 (7) | −295 (23) | −299 (27) | −281 (4) |
The OCP versus time curves in buffer solution pH 7 for pure copper and the copper–zinc alloys are similar to those shown for CuZn18 (Fig. 2a) and CuZn37 (Fig. 2b): immediately after immersion the potential (initial potential Et0) was negative and increased slightly to more positive values reaching a stable potential (potential t3h, t16h). In contrast to the artificial saliva the OCP values remained stable already after ca. 1 h. The average potential values t0h, t3h, t16h and their standard deviations are summarized in Table 4. The potentials became more negative with increasing zinc content in the alloys.
 | ||
| Fig. 2 OCP versus time curves for (a) CuZn18 and (b) CuZn37 mechanically polished alloy in phosphate buffer pH 7. Inserts show OCP vs. time for the first hour. | ||
| Sample | 1 h | 3 h | 16 h | |||
|---|---|---|---|---|---|---|
| Et0 | E1h | Et0 | E3h | Et0 | E16h | |
| Cu | −80 (5) | −50 (4) | −86 (5) | −55 (3) | −84 (2) | −48 (8) |
| CuZn18 | −145 (4) | −60 (2) | −139 (4) | −65 (1) | −144 (18) | −62 (3) |
| CuZn28 | −143 (3) | −68 (3) | −110 (23) | −84 (21) | −135 (8) | −59 (5) |
| CuZn37 | −166 (5) | −83 (2) | −163 (4) | −76 (3) | −150 (17) | −73 (5) |
| CuZn35Pb1 | −159 (23) | −85 (14) | −149 (14) | −65 (8) | −162 (13) | −65 (8) |
| CuZn38Pb2 | −164 (7) | −89 (1) | −156 (9) | −79 (4) | −157 (2) 8 | −80 (5) |
3.2 Polarization resistance measurements – corrosion rate
Linear polarization resistance measurements (LPR) were performed at the end of each exposure period of 1 h, 3 h and 16 h. The LPR plots measured (not shown) in artificial saliva and in buffer solutions showed very good linearity at ±10 mV around OCP. The average Rp values and standard deviation determined after the different exposure times are summarized in Tables 5 and 6; the uncertainty of the Rp value calculated by a linear curve fit was below 2%.| Sample | 1 h | 3 h | 16 h |
|---|---|---|---|
| Cu | 4.1 (0.4) | 53 (10) | 473 (35) |
| CuZn18 | 2.7 (0.3) | 87 (11) | 173 (59) |
| CuZn28 | 3.3 (0.3) | 148 (32) | 235 (11) |
| CuZn37 | 5.7 (0.6) | 74 (15) | 180 (55) |
| CuZn35Pb1 | 4.7 (1.9) | 48 (10) | 583 (130) |
| CuZn38Pb2 | 5.1 (1.1) | 76 (24) | 120 (10) |
| Sample | 1 h | 3 h | 16 h |
|---|---|---|---|
| Cu | 60 (1) | 90 (5) | 200 (5) |
| CuZn18 | 60 (5) | 70 (12) | 100 (7) |
| CuZn28 | 30 (5) | 100 (11) | 100 (5) |
| CuZn37 | 40 (4) | 50 (8) | 60 (6) |
| CuZn35Pb1 | 30 (3) | 70 (8) | 70 (8) |
| CuZn38Pb2 | 30 (3) | 50 (6) | 80 (7) |
The Rp measurements allow us to estimate the corrosion rate of brass alloys in the two different solutions applying the Stern–Geary equation25 with the constant B set to 25 mV.26 For brass alloys with 18–37% of zinc in phosphate buffer solution the corrosion current density icorr ranged between 0.2–0.4 μA cm−2, corresponding to a corrosion rate vcorr of 3–5 μm per year. In the artificial saliva solution the corrosion rate after 1 h was very high (60 μm per year) but decreased markedly; after 16 h of ageing vcorr is lower then 0.5 μm per year. This is an important results for conservators when historical instruments are played in concerts27 and when using electrochemical sensors to probe the corrosion state.28
3.3 Polarization curves
Potentiodynamic polarization curves were recorded after 1 h exposure to the test solutions. It can be noted that the potential at i = 0 agrees well with the open circuit potential measured after 1 h of immersion. In artificial saliva (Fig. 3a) the curves of all the brass alloys were similar: the cathodic part showed a Tafel behavior with a high cathodic Tafel slope bc of about 250 mV dec−1. The cathodic current density was slightly lower for alloys with low zinc content. The anodic part showed a peak at ca. −300 mV SCE that was more pronounced with increasing zinc content in the alloy. This peak could be tentatively assigned to the oxidation of Cu2O in the film (see XPS data below) to CuO. At more anodic potentials the current density reaches a value of ca. 3 μA cm−2. | ||
| Fig. 3 Potentiodynamic polarization curves of brass alloys after 1 h of contact to (a) the artificial saliva solution and (b) the phosphate buffer solution. | ||
In the phosphate buffer solution of pH 7 the polarization curves (Fig. 3b) exhibited a constant current (plateau) with current density of about 1–2 μA cm−2 in the anodic range and a marked current increase at about +150 mV SCE. The cathodic part of the polarization curves showed no Tafel behavior but a quite constant current density that seems to be a limiting current.
3.4 XPS surface analysis
Samples were analysed after mechanical polishing and after exposure to the test solutions. As example the survey spectra of CuZn37 recorded after 16 h of immersion in the phosphate buffer solution or in the artificial saliva are shown together with the mechanically polished alloy (Fig. 4a). Survey spectra of each sample showed the characteristic signals of Cu, Zn, C 1s and O 1s; in addition characteristic P signals can be found at the surface of samples in contact to the buffer solution. After contact to the saliva solution, nitrogen N 1s and sulphur S 2p and S 2s, were also revealed. | ||
| Fig. 4 Survey spectra (a), CuL3M45M45 (b) and ZnL3M45M45 (c) Auger signals of CuZn37 samples in the mechanically polished state and after 16 hours of contact to the saliva solution and to the phosphate buffer solution pH 7. | ||
As the main photoelectron peaks of copper Cu 2p and of Zinc Zn 2p do not distinguish metallic and oxidized state,29 the high-resolution spectra of the X-ray induced Auger signals CuL3M45M45 (Fig. 4b) and ZnL3M45M45 (Fig. 4c) Auger signals were recorded. Curve fitting of the CuL3M45M45 and ZnL3M45M45 Auger peaks of copper and zinc was performed according to ref. 29. The copper CuL3M45M45 Auger signals before and after contact to the buffer solution (Fig. 4b) showed both metallic and oxidized component, suggesting the presence of a thin film. The signals located respectively at KE 918.5 (0.1) eV and 916.8 (0.1) eV can be attributed to metallic copper and copper(I) oxide Cu2O respectively in agreement with ref. 7 and 29. On the alloys exposed to the saliva solution the spectra showed the components of elemental copper and zinc after 1 hour of exposure; after exposure for 3 and 16 h (Fig. 4b) no metallic component has been revealed. This indicates the formation of a progressively thicker and dense film on the brass surface upon ageing. The signal at 915.7 (0.1) eV can be attributed to CuSCN.30 The ZnL3M45M45 signals of both mechanically polished alloy and after contact to the buffer solution (Fig. 4c) showed the metallic component located at KE 992.3 (0.1) eV and an oxidized component at KE 988 (0.1) eV. On the contrary no metallic signal has been found for the alloy exposed to the saliva solution where only a different oxidized component at KE 986 (0.1) eV (Fig. 4c) was revealed.
4. Discussion
4.1 Influence of the zinc content in brass alloys
The open circuit potentials immediately after immersion of the samples into the electrolyte (t0 Tables 3 and 4) were more positive in the case of pure copper than those measured for the brass alloys both in artificial saliva and in phosphate buffer solution. The small standard deviations indicate that the experimental procedure of sample preparation was controlled and reproducible.The steady-state open circuit potential measured after 16 h of immersion in artificial saliva decreases with increasing zinc content (Fig. 5a). In the buffer solution pH 7 (Fig. 5b) the influence of the zinc content is much less pronounced, in agreement with literature8 where similar results were observed for brass alloys with zinc content ranging from 5.5 to 38% in 0.05 M Na2SO4 solution.
 | ||
| Fig. 5 Influence of the zinc content on the open circuit potentials measured after 1 h, 3 h and 16 h of immersion in (a) artificial saliva, (b) phosphate buffer. | ||
With increasing zinc content in the alloy the polarization resistance Rp decreases slightly for the artificial saliva (Fig. 6a) and the buffer solution (Fig. 6b). Literature work reports a slight increase of the corrosion current density in 0.05 M Na2SO4 from 0.5 μA cm−2 for pure copper to 2 μA cm−2 and for brass CuZn38.8 The results of this investigation (buffer solution pH 7) are in good agreement with the literature.
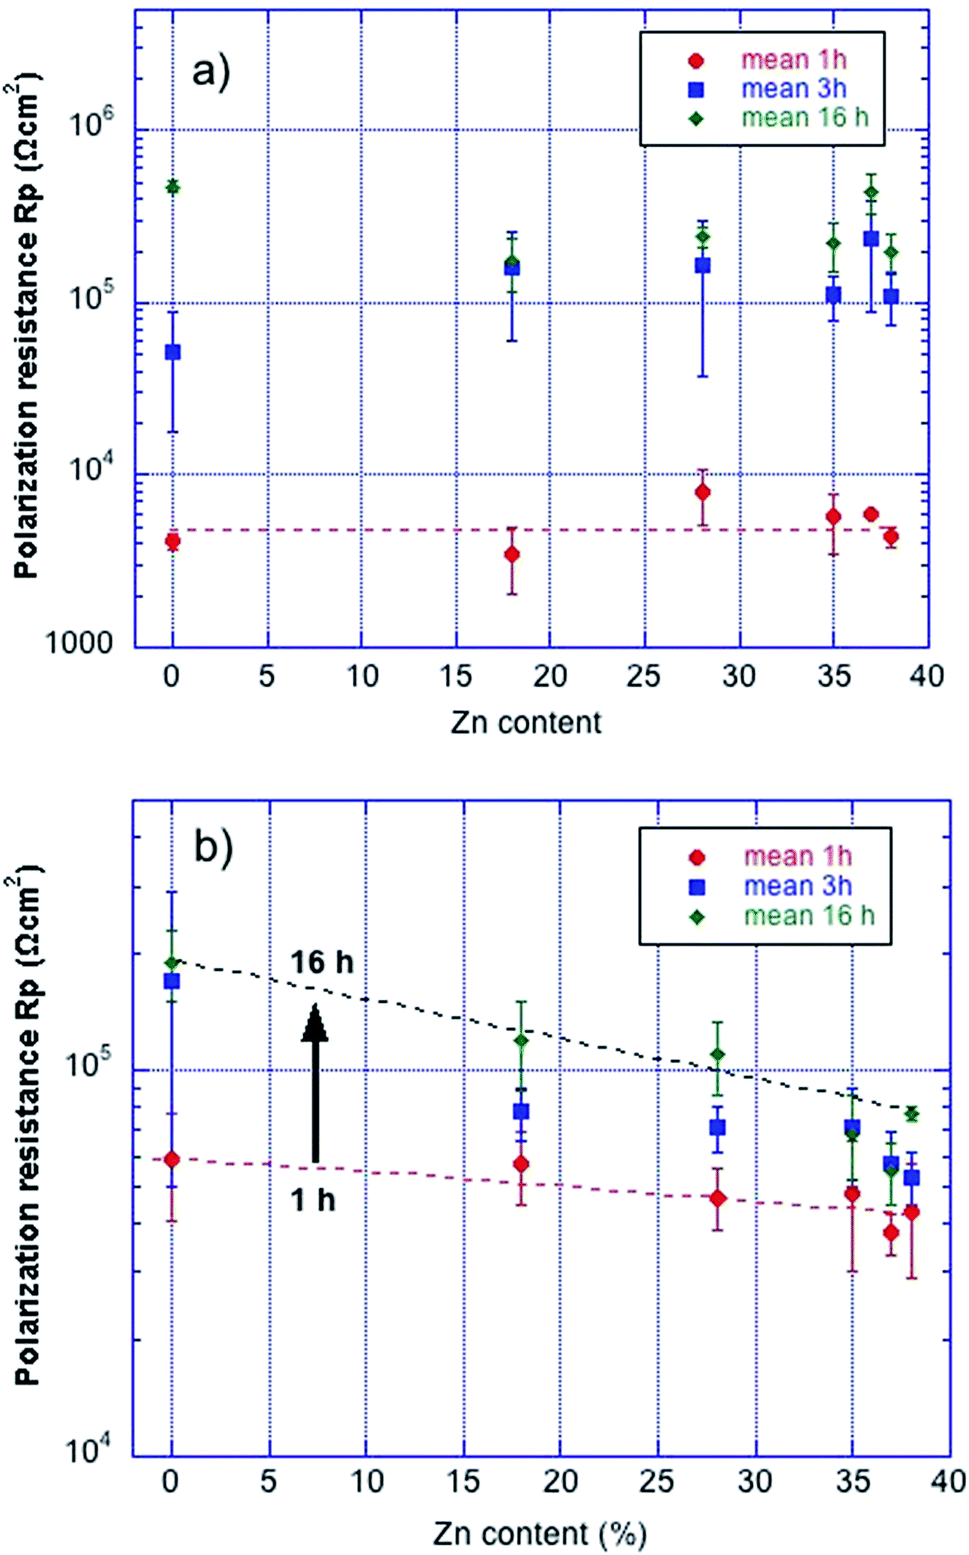 | ||
| Fig. 6 Variation of the specific polarization resistance Rp with time of immersion for the different brass alloys in (a) artificial saliva, (b) phosphate buffer pH 7. | ||
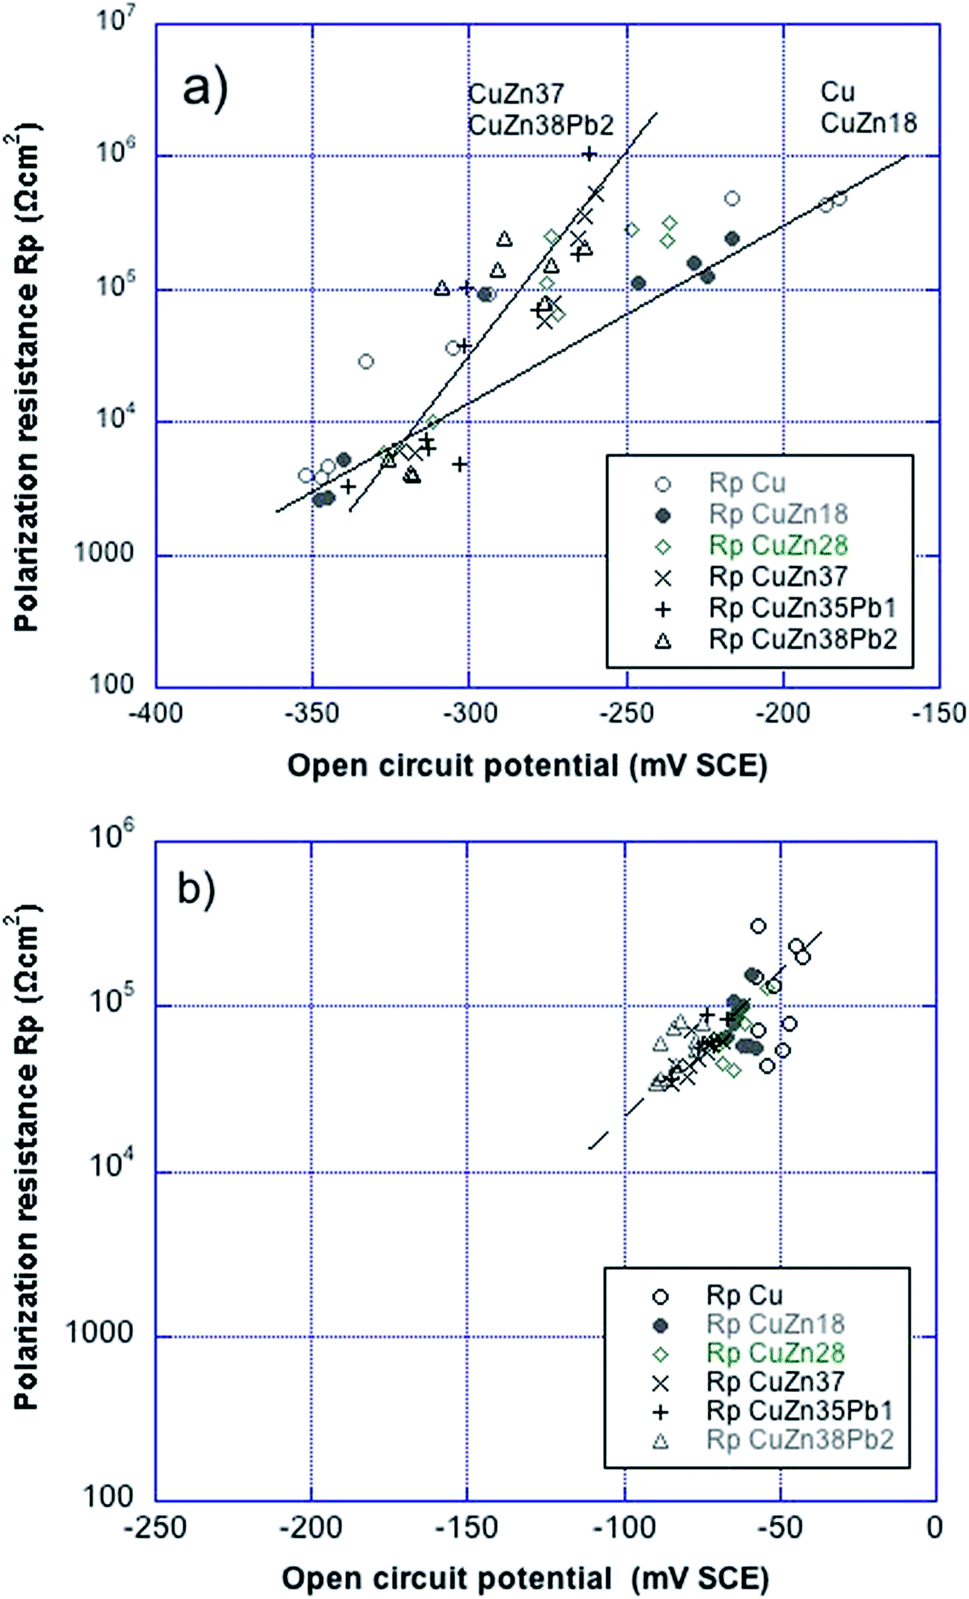 | ||
| Fig. 7 Diagram logRp vs. OCP for brass alloys (18–37 wt% Zn) exposed for 1, 3 and 16 hours in (a) artificial saliva, (b) diluted buffer solution pH 7. Same potential axes are used in order to facilitate the comparison of the two sets of data. | ||
4.2 Influence of exposure time
Prolonged exposure time leads to a progressive ennoblement of the OCP in artificial saliva (Fig. 1a, b and 5a) and to a minor extent also in phosphate buffer pH 7 (Fig. 2a, b and 5b). The same trend is reported in literature for brass alloys in Na2SO4 solutions8 and for brass in buffer solution pH 7.13 The polarization resistance Rp increases with exposure time for all alloys in artificial saliva, an increase by about a factor 50–100 was found following 16 h exposure (Fig. 6a). In buffer solution pH 7 (Fig. 6b) the increase of Rp was only a factor of 3 when examining the alloys with low Zn content and a factor of to 2 with high zinc-content alloys. This might be explained with the formation of a surface film different in the two electrolytes (see below).4.3 Mechanism of brass dissolution – influence of surface films
Based on the plots logRp vs. OCP (Fig. 7) more information on the rate-determining step governing the corrosion of copper and brass alloys in the two different neutral electrolytes here tested can be obtained. In the scatter plots all individual points of the different alloys after different exposure times (1, 3 and 16 h) are shown, for each alloy in general 9 individual points (3 exposure times × 3 replica).
Rp/ΔOCP). Second, as the slope varies with the zinc content, it can be concluded that the zinc content of the alloys influences the rate-determining step and – as seen above – the corrosion behaviour. The curve fitting of the X-ray induced Auger electrons CuL3M45M45 and ZnL3M45M45 of CuZn37 (Fig. 4b and c) substantiates this assumption since after 16 hours of contact to the saliva solution no metallic component of both copper and zinc could be revealed leading to the conclusion that thus a thick film is formed on the surface. Based on the Wagner chemical state plot (Fig. 8), a two dimensional representation of XAES kinetic energy vs. XPS binding energy of a given element,29–33 zinc phosphate Zn3(PO4)2 and copper thiocyanate CuSCN are identified as main compounds of the protective film. The presence of zinc phosphate in the film might explain the influence of the zinc content. In addition, the formation of such a thick protective surface film might justify the marked increase of the polarization resistance Rp upon time in artificial saliva (Fig. 5a).
 | ||
| Fig. 8 Wagner chemical state plots of copper (a) and zinc (b). The BE and KE of the photoelectron and Auger signals are compared with the literature. | ||
Rp vs. OCP, for the alloys exposed to the buffer solution pH 7 is shown in Fig. 7b: the points of all the alloys, from pure copper to the CuZn38Pb2 brass alloy, are grouped in the diagram. It can be concluded that the zinc content in the alloy does not influence the rate-determining step in this case. The Auger spectra of the CuZn37 alloy exposed for 16 h to the buffer solution (Fig. 4b and c) shown the presence of the copper and zinc metallic components located respectively at 918.5 (0.1) eV and 992.3 (0.1) eV. The detection of the metallic components from the substrate indicates that the thickness of the oxide layer formed at the surface is very thin: lower than the sampling depth which is estimated to be about 4 nm for Cu and Zn. Wagner chemical state plot29–33 for copper and zinc (Fig. 8) provides evidence that the film is mainly composed by ZnO and Cu2O with a small amount of zinc phosphate. This thin film is rapidly formed, thus the time effect both on OCP (Fig. 2 and 5b) and on the polarization resistance Rp (Fig. 6b) is less pronounced.4.4 Influence of the surface film
The main difference in the corrosion behaviour of brass alloys between the two solutions might be related to the possibility of the formation of a protective surface film in artificial saliva; on the contrary a thin and less protective film is formed in buffer solution at pH 7. This can be further substantiated taking into account previous results obtained on historical instruments27 and on brass model alloys28 and combining all electrochemical data in a logRp versus OCP plot (Fig. 9). In this diagram, three diagonal trend-lines (annotated group A, B and C) with different levels of the polarization resistance are plotted.27 The mechanically polished brass samples measured after 5 min of contact to the solution28 are all similar with an OCP around −150 mV SCE and Rp values around 10 kΩ cm2, thus the freshly polished surfaces showed a corrosion rate of about 20 μm per year. The data obtained from the brass alloys immersed in buffer solution pH 7 after 1, 3 and 16 h of immersion are all located at about −60 mV SCE with a polarization resistance of about 5–10 kΩ cm2; slightly more positive OCP and higher Rp values correspond to longer immersion times. Brass samples immersed in artificial saliva show a clear time dependence and a shift from the trend line “group B” to the trend line “group A”, thus a change in corrosion behaviour due to the formation of a protective film between 1 and 3 hours of immersion. This protective film is becoming thicker and/or more compact in the time between 3 and 16 hours of immersion leading to more positive OCP and Rp values; the corrosion rate decreases but the corrosion mechanism does not change.
 | ||
| Fig. 9 Log(Rp) vs. OCP diagram as diagnostic plot showing the different evolution of brass alloys in artificial saliva and in buffer solution. Other data on brass wind instruments were reported in ref. 27. | ||
5. Conclusions
From this combined electrochemical and surface analytical study the following conclusions on the ageing of brass alloys in neutral electrolytes can be drawn:• The corrosion rate determined from polarization resistance measurements of brass alloys with 18–38% of zinc exposed to artificial saliva (pH 7.4) is initially high (60 μm per year after 1 hour) due to the more aggressive electrolyte. It decreases markedly with prolonged exposure; after 16 h the corrosion rate is lower than 0.5 μm per year. This is due to the formation of a protective film composed of CuSCN and Zn3(PO4)2 on the brass surface that becomes thick and compact upon time and hinders dissolution.
• The same alloys immersed in a diluted phosphate buffer (pH 7) show from the beginning a low corrosion rate, prolonged exposure to the solution had only a minor effect. This can be explained by the formation of a thin film composed of Cu2O, ZnO and a small amount of Zn3(PO4)2 that is formed rapidly but does not evolve upon time to a protective film.
• Increasing zinc content in the alloy leads to less noble open circuit potentials and to higher corrosion rates, this effect is more pronounced in the phosphate buffer solution.
• The thickness and the composition of the surface films formed in the two different electrolytes are essential for the interpretation of the electrochemical results summarized in the diagnostic log Rp vs. OCP plot.
Acknowledgements
The Italian Ministry of University and Research (MIUR) is thanked for financing the PRIN project prot. 2010329WPF_005 “Sustainability in cultural heritage: from diagnosis to the development of innovative systems for consolidation, cleaning and protection”. Sardinia Regional Government is gratefully acknowledged for the financial support P. O. R. Sardegna F. S. E. Operational Program of the Regione Autonoma della Sardegna, European Social Fund 2007–2013 – Axis IV Human Resources, Objective 1.3, Line of Activity 1.3.1 “Avviso di chiamata per il finanziamento di Assegni di Ricerca”. Swiss National Science Foundation for financing part of this study under the project “Brass instruments of the 19th and the early 20th centuries between long-term conservation and use in historically informed performance practice” (CR12I1_146330). The authors would like to thank the Istituto Nazionale di Previdenza Sociale (INPS) for funding the Ph. D. fellowship of Federica Cocco.References
- L. L. Shreir, Corrosion Metal/Environmental Reactions, Newnes – Butterworths, London (UK), 3rd edn, 1994, ch. 4, pp. 33–67 Search PubMed.
- C. D. S. Tuck, C. A. Powell and J. Nuttall, Shreir's Corrosion, ed. T. J. A. Richardson, Elsevier, Amsterdam, 4th edn, 2010, vol. 3.07, pp. 1937–1973 Search PubMed.
- A. Baines, Brass Instruments: their history and development, Dover Publications, Mineola, New York, 1993 Search PubMed.
- A. V. Steiger, Die Instrumentensammlung Burri. Hintergründe und Herausforderungen, Eigenverlag, Bern, 2013 Search PubMed.
- J. Butt, Playing with History – The Historical Approach to Musical Performance, Cambridge University Press, Cambridge, 2002 Search PubMed.
- M. Ledergerber, E. Cornet and E. Hildbrand, presented at International Conference Vienna Talk on Music Acoustics “Bridging the Gaps, Vienna, September, 2015 Search PubMed.
- R. Procaccini, W. H. Schreiner, M. Vasquez and S. Ceré, Appl. Surf. Sci., 2013, 268, 171–178 CrossRef CAS.
- K. M. Ismail, R. M. Elsherif and W. A. Badawy, Electrochim. Acta, 2004, 49, 5151–5160 CrossRef CAS.
- G. Kilincceker and M. Erbil, Mater. Chem. Phys., 2010, 119, 30–39 CrossRef CAS.
- M. Kabasakaloglu, T. Kiyak, O. Sendil and A. Asan, Appl. Surf. Sci., 2002, 193, 167–174 CrossRef CAS.
- W. A. Badawy, S. S. El-Egamy and A. S. El-Azab, Corros. Sci., 1995, 37, 1969–1979 CrossRef CAS.
- H. A. Abd El-Rahaman, Mater. Corros., 1990, 41, 635–639 CrossRef.
- W. A. Badawy and F. M. Al-Kharafi, Corrosion, 1999, 55, 268–277 CrossRef CAS.
- J. Morales, G. T. Fernandez, P. Esparaza, S. Gonzalez, R. C. Salvarezza and A. J. Arvia, Corros. Sci., 1995, 37, 211–229 CrossRef CAS.
- J. Morales, P. Esparaza, G. T. Fernandez, S. Gonzalez, J. E. Garcia, J. Caceres, R. C. Salvarezza and A. J. Arvia, Corros. Sci., 1995, 37, 231–239 CrossRef CAS.
- M. B. Valcarce, S. R. De Sanchez and M. Vazquez, J. Mater. Sci., 2006, 41, 1999–2007 CrossRef CAS.
- L. Fuks, Prediction and measurement of exhaled air effects in the pitch of wind instruments, St. Albans, 1997 Search PubMed.
- M. Senn, H. J. Leber, M. Tuchschmid and N. Rizvic, Romantic Brass II: Französische Hornpraxis und historisch informierter Blechblasinstrumentenbau, ed. D. Allenbach, A. von Steiger and M. Skamletz, Bern, 1st edn, 2016, pp. 398–419 Search PubMed.
- Egger historic brass, http://www.eggerinstruments.ch/index.php/de/7-blog/98-french-romantic-brass, accessed July 2016.
- Web site of the project “Brass instruments of the 19th and early 20th centuries between long-term conservation and use in historically informed performance practice, http://p3.snf.ch/Project-146330, accessed July 2016.
- G. Tani and F. Zucchi, Minerva Stomatol., 1967, 16, 710–713 CAS.
- M. Crobu, M. A. Scorciapino, B. Elsener and A. Rossi, Electrochim. Acta, 2008, 53, 3364–3370 CrossRef CAS.
- M. P. Seah, Practical Surface Analysis, ed. D. Briggs and M. P. Seah, John Wiley & Sons Ltd, Chichester, 2nd edn, 1990, ch. 5, pp. 201–255 Search PubMed.
- M. Fantauzzi, A. Pacella, J. Fournier, A. Gianfagna, G. B. Andreozzi and A. Rossi, Anal. Bioanal. Chem., 2012, 404, 821–833 CrossRef CAS PubMed.
- M. Stern and A. L. Geary, J. Chem. Soc., 1957, 104, 56–63 CAS.
- S. Palomba, Master thesis, University of Cagliari, 2015.
- B. Elsener, M. Alter, T. Lombardo, M. Ledergerber, M. Wöhrle, F. Cocco, S. Palomba, M. Fantauzzi and A. Rossi, Microchem. J., 2016, 124, 757–764 CrossRef CAS.
- B. Elsener, F. Cocco, M. Fantauzzi, S. Palomba and A. Rossi, Mater. Corros., 2016 DOI:10.1002/maco.201608996.
- F. Cocco, B. Elsener, M. Fantauzzi, D. Atzei and A. Rossi, RSC Adv., 2016, 6, 31277 RSC.
- Y. Itzhaik, T. Bendikov, D. Hines, P. V. Kamat, H. Cohen and G. Hodes, J. Phys. Chem. C, 2016, 120, 31–41 CAS.
- G. Moretti, J. Electron Spectrosc. Relat. Phenom., 1998, 95, 95–144 CrossRef CAS.
- M. Fantauzzi, D. Atzei, B. Elsener, P. Lattanzi and A. Rossi, Surf. Interface Anal., 2006, 38, 922–930 CrossRef CAS.
- M. Crobu, A. Rossi, F. Mangolini and N. D. Spencer, Anal. Bioanal. Chem., 2013, 403, 1415–1432 CrossRef PubMed.
| This journal is © The Royal Society of Chemistry 2016 |