Harvesting red fluorescence through design specific tuning of ICT and ESIPT: an efficient optical detection of cysteine and live cell imaging

Uzra Diwana, Virendra Kumara, Rakesh K. Mishrab, Nishant Kumar Ranac, Biplob Kochc and K. K. Upadhyay*a
aDepartment of Chemistry (Centre of Advanced Study), Institute of Science, Banaras Hindu University, Varanasi-221005, India. E-mail: drkaushalbhu@yahoo.co.in
bPhotosciences and Photonics Section, Chemical Sciences and Technology Division, CSIR – National Institute for Interdisciplinary Science and Technology, Thiruvananthapuram-695019, India
cDepartment of Zoology (Centre of Advanced Study), Institute of Science, Banaras Hindu University, Varanasi-221005, India

Received 15th July 2016 , Accepted 25th September 2016

First published on 26th September 2016


Abstract

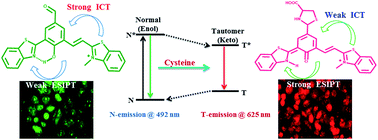
In this report, we constructed 2-(2-hydroxyphenyl)benzothiazole (HBT) based ratiometric fluorescent probe R1, highly selective for cysteine (Cys) in the red channel with a nanomolar detection limit. The rational combination of benzothiazole and benzothiazolium unit within the same molecular frame work act as “two-heads” that allowed the simultaneous harvesting of intramolecular charge transfer (ICT) as well as excited state intramolecular proton transfer (ESIPT). This coupling of dual mechanism in R1 provides selective colorimetric and ratiometric fluorescence response towards Cys from the mixture of various anions and amino acids including foremost interfering thiols viz. HS, Hcy and GSH. R1 shows a weak ESIPT at 497 nm (green fluorescence, N*) which undergoes shifting to 625 nm (red channel K*) upon addition of Cys selectively. Henceforth, R1 was also utilized for marking Cys in live cell imaging in HeLa cells. The sensing phenomenon of R1 for Cys was studied through a number of spectroscopic techniques viz., NMR, IR along with HRMS studies. The density functional theory calculations further strengthened the experimental findings.

Introduction

The ingenious design and development of small molecular probes for selective in situ monitoring of bio-thiols viz., cysteine (Cys), homocysteine (Hcy) and glutathione (GSH) is highly desirable and has been an attractive area of research since the last few years.1–5 The selective recognition of cysteine is quite important, as it is known to play crucial role in several biological activities of proteins, oligopeptides and enzymes etc.6–8 Additionally cysteine also protects the neurons from various diseases like Alzheimer's, Parkinson's as well as helps to convert several toxic heavy metal compounds into stable complexes which can be easily discharged from the body.9–11 The optical detection methods involving chemosensors have been proven better than instrumental methods which are normally used in routine.12–16 The ratiometric fluorescence detection adds up the quality to the optical probes by increasing the dynamic range of measurement which finally leads sensitivity and precision to the measurements.17–19 The ratiometric probes reported hitherto for the detection of the thiol containing amino acids (Cys, Hcy) and tripeptide (GSH) are either based on the simple ICT probe, ESIPT probe or on chemodosimetric approach. The addition of analytes to these probes causes well separated fluorescence emission peak by modulating/interrupting the π-conjugation, the electron cloud or by releasing the fluorophore.20–24 Amongst these the excited state intramolecular proton transfer (ESIPT) that occurs in H-bonded conjugated ring accompanied by photoinduced tautomerization usually exhibits large stokes shift as well as dual emission band characteristics of keto-enol form.25–27 The ESIPT probes commonly employ derivatives of 2-(2-hydroxyphenyl)benzoxazole (HBO),28 2-(2-hydroxyphenyl)benzothiazole (HBT)29 and 2-(2-hydroxyphenyl)benzimidazole30 etc. These probes have got numerous applications from the view point of sensing of a number of analytes viz., Pd2+, Hg2+, Zn2+, H2S, HSO3 etc.31–33 The same are also relevant with respect to photo-switches and organic LEDs etc.34

Taking into account the appealing features of ESIPT dyes and biological importance of Cys, the HBT derived sensor for Cys till date, have been shown in Scheme 1.


image file: c6ra18093k-s1.tif
Scheme 1 Some of the previous and present approaches utilized for fluorescent detection of Cys through HBT based sensors.

The sensing approach in these sensors can be divided into two types; type-a: one with the nucleophilic attack of biothiols on the aldehyde35 and type-b: the regeneration of the free hydroxy group (chemodosimetric approach) which is generally protected by bromoacetyl or bromopropionyl groups.36,37

The coupling of ESIPT along with ICT in the fluorescent probes hitherto induced small stokes shifts and lead fluorescence in the blue to green channel only. Recently, Yang et al. has also reported a rohodol thioester based sensor for biothiols with distinct fluorescence emissions by the combination of as photo-induced electron transfer (PET) and ESIPT mechanism.38 Frequently, these measurements suffered considerable interferences from Hcy/GSH with optimum detection limit and time response (Table S1).

Concerning the aforementioned concepts, we report herein an HBT based ratiometric probe R1 for cysteine in aqueous medium in the red channel with high sensitivity and selectivity over other similar type of biothiols such as Hcy and GSH. The designing of the probe R1 involves condensation of one of the aldehyde group of its precursor compound BHI (an already reported ESIPT based sensor for Cys/Hyc)35 with benzothiazolium iodide. The presence of both, benzothiazole and benzothiazolium iodide group within the same molecular framework R1, lead judicious combination of ICT with ESIPT (Scheme 2). The same causes large stokes shift and allows ratiometric sensing of Cys selectively in the red channel with nanomolar detection limit along with fast response time.


image file: c6ra18093k-s2.tif
Scheme 2 Design strategy and fluorescence response of BHI (already reported probe) and probe R1 (present study).

Results and discussion

Design and synthesis of probe R1

As mentioned above, HBT derived moieties are well known fluorophore that exhibits excellent ESIPT phenomenon, often with dual emission which particularly lie in the blue and green channel.39 Despite of its superior candidature as a fluorescent sensor, usually the need of high excitation energy limits the biological applicability of these HBT dyes. On the other hand, the fluorescence in the red region which provides low auto-fluorescence and can penetrate deeper inside the living tissues are found to be more bio-compatible over conventional blue and green emitting probes.40,41

The rational design of the probe R1 was in order to bestow; (i) excited state intramolecular proton transfer (ESIPT) behavior via HBT, (ii) longer wavelength emission in the red channel, by incorporating benzothiazolium unit and (iii) an electrophilic site for the selective attack of Cys i.e. free aldehyde group (Scheme 3).


image file: c6ra18093k-s3.tif
Scheme 3 Synthesis of probe R1.

Photo physical properties of probe R1

As it is well known that the ICT and ESIPT probes are sensible to the environment, hence we studied the effect of different solvents of varying polarity on the probe R1 (Fig. S1, ESI). The absorption maximum in non-polar solvent such as CHCl3 appeared at 590 nm, was assigned to the intramolecular charge transfer (ICT) band. However, a noticeable blue shift was observed in the same as we move from non-polar to polar solvent (Fig. 1a), highlighting the negative solvatochromism which may be due to unlike extents of stabilization of ground and excited states.42 The probe R1 is expected to exist in two tautomeric forms viz., enol and keto forms and the same was reflected in the form of dual emission bands at 470 nm and 680 nm in CHCl3 (Fig. 1b). The small band at 470 nm was observed as well defined emission band of normal enol form in the excited state (E*) while the emission maximum 680 nm was assigned to the excited keto (K*) form. It was noted that increase in solvent polarity shifts the equilibrium towards the enolic form which further lead to decrease in the ratio of keto/enol form. This finding was in well accordance with the literature, where the ESIPT got quenched due to the presence of intermolecular H-bonding in polar solvent.43–45
image file: c6ra18093k-f1.tif
Fig. 1 Effect of solvent polarity on absorption (a) and fluorescence (b) spectra of R1 (λex = 430 nm).

Optical sensing studies

The sensing ability of R1 (10 μM) towards specific analyte was performed in a mixture of H2O[thin space (1/6-em)]:[thin space (1/6-em)]ACN (7[thin space (1/6-em)]:[thin space (1/6-em)]3, v/v). The R1 was pink in color and displayed an absorption maximum at 502 nm along with a broad band ranging from 355–305 nm. When we gradually added (1–10 equivalents) Cys to the R1 its color got bleached (Fig. S2, ESI). The ICT band showed depletion tendency while a new band at 397 nm was gradually evolved. As shown in Fig. 2, the titration profile of R1 in the presence of Cys showed two well-defined isosbestic points at 430 nm and 373 nm, emphasizing the conversion of R1 to a new species. The lowest detection limit from above titration profile was estimated to be 1.21 × 10⁻⁶ M in the linearity range of 5.0 × 10⁻⁶ to 6.0 × 10⁻⁵ M (Fig. S3, ESI) and the data got fitted in 1[thin space (1/6-em)]:[thin space (1/6-em)]1 binding equation yielding association constant value of (5.21 ± 0.90) × 104 M−1 (R2 = 0.993) (Fig. S4, ESI).
image file: c6ra18093k-f2.tif
Fig. 2 (a) UV-visible titration spectrum of R1 (10 μM) with Cys, (b) corresponding intensity plot and colorimetric response of R1 with Cys (inset); (c) fluorescence titration spectrum of R1 (1.0 μM) with Cys; (d) corresponding intensity plot and fluorescence response of R1 with Cys (inset).

In the emission spectrum, we observed a ratiometric fluorescence change from green to red in the presence of Cys upon exciting R1 at 430 nm (Fig. S5, ESI). The fluorescence titration study with the sequential addition of Cys from 0.1 to 20 equivalents showed a decreasing trend in the enolic peak (492 nm) with a consecutive increase in keto (625 nm) emission (Fig. 2). The binding constant was calculated on the basis of nonlinear fitting using the above titration studies. The data got, excellently fitted in 1[thin space (1/6-em)]:[thin space (1/6-em)]1 binding equation (Fig. S6, ESI) with the binding constant value of (7.50 ± 1.20) × 105 M−1 (R2 = 0.995) and the lowest detection limit was found to be 4.61 × 10⁻⁸ M with a linearity range of 7.50 × 10⁻⁶ to 4.50 × 10⁻⁵ M (Fig. S7, ESI).

Selectivity studies

As selectivity is one of the major requirements for the quantification of an analyte. Hence we tried to quantify the selectivity of probe R1 via UV-vis as well as fluorescence emission studies towards various anions viz., F, Cl, Br, I, AcO, BzO, HPO42−, H2PO4, HSO4, PF6, BF4, ClO4, HS, N3, HSO3, CN (Fig. S8 and S9, ESI) as well as some neutral analytes such as phenylalanine (Phe), glutamic acid (Glu), alanine (Ala), glycine (Gly), lysine (Lys), leucine (Leu), proline (Pro), arginine (Arg), glutamine (Gln), valine (Val), histidine (His), methionine (Met), tryptophan (Trp), tyrosine (Tyr), cysteine (Cys), homocysteine (Hcy) and glutathione (GSH) (Fig. 3a and b). In the UV-vis study the λmax (at 502 nm) got depleted only in the case of Cys with complete bleaching of the pink color similarly, in the emission spectrum, only Cys was able to cause a ratiometric change in the emission wavelength from 492 to 625 nm, whereas the other analytes including some of the foremost interfering analytes such as Hcy, GSH and NaHS were not able to cause any significant alteration (Fig. 3c). Thus our rational modification in the earlier reported probe BHI, not only lead to better detection limit and time response but also enhanced the selectivity of the modified probe R1.
image file: c6ra18093k-f3.tif
Fig. 3 (a) UV-vis and (b) fluorescence response of R1 with different amino acids; (c) bar graph representation for the selectivity of R1 towards thiols.

Time response and pH study

We also monitored the time-dependent changes in the emission spectrum of R1 upon the addition of 10 equivalents of Cys and the time response curve was plotted as intensity (at 492 and 625 nm) versus time (min.) (Fig. 4a). The same showed that the emission intensity reached to a plateau within 1.0 minute which is quite faster than the earlier reports (Table S1, ESI). Further to explore the effect of pH on the sensing ability of the probe R1, we also checked its pH response in the absence and in the presence of the Cys. The pH graph plotted against the fluorescence intensity (Fig. 4b) showed that probe R1 can be successfully utilized as sensor for the Cys in wide pH window from 5 to 9.
image file: c6ra18093k-f4.tif
Fig. 4 (a) Reaction time profile of R1 with Cys and (b) pH study of the R1 in the absence and presence with Cys.

1H NMR and HRMS study

For the detail mechanistic aspect of the above findings, we further compared the 1H-NMR spectrum of R1 with the isolated R1-Cys adduct (Fig. 5). The overlaid 1H NMR spectrum showed that the aldehydic proton of R1 at 9.67 ppm got disappeared in R1-Cys and a new peak at 5.76 ppm was appeared, which was assigned for the methine proton of the thiazolidine ring.46–48 Other aromatic protons in R1-Cys however, got slightly up filled shifted in comparison to R1. Furthermore, to verify our proposed mechanism (Fig. S10, ESI), the reaction product of R1 with Cys was analyzed by high-resolution mass spectrometry analysis (HRMS), which displayed the formation of a R1-Cys adduct at m/z = 532.08179 (Fig. S11, ESI).
image file: c6ra18093k-f5.tif
Fig. 5 An overlay 1H NMR spectrum of R1 (below) and R1-Cys (above).

Theoretical calculations

The optical response of R1 indicated that the addition of Cys shifts the equilibrium towards the keto form. To explore the detailed possible mechanism we took help of the Density Functional Theory (DFT) with B3LYP/6-31 basis sets. The energy minimized structure of R1 and R1-Cys has been presented in Fig. S12, ESI.

In the enolic form, R1 showed a very strong hydrogen bonding (1.69 Å) between the H of hydroxyl and N of benzothiazole which suggests the excited state intramolecular proton transfer (ESIPT) requirements.49 On further comparing HOMO–LUMO gaps of R1 and R1-Cys we found that the energy difference between the HOMO–LUMO in R1-Cys (3.11 eV) was quite larger than the R1 (2.03 eV) (Fig. 6), confirming the weakening of ICT.


image file: c6ra18093k-f6.tif
Fig. 6 HOMO–LUMO energy gap between R1 and R1-Cys, showing weakening of ICT.

Sensing mechanism

The optical and theoretical studies of R1 in the absence and in the presence of Cys along with a number of other analytes clearly indicate, that in the absence of the Cys, R1 acted as strong ICT probe (with absorption maximum at 502 nm) having weak ESIPT emission at 492 nm (N*). As soon as there was nucleophilic attack of cysteine on the electrophilic carbonyl group, the ICT within the system got weakened and simultaneously the ESIPT underwent enhancement. Consequently the keto emission (T*, 625 nm) was observed in the red region. Thus simultaneously weakening of the ICT and strengthening of ESIPT enabled the selective colorimetric as well ratiometric fluorescent sensing of Cys possible (Fig. 7).
image file: c6ra18093k-f7.tif
Fig. 7 Proposed mechanism for the sensing of Cys through R1.

Cell imaging

The astonishing response of R1 towards cysteine motivated us to check its applicability in the live cell imaging. In order to perform bioimaging of Cys in HeLa cells, initially a MTT assay was carried out to determine the viability of cells. After 24 hours treatment with R1 (5 to 25 μM) this study showed that that the cell viability was about 90% when the concentration of R1 was lower than 10 μM (Fig. S13, ESI). Hence the probe R1 was found to have very low toxicity to culture cells under the experimental conditions and was further use for cell imaging study.

The fluorescence microscopic imaging of R1 (5 μM) into the HeLa cells were studied after a time lag of 24 hours. The necessary treatments were performed and images were taken in different channels (blue, green and red) to mark the ratiometric effect of R1 in the presence of cysteine in the live cells. Fig. 8, showed that R1 possesses good membrane permeability and is able to detect intracellular Cys in HeLa cells in the red channel. Therefore, in comparison to the probes emitting in the visible region R1 has high potential for biological applications.


image file: c6ra18093k-f8.tif
Fig. 8 Image of HeLa cell (a–d) bright and fluorescence image of R1; (e–h) bright and fluorescence image of R1 in presence of cysteine, in different channels.

Experimental

Instrumentation and methods

The 1H and 13C NMR spectra were recorded on JEOL AL 500 FT NMR spectrometer in DMSO-d6 while the Fourier transform infrared (FT-IR) spectra were obtained in the range of 4000–400 cm−1 using KBr pellets on a Perkin-Elmer spectrometer. Mass spectrometric analysis was carried out on a MDS Sciex API 2000 LCMS spectrometer. UV-visible spectra were obtained at room temperature (298 K) on a UV-1800 pharmaspec spectrophotometer with quartz cuvette (path length = 1 cm). The emission spectra were recorded on JY HORIBA fluorescence spectrophotometer at room temperature.

Synthesis of probe R1

R1 was synthesized by the simple condensation of BHI with benzothiazolium iodide in ethanol in the presence of small amount of base (20 μL of 0.5 M, NaOH). The reaction mixture was stirred for 8 hours, resulting into shiny dark color product which was filtered and finally washed with diethyl ether and dried in vacuum (Scheme 3). The isolated product was well characterized through various spectroscopic techniques (Fig. S14–S17, ESI). Yield; 73%: IR (cm−1): 3405, 3065, 2968, 2927, 1667, 1576, 1491, 1441, 1411, 1300, 1211, 1143; 1H NMR (500 MHz, DMSO-d6, TMS, ppm): 4.17 (3H, –CH3), 7.30–7.32 (1H, –CH–), 7.41–7.43 (1H, –CH–), 7.44–8.77 (10H, –ArH), 9.67 (1H, –CHO), 13.33 (1H, –OH); 13C NMR (125 MHz, DMSO-d6, TMS, ppm): 56.55, 109.35, 116.47–129.39, 136.28, 149.59, 152.03, 164.14, 173.5, 176.82, 189.49; HRMS: m/z calculated for C26H18NS+ [M] = 429.07260, found = 429.07301. Along with the 1H–1H COSY NMR spectrum (Fig. S18, ESI).

In the 1H–1H COSY spectrum (Fig. S18, ESI), we found that the aromatic proton H3 and the olefinic proton H5 are coupled by each other (as shown in Fig. 9). While the aromatic proton H2 showed coupling only with aromatic proton H3, but not with the olefinic protons H4 or H5. Moreover, the absence of coupling of the olefinic proton H5 with the aromatic proton H2 further justifies the formation of ortho-adduct R1 (and not the para-adduct) by the condensation reaction.


image file: c6ra18093k-f9.tif
Fig. 9 Showing 1H–1H COSY correlations of R1.

Sample preparation for UV-visible and fluorescence studies

Due to partial solubility of the probe R1 in aqueous medium (at RT) the stock solution of the probe was prepared in DMSO at 1.0 × 10⁻³ M concentration. In this study above stock solution was further diluted to 1.0 × 10⁻⁵ M and 1.0 × 10⁻⁶ M for UV-vis and fluorescence studies respectively with H2O and ACN in the ratio of 7[thin space (1/6-em)]:[thin space (1/6-em)]3 (v/v). The stock solutions (0.1 M) of the anions F, Cl, Br, I, AcO, BzO, HPO42−, H2PO4, HSO4, PF6, BF4, ClO4, HS, N3, HSO3, as their sodium salts as well as neutral analytes such as phenylalanine (Phe), glutamic acid (Glu), alanine (Ala), glycine (Gly), lysine (Lys), leucine (Leu), proline (Pro), arginine (Arg), glutamine (Gln), valine (Val), histidine (His), methionine (Met), tryptophan (Trp), tyrosine (Tyr), cysteine (Cys), homocysteine (Hcy) and glutathione (GSH) were prepared in double distilled water and diluted to desired concentration further with double distilled water when needed.

Calculation of detection limits

The detection limit was determined using the IUPAC method. The S/N ratio was calculated from the absorption/emission intensity of sensor without any analyte (measured 10 times) and the standard deviations of blank measurements were determined. The detection limit was calculated as three times the standard deviation from the blank measurement divided by the slope of calibration plot between analyte concentration and fluorescence/absorption intensity of the receptor. The detection limit is then calculated with the following equation;50
Detection limit = 3Sd1/S
where, Sd1 is the standard deviation of blank measurement and S is the slope of the calibration curve.

Theoretical calculations

Theoretical calculations were performed with the Gaussian 03 program51 based on the density functional theory (DFT) method. “Gauss View” was used for visualization of molecular orbital. Becke's three parameter hybrid functional with the Lee–Yang–Parr correlation functional (B3LYP) was employed for all the calculations.52 The 6-31G** basis set was used to treat all atoms.53

Cell viability

MTT assay was done in order to check the viability of the cells. Eight thousand cells were seeded in 96-well plate and treated with different concentration of R1 (5 to 25 μM). After 24 h of treatment, 10 μL MTT (3-(4,5-dimethylthiazol-2-yl)-2,5-diphenyltetrazolium bromide) solution (5 mg mL−1 in phosphate buffer) was added in each well. Subsequently, after 2 h of incubation at 37 °C, 100 μL DMSO was added to dissolve the formazan crystal and finally the absorbance was measured using an ELISA plate reader.

Methods for cell culture and bio-imaging

Stock solution of R1 was made in DMSO with 100 mM concentration and further diluted in Dulbecco's Modified Eagle's Medium (DMEM). The small aliquot of DMSO solution of R1 was completely soluble in water. The final concentration of DMSO was not exceeded from 0.1% during treatment of cells with compound. The fluorescent properties of R1 into the HeLa cells were studied after a time lag of 24 hours. The necessary treatments were performed and images were taken in inverted fluorescent microscope (EVOS, Invitrogen) at concentration of R1 (5 μM).

Conclusions

Thus, we successfully demonstrated a benzothiazole–benzothiazolium conjugate as a new HBT type probe (R1) which provides fine tuning of ICT and ESIPT. The systematic structural difference in R1 and already reported probe BHI, made R1 highly selective towards Cys over Hcy/GSH. Nevertheless, R1 also acted as a highly sensitive probe for the colorimetric as well as ratiometric fluorescent sensing of Cys in the red channel with a fast time response in comparison to BHI. The ratiometric fluorescent change from green to red channel provided a wider possibility for biological applicability of R1 as compared to many other previously reported probes for the same purpose based on HBT derived platform.

Acknowledgements

KKU and VK are gratefully acknowledge to CSIR, New Delhi for financial assistance [01(2709)/13/EMR-II]. UD acknowledges UGC-BSR for granting meritorious fellowship. RKM is thankful to Department of Science and Technology (DST), New Delhi, India for INSPIRE Faculty Fellowship and Re-search Grant [IFA12-CH-50].

Notes and references

  1. L. Y. Niu, Y. Z. Chen, H. R. Zheng, L. Z. Wu, C. H. Tung and Q. Z. Yang, Chem. Soc. Rev., 2015, 44, 6143–6160 RSC.
  2. Y. Zhou, Chem. Soc. Rev., 2012, 41, 52–67 RSC.
  3. W. Lin, L. Long, L. Yuan, Z. Cao, B. Chen and W. Tan, Org. Lett., 2008, 10, 5577–5580 CrossRef CAS PubMed.
  4. B. Liu, J. Wang, G. Zhang, R. Bai and Yi. Pang, ACS Appl. Mater. Interfaces, 2014, 6, 4402–4407 CAS.
  5. Y. Liu, D. Yu, S. Ding, Q. Xiao, J. Guo and G. Feng, ACS Appl. Mater. Interfaces, 2014, 6, 17543–17550 CAS.
  6. D. Brömme and S. Wilson, Role of Cysteine Cathepsins in Extracellular Proteolysis, in Extracellular Matrix Degradation; Biology of Extracellular Matrix 2, ed. W. C. Parks and R. Mecham, 2011, ch. 2,  DOI:10.1007/978-3-642-16861-1-2.
  7. C. E. Paulsen and K. S. Carroll, Chem. Rev., 2013, 113, 4633–4679 CrossRef CAS PubMed.
  8. S. A. Lee, J. J. Lee, J. W. Shin, K. S. Min and C. Kim, Dyes Pigm., 2015, 116, 131–138 CrossRef CAS.
  9. Q. Han, Z. Shi, X. Tang, L. Yang, Z. Mou, J. Li, J. Shi, C. Chen, W. Liu, H. Yang and W. Liu, Org. Biomol. Chem., 2014, 12, 5023–5030 CAS.
  10. J. A. Mc Mahn, T. J. Green, C. M. Skeaff, R. G. Knight, J. I. Mann and S. M. N. Williams, Engl. J. Med., 2006, 354, 2764–2772 CrossRef PubMed.
  11. J. Deng, Q. Lu, Y. Hou, M. Liu, H. Li, Y. Zhang and S. Yao, Anal. Chem., 2015, 87, 2195–2203 CrossRef CAS PubMed.
  12. V. Kumar, A. Kumar, U. Diwan and K. K. Upadhyay, Chem. Commun., 2012, 48, 9540–9542 RSC.
  13. T. W. Bell and N. M. Hext, Chem. Soc. Rev., 2004, 33, 589–598 CAS.
  14. V. Kumar, A. Kumar, U. Diwan, M. K. Singh and K. K. Upadhyay, Org. Biomol. Chem., 2015, 13, 8822–8826 CAS.
  15. L. M. Laglera, J. Downes, A. T. Sánchez and D. Monticelli, Anal. Chim. Acta, 2014, 836, 24–33 CrossRef CAS PubMed.
  16. F. Zhang, J. Zhu, J. J. Li and J. W. Zhao, Sens. Actuators, B, 2015, 220, 1279–1287 CrossRef CAS.
  17. U. Diwan, V. Kumar, R. K. Mishra, N. K. Rana, B. Koch, M. K. Singh and K. K. Upadhyay, Anal. Chim. Acta, 2016, 929, 39–48 CrossRef CAS PubMed.
  18. Z. Song, R. T. K. Kwok, E. Zhao, Z. He, Y. Hong, J. W. Y. Lam, B. Liu and B. Z. Tang, ACS Appl. Mater. Interfaces, 2014, 6, 17245–17254 CAS.
  19. L. Yuan, W. Lin, B. Chen and Y. Xie, Org. Lett., 2012, 14, 432–435 CrossRef CAS PubMed.
  20. S. Xue, S. Ding, Q. Zhai, H. Zhang and G. Feng, Biosens. Bioelectron., 2015, 68, 316–321 CrossRef CAS PubMed.
  21. J. Zhang, J. Wang, J. Liu, L. Ning, X. Zhu, B. Yu, X. Liu, X. Yao and H. Zhang, Anal. Chem., 2015, 87, 4856–4863 CrossRef CAS PubMed.
  22. D. Zhang, M. Zhang, Z. Liu, M. Yu, F. Li, T. Yi and C. Huang, Tetrahedron Lett., 2006, 47, 7093–7096 CrossRef CAS.
  23. F. Kong, R. Liu, R. Chu, X. Wang, K. Xu and B. Tang, Chem. Commun., 2013, 49, 9176–9178 RSC.
  24. X. F. Yang, Q. Huang, Y. Zhong, Z. Li, H. Li, M. Lowry, J. O. Escobedoc and R. M. Strongin, Chem. Sci., 2014, 5, 2177–2183 RSC.
  25. Hi. Yao and T. Funada, Chem. Commun., 2014, 50, 2748–2750 RSC.
  26. F. S. Santos, E. Ramasamy, V. Ramamurthy and F. S. Rodembusch, J. Mater. Chem. C, 2016, 4, 2820–2827 RSC.
  27. P. Majumdar and J. Zhao, J. Phys. Chem. B, 2015, 119, 2384–2394 CrossRef CAS PubMed.
  28. J. Zhao, S. Ji, Y. Chen, H. Guo and P. Yang, Phys. Chem. Chem. Phys., 2012, 14, 8803–8817 RSC.
  29. S. Barman, S. K. Mukhopadhyay, M. Gangopadhyay, S. Biswas, S. Dey and N. D. P. Singh, J. Mater. Chem. B, 2015, 3, 3490–3497 RSC.
  30. S. Park, O. H. Kwon, Y. S. Lee, D. J. Jang and S. Y. Park, J. Phys. Chem. A, 2007, 111, 9649–9653 CrossRef CAS PubMed.
  31. T. Gao, P. Xu, M. Liu, A. Bi, P. Hu, B. Ye, W. Wang and W. Zeng, Chem.–Asian J., 2015, 10, 1142–1145 CrossRef CAS PubMed.
  32. S. W. Luo, H. Jiang, K. Zhang, W. Liu, X. Tang, W. Dou, Z. Ju, Z. Li and W. Liu, J. Mater. Chem. B, 2015, 3, 3459–3464 RSC.
  33. Y. Xu, L. Xiao, S. Sun, Z. Pei, Y. Peia and Y. Pang, Chem. Commun., 2014, 50, 7514–7516 RSC.
  34. W. Sun, S. Li, R. Hu, Y. Qian, S. Wang and G. Yang, J. Phys. Chem. A, 2009, 113, 5888–5895 CrossRef CAS PubMed.
  35. S. Goswami, A. Manna, S. Paul, A. K. Das, P. K. Nandi, A. K. Maity and P. Saha, Tetrahedron Lett., 2014, 55, 490–494 CrossRef CAS.
  36. X. Yang, Y. Guo and R. M. Strongin, Angew. Chem., Int. Ed., 2011, 50, 10690–10693 CrossRef CAS PubMed.
  37. Y. Kim, M. Choi, S. Seo, S. T. Manjare, S. Jonc and D. G. Churchill, RSC Adv., 2014, 4, 64183–64186 RSC.
  38. X. F. Yang, Q. Huang, Y. Zhong, Z. Li, H. Li, M. Lowry, J. O. Escobedoc and R. M. Strongin, Chem. Sci., 2014, 5, 2177–2183 RSC.
  39. X. Zhang and J. Y. Liu, Dyes Pigm., 2016, 125, 80–88 CrossRef CAS.
  40. F. Kong, R. Liu, R. Chu, X. Wang, K. Xu and B. Tang, Chem. Commun., 2013, 49, 9176–9178 RSC.
  41. D. Maity and T. Govindaraju, Org. Biomol. Chem., 2013, 11, 2098–2104 CAS.
  42. A. Marini, A. M. Losa, A. Biancardi and B. Mennucci, J. Phys. Chem. B, 2010, 114, 17128–17135 CrossRef CAS PubMed.
  43. Z. Yuan, Q. Tang, K. Sreenath, J. T. Simmons, A. H. Younes, D. Jiang and L. Zhu, Photochem. Photobiol., 2015, 91, 586–598 CrossRef CAS PubMed.
  44. C. C. Hsieh, C. M. Jiang and P. T. Chou, Acc. Chem. Res., 2010, 43, 1364–1374 CrossRef CAS PubMed.
  45. J. Massue, G. Ulrich and R. Ziessel, Eur. J. Org. Chem., 2013, 2013, 5701–5709 CrossRef CAS.
  46. O. Rusin, N. N. S. Luce, R. A. Agbaria, J. O. Escobedo, S. Jiang, I. M. Warner, F. B. Dawan, K. Lian and R. M. Strongin, J. Am. Chem. Soc., 2004, 126, 438–439 CrossRef CAS PubMed.
  47. A. Poirel, A. D. Nicola and R. Ziessel, J. Org. Chem., 2014, 79, 11463–11472 CrossRef CAS PubMed.
  48. P. Das, A. K. Mandal, N. B. Chandar, M. Baidya, H. B. Bhatt, B. Ganguly, S. K. Ghosh and A. Das, Chem.–Eur. J., 2012, 18, 15382–15393 CrossRef CAS PubMed.
  49. S. Sahana, G. Mishra, S. Sivakumar and P. K. Bharadwaj, Dalton Trans., 2015, 44, 20139–20146 RSC.
  50. B. Zhu, C. Gao, Y. Zhao, C. Liu, Y. Li, Q. Wei, Z. Ma, B. Du and X. Zhang, Chem. Commun., 2011, 47, 8656–8658 RSC.
  51. M. J. Frisch, et al., GAUSSIAN 03, (Revision D.01), Gaussian, Inc., Wallingford, CT, 2004 Search PubMed.
  52. D. A. Becke, J. Chem. Phys., 1993, 98, 5648–5652 CrossRef.
  53. C. Lee, W. Yang and R. G. Parr, Phys. Rev. B: Condens. Matter Mater. Phys., 1988, 37, 785–789 CrossRef CAS.

Footnote

Electronic supplementary information (ESI) available: Characterization data and additional spectra. See DOI: 10.1039/c6ra18093k

This journal is © The Royal Society of Chemistry 2016
Click here to see how this site uses Cookies. View our privacy policy here.