Effect of surface treatments of jute fibers on the microstructural and mechanical responses of poly(lactic acid)/jute fiber biocomposites
Mohammad Tahir Zafar,
Saurindra Nath Maiti and
Anup Kumar Ghosh*
Centre for Polymer Science and Engineering, Indian Institute of Technology Delhi, New Delhi 110 016, India. E-mail: anupkghosh@gmail.com; Fax: +91-11-26591421; Tel: +91-11-26591424
First published on 22nd July 2016
Abstract
Poly(lactic acid) (PLA)/jute fiber (70/30 w/w) biocomposites were prepared by melt mixing PLA with untreated, NaOH treated and (NaOH + silane) treated jute fibers in a twin screw extruder. The effects of surface treatment of jute fiber were examined at the matrix–fiber interface by Fourier transform infrared spectroscopy (FT-IR) which confirmed the formation of hydrogen bonds and covalent bonds between PLA and jute fibers. Polarized light optical microscopy (PLOM) images showed improved transcrystallinity at the matrix–fiber interface while scanning electron microscopy (SEM) showed matrix covered fiber surfaces in the case of composites reinforced with surface treated jute fibers. Addition of untreated jute fibers in PLA increased the tensile strength and modulus, while composites reinforced with surface treated jute fibers exhibited higher mechanical properties. Dynamic mechanical analysis (DMA) results showed enhanced storage moduli in the case of surface treated jute fiber reinforced composites.
1. Introduction
In the last few decades natural fibers, such as jute, sisal, hemp, coir etc., have attracted substantial importance as reinforcing materials for polymer matrices.1,2 Natural fibers have exhibited large potential to be used as alternatives for glass or other synthetic fiber reinforcements.3–5 Natural fibers provide advantages of low cost, low density, and biodegradability. The main drawback associated with the natural fibers is their hydrophilic nature which creates incompatibility with hydrophobic polymer matrices.6,7 The hydrophilic nature of the natural fibers causes agglomeration. Further, natural fibers possess poor resistance to moisture which leads to inferior mechanical properties and dimensional instability in the composites.The surfaces of natural fibers are partially covered with hemicelluloses, lignin and waxy substances which prevent the hydroxyl groups present at the fiber surfaces from reacting with the polar matrices.8,9 This limits the use of natural fibers as reinforcements in polymer matrices. The effectiveness of the natural fibers as reinforcement in the polymer matrices depends upon cellulose content, moisture content, and impurities present on the fiber surface.10 Chemical treatment either of natural fibers, or polymer matrix or both are alternative ways to overcome the issues pertaining to the matrix–fiber phase adhesion. A compatible matrix–fiber interface results in better phase adhesion and hence better properties.11,12 For the surface treatment of natural fibers, various methods have been proposed such as alkali treatment,13–18 silane treatment,16,19–21 maleation,16,21 acetylation,16,22 benzoylation,16,23 and etherification.16,23 Chemical treatment of natural fibers provides rough fiber surfaces and improved wettability which in turn results in increased phase adhesion and enhanced mechanical properties in the resulting biocomposites.
Biodegradable polymers such as poly(lactic acid) (PLA), poly(caprolactone) (PCL), poly(butylene adipate terephthalate) (PBAT) and poly(hydroxyl butyrate) (PHB) have attracted the researchers because of their environment friendly attributes.24–27 These polymers degrade into the constituent elements after their intended use. Out of these biodegradable polymers, PLA is receiving commercial importance because of its excellent properties and processability. PLA can be produced from the renewable resources, such as corn starch, molasses, tapioca starch etc. and is an alternative to other conventional polymers like – polyethylene (PE), polypropylene (PP), and polystyrene (PS).28,29 It possesses competing properties such as high stiffness, biocompatibility, UV stability, thermal plasticity, clarity, and gloss with a number of commodity polymers.28,30 Similar to the polyolefins, it can be processed by injection molding, blow molding, and film processing techniques.31,32 Although, PLA has a lot of good characteristics to be used in industrial applications, it has certain drawbacks such as low impact strength, low toughness, low thermal stability and high cost which limit its use as the thermoplastic resin.33–36 Reinforcing PLA with natural fibers offers an economical and viable approach to overcome the drawbacks and helps the field to grow in the line of the production of more green materials.37,38 Natural fibers with active surface hydroxyl groups retain the ability to react with the carbonyl group of PLA by hydrogen bonding and with the terminal carboxylic group by covalent bonding (ester linkage formation) during melt mixing.39,40
In the field of technical utilization of natural fibers, the scope of jute fibers is continuously growing which is attracting researchers to focus on improving the matrix–fiber phase adhesion in jute fibers reinforced composites of PLA. Jute (Corchorus capsularis L.) is a natural fiber which is abundantly found in India and Bangladesh, and is well known for its low cost and good strength characteristics. Jute fibers contain a reasonably high proportion of stiff natural cellulose in comparison to other lignocellulosic fibers.41
From the literature review it is revealed that a number of natural fillers such as flax fibers, kenaf fibers, bamboo fiber, ramie fibers, wood flour, sisal fibers, hemp fibers, have been used as the reinforcement for the PLA matrices.34,42–49 However, very few investigations are carried out using jute fibers as the filler for PLA. Ma and Joo50 prepared jute and PLA based composites by film stacking process. Tao et al.51 fabricated the natural fiber/PLA composites using jute and ramie short fibers by two-roll mill technique. Plackett et al.52 prepared the PLA/jute fiber composites by film stacking procedure. Hu et al.53 fabricated the PLA/jute composites by film sticking hot pressed method. Khan et al.54 prepared the plain woven jute fabric reinforced PLA based composites by hot press molding method. Yang et al.55 prepared the PLA/jute fiber composites by pultrusion technology using the twisted jute yarn and PLA.
Thus, most of the studies based on PLA/jute fibers have focused on the preparation of the composites using film stacking process while very few reports are available which shows the preparation of the same by melt extrusion and injection molding techniques using the short jute fibers. Further, none of the studies reported the surface treatment of jute fibers using alkali and silane to enhance the jute–PLA interphase adhesion. Therefore, the present research work aims to explore the potential use of jute fibers as reinforcements in PLA via melt extrusion process. In this study PLA/jute fiber (70/30 w/w) biocomposites are prepared by melt compounding PLA with untreated, NaOH treated, and (NaOH + silane) treated jute fibers in a twin screw extruder followed by injection molding. The prepared composites were characterized by various techniques such as FT-IR, SEM, PLOM, DSC, mechanical and thermo mechanical characterizations to study the effect of surface treatment of jute fiber on the properties of the biocomposites.
2. Experimental
2.1 Materials
PLA 3001D, density 1.24 g cm−3, was procured from Nature works® LLC, USA and was used as received. The number average molecular weight (Mn) and weight average molecular weight (Mw) as calculated using gel permeation chromatography (GPC) were found to be 89![[thin space (1/6-em)]](https://www.rsc.org/images/entities/char_2009.gif) 141 g mol−1 and 158
141 g mol−1 and 158![[thin space (1/6-em)]](https://www.rsc.org/images/entities/char_2009.gif) 480 g mol−1 respectively. Jute fiber (Tossa TD-3) was purchased from Chandra Prakash & Co. India. 3-Aminopropyltriethoxysilane (APTS) was procured from M/s Sigma Aldrich. All other chemicals used were procured from the local suppliers and were of analytical grades.
480 g mol−1 respectively. Jute fiber (Tossa TD-3) was purchased from Chandra Prakash & Co. India. 3-Aminopropyltriethoxysilane (APTS) was procured from M/s Sigma Aldrich. All other chemicals used were procured from the local suppliers and were of analytical grades.
2.2 Surface treatment
In order to improve the phase adhesion between jute fiber and PLA matrix, jute fibers were surface treated using: (i) alkali (NaOH) and (ii) alkali followed by silane (NaOH + silane), separately. The detailed procedure of jute fiber surface treatment is described elsewhere.56The untreated, NaOH treated and (NaOH + silane) treated jute fibers were designated as JFU, JFNA and JFNASI respectively. A schematic representation of jute fibers surface after various chemical treatments are shown in Fig. 1.
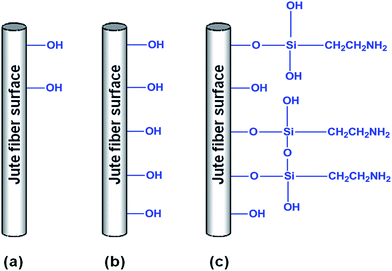 | ||
| Fig. 1 Schematic representation of jute fibers surface after various chemical treatments: (a) JFU; (b) JFNA; (c) JFNASI. | ||
2.3 Fabrication of biocomposites
Dried jute fibers of size ranging between 40 and 46 μm in diameter and 2.3–2.6 mm in length and PLA pellets were compounded in a twin screw extruder (Thermo Scientific, Prism Euro Lab 16, L/D = 40, Co-rotating type) with the predetermined temperature profile (feed zone 1-die zone 9: 60 °C, 80 °C, 100 °C, 140 °C, 170 °C, 180 °C, 190 °C, 200 °C, 200 °C). The extruded composites were pelletized and dried in a vacuum oven at 80 °C for 3 days and then injection molded in a micro injection molding machine (Thermo Scientific, HAAKE Mini Jet II) at 200 °C. PLA/jute fiber biocomposites with all three types of jute fibers viz. – JFU, JFNA and JFANSI with jute fiber content 30 wt% were compounded and injection molded. Neat PLA was also passed through the extruder and injection molded under identical conditions as stated above as a reference material. Tensile bars of ASTM D638 (type V) and impact bars of ISO 180 standard were injection molded.2.4 Characterization techniques
 | (1) |
In order to minimize the error, at least 5 samples of each composition were tested and their average values were reported.
![[thin space (1/6-em)]](https://www.rsc.org/images/entities/char_2009.gif) δ of PLA and PLA/jute fiber composites was studied by DMA using TA instruments, DMA Q800. Rectangular samples of the dimensions 3.2 × 12.5 × 40 mm3 were tested in a single-cantilever mode. Liquid nitrogen was used for cooling. Samples were heated in the temperature range of 20–100 °C at a constant heating rate of 5 °C min−1 with the frequency of 1 Hz.
δ of PLA and PLA/jute fiber composites was studied by DMA using TA instruments, DMA Q800. Rectangular samples of the dimensions 3.2 × 12.5 × 40 mm3 were tested in a single-cantilever mode. Liquid nitrogen was used for cooling. Samples were heated in the temperature range of 20–100 °C at a constant heating rate of 5 °C min−1 with the frequency of 1 Hz.3. Results and discussion
3.1 FT-IR analysis of the PLA and PLA/jute fiber biocomposites
Typical FT-IR spectra of PLA and PLA/jute fiber composites are shown in Fig. 2. The important transmittance peaks obtained for PLA are mentioned below;58–60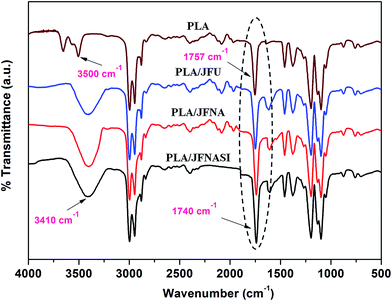 | ||
| Fig. 2 FT-IR spectra of PLA and untreated and surface treated jute fiber reinforced biocomposites of PLA. | ||
(a) The peak near 3500 cm−1 is due to the stretching vibrations of –OH groups.
(b) The strong peaks at 2996 cm−1 and 2945 cm−1 are due to the asymmetric and symmetric modes of stretching of C–H bonds respectively.
(c) The peak near 1757 cm−1 is due to the C![[double bond, length as m-dash]](https://www.rsc.org/images/entities/char_e001.gif) O stretching.
O stretching.
(d) The peak at 1459 cm−1 may be assigned as characteristic peak of –CH3 band.
(e) The peak at 1375 cm−1 is due to C–H deformation.
It is evident that in the FT-IR spectrum of jute fibers the –OH stretching peak which appears at 3425 cm−1 reported elsewhere,56 has shifted to 3410 cm−1 in PLA/jute fiber composites, towards the low wave number region. Further the C![[double bond, length as m-dash]](https://www.rsc.org/images/entities/char_e001.gif) O stretching peak which appears at 1757 cm−1 in PLA also shifted towards low wave number region at 1740 cm−1 in PLA/jute fiber composites. These observations signify the formation of hydrogen bonds between –OH groups of jute fibers and C
O stretching peak which appears at 1757 cm−1 in PLA also shifted towards low wave number region at 1740 cm−1 in PLA/jute fiber composites. These observations signify the formation of hydrogen bonds between –OH groups of jute fibers and C![[double bond, length as m-dash]](https://www.rsc.org/images/entities/char_e001.gif) O of PLA. Yew et al.39 also reported similar observations in PLA/rice starch composites.
O of PLA. Yew et al.39 also reported similar observations in PLA/rice starch composites.
Generally, the FT-IR spectra of JFNA as well as JFNASI reinforced composite of PLA are similar to that of the JFU reinforced composite of PLA. However, it was observed that the intensity of C![[double bond, length as m-dash]](https://www.rsc.org/images/entities/char_e001.gif) O stretching which appears in PLA at 1757 cm−1 increased significantly in PLA/jute fiber composites. This increase in the intensity of the C
O stretching which appears in PLA at 1757 cm−1 increased significantly in PLA/jute fiber composites. This increase in the intensity of the C![[double bond, length as m-dash]](https://www.rsc.org/images/entities/char_e001.gif) O stretching signifies the esterification reaction between –OH of jute fibers and terminal –COOH group of PLA.61 From figure it is evident that the intensity of C
O stretching signifies the esterification reaction between –OH of jute fibers and terminal –COOH group of PLA.61 From figure it is evident that the intensity of C![[double bond, length as m-dash]](https://www.rsc.org/images/entities/char_e001.gif) O stretching in various PLA/jute fiber composites increases in the order PLA/JFU < PLA/JFNA < PLA/JFNASI and the parameter depends upon the number of available reactive functionalities (–OH and –NH2) on the jute fiber surface.22
O stretching in various PLA/jute fiber composites increases in the order PLA/JFU < PLA/JFNA < PLA/JFNASI and the parameter depends upon the number of available reactive functionalities (–OH and –NH2) on the jute fiber surface.22
Depending upon the type of surface treatment of jute fibers, formation of various physical bonds (hydrogen bond) and chemical bonds (covalent bonds) between jute fiber and PLA may be explained. Cellulose, the main component present on the jute fiber surface possess a number of –OH groups. These cellulosic –OH groups react with the carbonyl (C![[double bond, length as m-dash]](https://www.rsc.org/images/entities/char_e001.gif) O) and terminal carboxylic acid (COOH) groups of PLA. Untreated jute fibers surfaces are typically covered with hemicellulose, pectin, oily and waxy substances due to which only a limited number of –OH groups from jute fiber surfaces are exposed and are able to bond with carbonyl and carboxylic groups of PLA. In case of JFNA, the number of available –OH groups increased due to the removal of impurities (hemicellulose, pectin and waxy substances) from the fiber surface. Thus, here the exposure of the cellulosic –OH groups at the fiber surface will be higher than that of JFU due to which the extent of hydrogen bonding and covalent bonding with the carbonyl and carboxylic group of PLA will be higher respectively.
O) and terminal carboxylic acid (COOH) groups of PLA. Untreated jute fibers surfaces are typically covered with hemicellulose, pectin, oily and waxy substances due to which only a limited number of –OH groups from jute fiber surfaces are exposed and are able to bond with carbonyl and carboxylic groups of PLA. In case of JFNA, the number of available –OH groups increased due to the removal of impurities (hemicellulose, pectin and waxy substances) from the fiber surface. Thus, here the exposure of the cellulosic –OH groups at the fiber surface will be higher than that of JFU due to which the extent of hydrogen bonding and covalent bonding with the carbonyl and carboxylic group of PLA will be higher respectively.
JFNASI possesses hydroxyl (–OH) and primary amine (–NH2) functional groups on their surfaces, these functional groups are expected to further enhance the interaction with the carbonyl and terminal carboxylic group of PLA by forming the hydrogen and covalent bond and hence a great degree of interaction occurs.40,62
3.2 Surface fractured morphology of the PLA/jute fiber biocomposites by SEM
The effect of surface treatment on the phase adhesion between PLA matrix and jute fibers was studied by examining the cryogenically fractured surfaces of the injection molded samples. The images of the untreated and surface treated jute fibers have been already published by the authors and can be referred for comparision.63 Fig. 3(a)–(d) show the SEM images of various samples. Fig. 3(a) presents the fractured surface of extruded PLA for comparison. Fig. 3(b) shows fractured surfaces of PLA/JFU composites containing large number of voids. Here, instances of fibers pull-out and clean fiber surfaces may easily be noticed which indicates poor phase adhesion between PLA and JFU surface.38 Fig. 3(c) shows PLA/JFNA composites' fractured surfaces where the rough surfaces of jute fibers are covered with PLA matrix. This process of covering jute fibers was found useful in stress transfer phenomena.40,64 However, a few voids and matrix–fiber gaps are also visible therein. Fig. 3(d) shows SEM images of PLA/JFNASI composites in which the jute fiber surfaces seem covered with the PLA matrix and the extent of coverage was higher than that in PLA/JFNA composites. Further, no matrix–fiber gap and voids are visible. Here, thin layers of the matrix strongly bind the fiber surface to the matrix which helps in the stress transfer process. Thus, (NaOH + silane) treatment facilitates good phase adhesion between surface treated jute fibers and PLA matrix. The matrix–fiber phase adhesion in PLA/JFNASI composites appears to be stronger than that in the PLA/JFNA and PLA/JFU composites. These results substantiate the fact that treatment of jute fibers using (NaOH + silane) improves the phase adhesion, which in turn, have positive impact on other properties as discussed in the subsequent sections.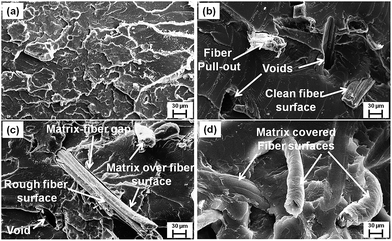 | ||
| Fig. 3 SEM images of PLA and PLA/jute fibers (70/30) biocomposites at 500×: (a) extruded PLA; (b) PLA/JFU; (c) PLA/JFNA; (d) PLA/JFNASI. | ||
3.3 Transcrystallinity at PLA/jute fiber interface
Natural fibers possess the tendency to induce crystalline growth at their surface impregnated by the semicrystalline polymeric bulk which is termed as transcrystallinity.57,65 Similar type of behavior is observed in the composites in the present work. Interestingly, the transcrystallinity phenomenon has been found to be affected considerably by the surface treatment of the jute fibers. The influence of jute fiber treatment on the transcrystallinity of PLA at the matrix–fiber interface is shown in Fig. 4(a)–(c). A discontinuous transcrystalline layer of PLA is formed on the surface of JFU, Fig. 4(a), which may be attributed to the presence of impurities on jute fiber surface which act as barriers in the crystal nucleation process.66 Fig. 4(b) and (c) show the transcrystallinity at the interface of PLA/JFNA and PLA/JFNASI respectively. The extent of transcrystallinity appears to be increased in PLA/JFNA while it was further densified in PLA/JFNASI system. The presence of this enhanced transcrystalline layer in case of surface treated jute fibers is due to the removal of impurities by NaOH treatment and enhanced branching due to the silane treatment.65 Surface topography of the cellulosic fiber has been found to play a very important role in controlling the nucleation process and crystal growth in any cellulosic fiber–polymer composite system. As a result of surface treatment of jute fiber using NaOH and (NaOH + silane), the surface properties of the same are modified and therefore, enhanced nucleation sites are generated resulting in increased transcrystallinity in comparison to the PLA/JFU composites. Huda et al.62 also reported that silane treated cellulosic fibers generated increased numbers of nucleation sites which resulted in improved transcrystalline interface region.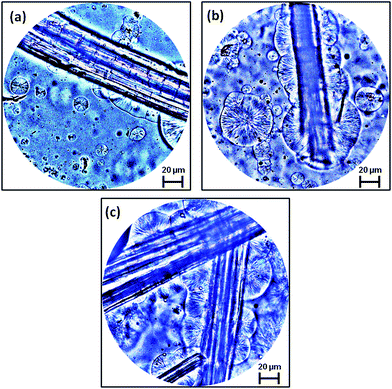 | ||
| Fig. 4 PLOM images of PLA/jute fiber biocomposites showing transcrystallinity at matrix–fiber interface, at 50×: (a) PLA/JFU; (b) PLA/JFNA; (c) PLA/JFNASI. | ||
In this experiment of transcrystallinity, samples were prepared using very few jute fibers, so that crystal initiation and growth could be clearly seen in optical microscopy. However in case of the real composite systems, the concentration of jute fibers will be considerably higher and the distance between the reinforcing fibers will be quite lesser. Therefore the transcrystallinity will be more predominant.57
While understanding the growth of transcrystallinity, the thickness of the samples also needs to be considered as a very important factor. The real composite samples are quite thicker as compared to the test specimens used for the optical microscopy. In real systems, the different layers in the composites may have different cooling rates. The layers close to the surface have cooling rates higher than those close to the core. Thus, the crystalline microstructure may vary at different layers at different depths exhibiting larger crystalline domains near to the core as compared to the surface.
3.4 Differential scanning calorimetry (DSC)
The crystallization behavior of the injection molded PLA and PLA/jute fiber composites was studied using DSC. Fig. 5(a)–(c) show the heating and cooling curves of the PLA and PLA/jute fibers composites obtained from the DSC. From the first heating curves it is observed that addition of jute fibers in PLA slightly changes the glass transition and melting temperature towards the higher end which might be because of the reinforcement provided by the jute fibers to the PLA chains. Further, as there is no cold crystallization peak visible in PLA and the composites during the first heating, this signifies the less amorphous region in the injection molded samples. From the first cooling curves, it is seen that with the addition of jute fiber in PLA, the height of melt crystallization peak increased and its peak shifted towards the higher end, indicating nucleating action of jute fibers and ease of crystallization. During the second heating, with the addition of jute fiber, again the slight change in glass transition temperature was observed. Similarly, the melting temperature also slightly changed with the addition of jute fiber and cold crystallization peak disappeared which might be due to less available amorphous region of PLA in the PLA/jute fiber composites, which were already crystallized during the cooling process.67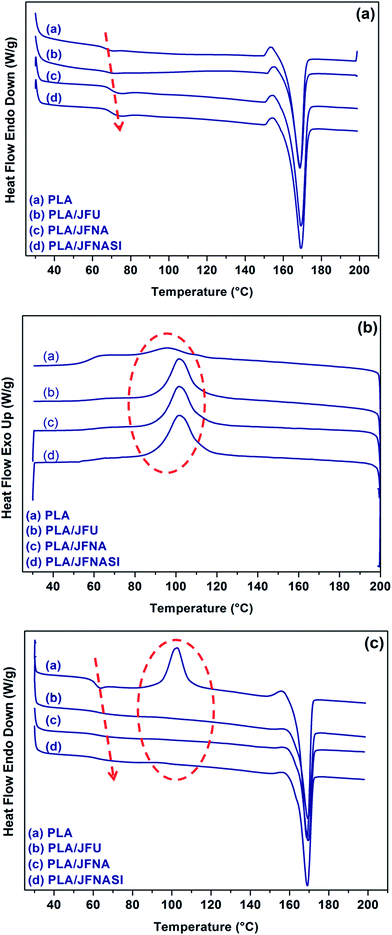 | ||
| Fig. 5 DSC curves of PLA and PLA/jute fiber (70/30) biocomposites: (a) first heating; (b) first cooling; (c) second heating. | ||
The crystallinity (%) of PLA and that in PLA/jute fiber composites during the first and second heating cycle were calculated using eqn (1) and are shown in Table 1. The values of crystallinities (%) obtained from the first heating were found higher than those from second heating due to the difference in the cooling rates during the injection molding operation and DSC experiments. As a consequence the values of Tg were also found slightly higher in the first heating. Further, the crystallinity (%) of the composites increased in the order PLA < PLA/JFU < PLA/JFNA < PLA/JFNASI. In case of PLA/JFU, JFU, induced crystallization of PLA by providing a surface and thus elevate the crystallinity. In case of PLA/JFNA the surface treatment of jute fibers using NaOH caused the removal of impurities and increase in surface functionality of the jute fiber causing enhance surface affinity with PLA which further increases the crystallinity. In case of PLA/JFNASI the silane treatment played an important role in surface wetting of jute fibers by PLA which leads to further improvement in crystallinity (%). Similar observations were reported earlier.67 Huda et al.62 reported that surface treatment of the natural fibers using silane increases the nucleation density and enhances the crystallinity (%) of the PLA in the composites.
| Sample code | First heating | First cooling | Second heating | ||||||
|---|---|---|---|---|---|---|---|---|---|
| Tg [°C] | Tcc [°C] | Tm [°C] | Xc [%] | Tmc [°C] | Tg [°C] | Tcc [°C] | Tm [°C] | Xc [%] | |
| PLA | 67.1 | — | 168.4 | 44.6 | 95.8 | 61.2 | 102.8 | 168.8 | 21.8 |
| PLA/JFU | 67.8 | — | 168.8 | 50.5 | 100.6 | 62.2 | — | 169.2 | 43.0 |
| PLA/JFNA | 69.2 | — | 169.2 | 54.1 | 102.2 | 62.5 | — | 169.5 | 45.8 |
| PLA/JFNASI | 69.8 | — | 169.4 | 57.2 | 103.3 | 62.8 | — | 169.6 | 52.2 |
3.5 Tensile properties
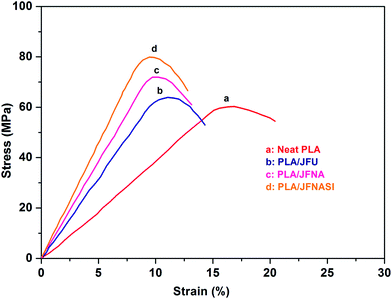
The stress–strain curves of PLA and PLA/jute fiber composites are shown in Fig. 6. PLA/jute fiber composites exhibit higher strength and stiffness than those of neat PLA. Elongation-at-break of the composites decreased as compared to that of neat PLA which indicates that addition of jute fibers in PLA increases its brittleness.The tensile modulus and strength of the PLA and PLA/jute fiber (70/30) composites are shown in Fig. 7(a) and (b) respectively, while elongation-at-break is shown in Fig. 7(c). It is observed that surface treatment of jute fibers using only aqueous NaOH solution was not enough to improve the strength and modulus of the composites. Further treatment with (NaOH + silane) clearly improves the mechanical properties of the composites.
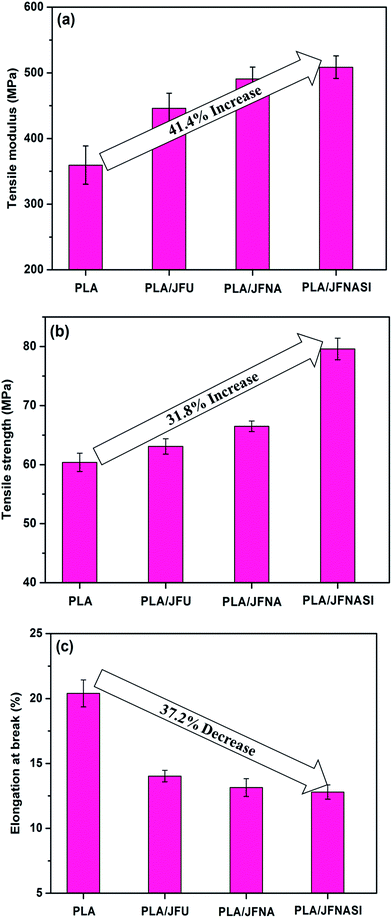 | ||
| Fig. 7 Tensile properties of PLA and PLA/jute fiber (70/30) biocomposites: (a) tensile modulus; (b) tensile strength; (c) elongation-at-break. | ||
Incorporation of JFU significantly improved the tensile modulus and strength of the composites as compared to those of neat PLA. Surface treated jute fibers (JFNA and JFNASI) also showed significant improvement in the tensile modulus and strength of the composites. The improved phase adhesion between the jute fibers and PLA may be responsible for improved tensile properties of the composites.68
Addition of JFU in PLA improved the tensile modulus of PLA by 24.1%. PLA/JFNA composites show 36.5% improvement in the tensile modulus over that of the neat PLA and 10% improvement in the tensile modulus in comparison to the PLA/JFU composites. Similarly, PLA/JFNASI composites show 41.4% improvement in the tensile modulus than that of the neat PLA and 14% improvement in tensile modulus in comparison to that of the PLA/JFU composites. Thus reinforcement of PLA using JFNASI leads to higher tensile modulus in comparison to PLA/JFU and PLA/JFNA composites. Sreekala et al.69 reported that in the composites with silane treated cellulose fibers, crystal nucleation density was higher than that in the composites with untreated fiber. Higher nucleation density resulted in smaller crystals which provide transcrystalline interface region with improved bonding between the matrix and the fiber.
Tensile strength of the composites shows increasing trend than that of the neat PLA matrix. Addition of JFU in neat PLA improves the tensile strength of the PLA/JFU composites by 4.5% in comparison to that of the neat PLA. PLA/JFNA composites show 10% improvement in tensile strength than neat PLA and 5.3% improvement in tensile strength in comparison to that of the PLA/JFU composites. Similarly, PLA/JFNASI composites show 31.8% improvement in tensile strength than that of neat PLA and 26.1% improvement in tensile strength in comparison to that of the PLA/JFU composites. This improvement in the tensile strength of the PLA/JFU composites may be attributed to the reinforcement provided by jute fibers. Further the improvements in the tensile strengths of the PLA/JFNA and PLA/JFNASI composites in comparison to that of the PLA/JFU composites are attributed to the effect of surface treatment of jute fibers by NaOH and (NaOH + silane) respectively.
Fig. 7(c) shows the effect of fiber addition and fiber surface treatment over elongation-at-break of PLA/jute fiber (70/30) composites. It is evident that addition of JFU in PLA matrix significantly decreased the elongation-at-break in comparison to that of the neat PLA matrix. Addition of JFNA and JFNASI in PLA matrix further decreased the elongation-at-break in comparison to that of the PLA/JFU composites. Previous studies have shown that cellulosic fibers are brittle in nature.3,70,71 Addition of 30 wt% jute fibers in PLA matrix will increase the brittleness of the PLA/JFU composites, which in turn is expected to decrease the elongation-at-break of the PLA/JFU composites than that of the neat PLA.
In the case of PLA/JFNA and PLA/JFNASI composites, jute fibers have better phase adhesion with PLA matrix (as indicated from the SEM images, Fig. 3) and thus provide stronger reinforcement than in the PLA/JFU composites. It can be assumed that brittle nature of the composites due to the addition of surface treated jute fiber will be significantly higher, which will eventually lead to lower elongation-at-break of the PLA/JFNA and PLA/JFNASI composites than that of the PLA/JFU composites.
The observed trend of tensile properties in PLA/jute fiber biocomposites may be interpreted with the help of Fig. 8 in which various interfaces between PLA and jute fibers (untreated and differently surface treated) are shown schematically. Here formation of hydrogen bonds and covalent bonds are illustrated to represent the chemistry taking place at the interfaces. The interface formed in PLA/JFU is sharp and weak while in PLA/JFNA and PLA/JFANSI strong interfaces are visible. Weak interface results poor mechanical properties while strong interfaces are responsible for improved mechanical properties.68
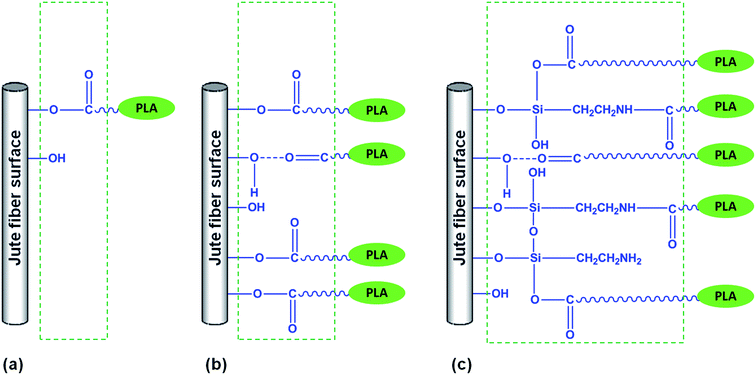 | ||
| Fig. 8 Schematic representation of the PLA/jute fiber biocomposites interface: (a) PLA/JFU; (b) PLA/JFNA; (c) PLA/JFNASI. | ||
3.6 Impact strength
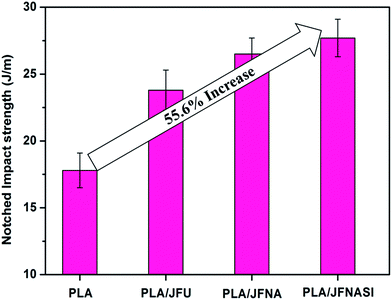
The notched Izod impact strength of the PLA and PLA/jute fiber composites are shown in Fig. 9. Impact strength of all the composites increased due to the fiber addition and surface treatment of the jute fiber. PLA/JFNASI composites show the highest impact strength than those of the JFU and JFNA reinforced composites. Addition of JFU in PLA matrix improves the impact strength of PLA by 33.7%. PLA/JFNA composites show 48.9% improvement in the impact strength in comparison to that of the neat PLA and 11.34% improvement in the impact strength than that of PLA/JFU composites. Similarly, PLA/JFNASI composites show 55.6% improvement in impact strength than that of the neat PLA and 16.4% improvement in the impact strength in comparison to that of the PLA/JFU composites. Improvements in the impact strength of PLA/JFNA composite and PLA/JFNASI composites in comparison to that of the PLA/JFU composites may be due to the effect of surface treatment, other than 30 wt% addition of jute fibers. The improved notched impact strength of the PLA/JFU composites is due to the higher energy absorption due to the reinforcement provided by the jute fibers. This is because the adhered jute fibers aid the stress transfer during the impact loading of the samples. Moreover, due to the higher length of the fibers the crack propagation is inhibited after an initial crack initiation. Also transcrystallinity leads to smaller spherullites along the fiber length and the spherullites are joined by tie molecules which make the spherullite boundaries stress bearing. The enhanced impact properties of the JFNA and JFNASI reinforced composites in comparison to that of the JFU reinforced composites are because of the improved matrix–fiber phase adhesion. Similar observations pertaining to natural fiber induced improvement in impact strength have been reported earlier.40,62 Further, as it is confirmed (Section 3.3 and 3.4) that formation of transcrystalline layer at matrix–fiber interface and improvement in the crystallinity (%) is higher in case of JFNA and JFNASI reinforced composites, compared to those in the JFU reinforced composites. This may be another reason of the improved impact strength of the JFNA and JFNASI reinforced composites. Similar observations were also reported earlier.72,733.7 Dynamic mechanical analysis (DMA)
Dynamic mechanical analysis was used to investigate the effect of elevated temperature on the stiffness of PLA and PLA/jute fiber composites. The storage modulus and the loss factor (tan![[thin space (1/6-em)]](https://www.rsc.org/images/entities/char_2009.gif) δ) of PLA and PLA/jute fiber composites as a function of temperature are shown in Fig. 10(a) and (b). Addition of JFU increased the storage modulus of PLA which may be due to the reinforcement imparted by the jute fibers.30,74 Further enhancement in the storage modulus of PLA/JFNA and PLA/JFNASI is due to the surface treatment of the jute fiber. Surface treatment improves the surface roughness and wettablity of the fiber due to which matrix–fiber phase adhesion increases and stress transfer between the matrix and the fiber becomes efficient. The storage modulus of PLA and the composites decrease with increase in the temperature, the parameters significantly decrease at the temperature range of 60–70 °C which is the glass transition region of PLA. The softening temperatures of the PLA/JFNA and PLA/JFNASI composites are higher than those of the PLA and PLA/JFU composites which may be due to the effect of surface treatment of jute fibers.
δ) of PLA and PLA/jute fiber composites as a function of temperature are shown in Fig. 10(a) and (b). Addition of JFU increased the storage modulus of PLA which may be due to the reinforcement imparted by the jute fibers.30,74 Further enhancement in the storage modulus of PLA/JFNA and PLA/JFNASI is due to the surface treatment of the jute fiber. Surface treatment improves the surface roughness and wettablity of the fiber due to which matrix–fiber phase adhesion increases and stress transfer between the matrix and the fiber becomes efficient. The storage modulus of PLA and the composites decrease with increase in the temperature, the parameters significantly decrease at the temperature range of 60–70 °C which is the glass transition region of PLA. The softening temperatures of the PLA/JFNA and PLA/JFNASI composites are higher than those of the PLA and PLA/JFU composites which may be due to the effect of surface treatment of jute fibers.
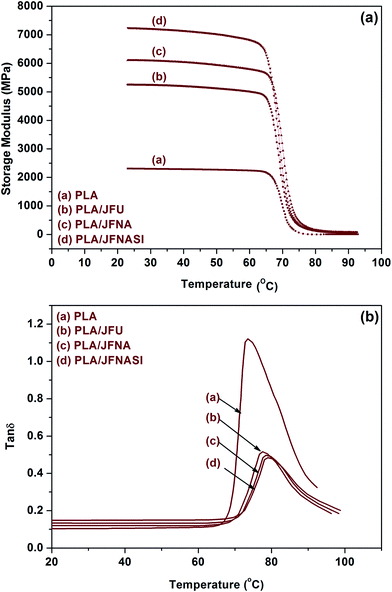 | ||
| Fig. 10 Thermo mechanical properties of PLA and PLA/jute fiber (70/30) biocomposites: (a) storage modulus; (b) loss factor. | ||
Addition of jute fibers in PLA reduces the tan![[thin space (1/6-em)]](https://www.rsc.org/images/entities/char_2009.gif) δ peak height which suggests increase in the elastic nature of the composites. The peak of the tan
δ peak height which suggests increase in the elastic nature of the composites. The peak of the tan![[thin space (1/6-em)]](https://www.rsc.org/images/entities/char_2009.gif) δ curve represents the glass transition temperature.75 Addition of JFU in PLA shifts the tan
δ curve represents the glass transition temperature.75 Addition of JFU in PLA shifts the tan![[thin space (1/6-em)]](https://www.rsc.org/images/entities/char_2009.gif) δ peak towards higher temperature region which indicated JFU induced restriction in the mobility of segments of PLA and thus increases the glass transition temperature. Further in case of JFNA and JFNASI reinforced composites, tan
δ peak towards higher temperature region which indicated JFU induced restriction in the mobility of segments of PLA and thus increases the glass transition temperature. Further in case of JFNA and JFNASI reinforced composites, tan![[thin space (1/6-em)]](https://www.rsc.org/images/entities/char_2009.gif) δ peak again shifts towards higher temperature region, which indicates that surface treatment increases the phase adhesion between the matrix and the fiber and restricts the segmental movement of the former. Similar observations were reported earlier.62
δ peak again shifts towards higher temperature region, which indicates that surface treatment increases the phase adhesion between the matrix and the fiber and restricts the segmental movement of the former. Similar observations were reported earlier.62
4. Conclusions
The biocomposites with improved mechanical and thermo mechanical properties were successfully prepared by melt compounding PLA with jute fibers. Surface treatment of jute fiber using NaOH removed the impurities from the fiber surface making the surface rough which helped in mechanical interlocking with the matrix. However, surface treatment using (NaOH + silane) enhanced the surface functionalities of the jute fiber which improves further phase adhesion between jute fiber and PLA matrix as observed by the SEM images. FT-IR results confirmed the formation of various physical and chemical bonding between PLA and jute fibers and the increase in intensity of the characteristic peaks with the extent of surface treatment. Mechanical and thermo mechanical properties of the composites with surface treated jute fiber were higher than those of the PLA/untreated jute fiber composites and neat PLA. Further, (NaOH + silane) treated jute fiber reinforced composites showed significantly higher properties than those reinforced with only NaOH treated jute fibers. This might be due to the higher extent of phase adhesion leading to sustained reinforcement by the (NaOH + silane) surface treated jute fiber. Thus, PLA/JFNASI composites exhibited higher tensile strength and modulus, higher impact strength, higher storage modulus, improved transcrystallinity and thus enhanced crystallinity (%) followed by those exhibited by PLA/JFNA and PLA/JFU composites.Acknowledgements
Council of Scientific and Industrial Research (CSIR), New Delhi, India (File No. 09/086(0913)/2008-EMR-I) and Ministry of Human Resource Development (MHRD), Government of India, are acknowledged for providing the senior research fellowship (SRF) to Mr Mohammad Tahir Zafar for carried out this research work.References
- G. Mehta, A. Mohanty, M. Misra and L. Drzal, Green Chem., 2004, 6, 254–258 RSC.
- K. Thakur, S. Kalia, B. S. Kaith, D. Pathania and A. Kumar, RSC Adv., 2015, 5, 76844–76851 RSC.
- A. K. Bledzki and J. Gassan, Prog. Polym. Sci., 1999, 24, 221–274 CrossRef CAS.
- S. V. Joshi, L. Drzal, A. Mohanty and S. Arora, Composites, Part A, 2004, 35, 371–376 CrossRef.
- J. Holbery and D. Houston, JOM, 2006, 58, 80–86 CrossRef CAS.
- D. Dai and M. Fan, RSC Adv., 2013, 3, 4659–4665 RSC.
- J. Gassan and A. K. Bledzki, J. Appl. Polym. Sci., 2001, 82, 1417–1422 CrossRef CAS.
- J. Gassan and A. K. Bledzki, J. Appl. Polym. Sci., 1999, 71, 623–629 CrossRef CAS.
- D. Ray, B. Sarkar, A. Rana and N. Bose, Bull. Mater. Sci., 2001, 24, 129–135 CrossRef CAS.
- A. Mohanty, M. A. Khan, S. Sahoo and G. Hinrichsen, J. Mater. Sci., 2000, 35, 2589–2595 CrossRef CAS.
- A. Karmaker and J. Youngquist, J. Appl. Polym. Sci., 1996, 62, 1147–1151 CrossRef CAS.
- A. Rana, B. Mitra and A. Banerjee, J. Appl. Polym. Sci., 1999, 71, 531–539 CrossRef CAS.
- D. Ray, B. K. Sarkar, R. K. Basak and A. K. Rana, J. Appl. Polym. Sci., 2002, 85, 2594–2599 CrossRef CAS.
- L. Y. Mwaikambo and M. P. Ansell, J. Appl. Polym. Sci., 2002, 84, 2222–2234 CrossRef CAS.
- A. E. Oudiani, Y. Chaabouni, S. Msahli and F. Sakli, Carbohydr. Polym., 2011, 86, 1221–1229 CrossRef.
- X. Li, L. Tabil and S. Panigrahi, J. Polym. Environ., 2007, 15, 25–33 CrossRef.
- D. Ray and B. K. Sarkar, J. Appl. Polym. Sci., 2001, 80, 1013–1020 CrossRef CAS.
- E. Sinha and S. Rout, Bull. Mater. Sci., 2009, 32, 65–76 CrossRef CAS.
- G. C. D. X. Y. Liu, eXPRESS Polym. Lett., 2007, 1, 299–307 CrossRef.
- N. Sgriccia, M. C. Hawley and M. Misra, Composites, Part A, 2008, 39, 1632–1637 CrossRef.
- M. A. Sawpan, K. L. Pickering and A. Fernyhough, Composites, Part A, 2011, 42, 888–895 CrossRef.
- M. A. Sawpan, K. L. Pickering and A. Fernyhough, Composites, Part A, 2011, 42, 1189–1196 CrossRef.
- S. Kalia, B. S. Kaith and I. Kaur, Polym. Eng. Sci., 2009, 49, 1253–1272 CAS.
- A. P. Mathew, K. Oksman and M. Sain, J. Appl. Polym. Sci., 2005, 97, 2014–2025 CrossRef CAS.
- E. Lezak, Z. Kulinski, R. Masirek, E. Piorkowska, M. Pracella and K. Gadzinowska, Macromol. Biosci., 2008, 8, 1190–1200 CrossRef CAS PubMed.
- D. W. Grijpma and A. J. Pennings, Macromol. Chem. Phys., 1994, 195, 1633–1647 CrossRef CAS.
- B. K. Goriparthi, K. Suman and M. R. Nalluri, Polym. Compos., 2012, 33, 237–244 CrossRef CAS.
- S. S. Ray, K. Yamada, M. Okamoto and K. Ueda, Polymer, 2003, 44, 857–866 CrossRef.
- T. M. Wu and M. F. Chiang, Polym. Eng. Sci., 2005, 45, 1615–1621 CAS.
- M. S. Huda, L. T. Drzal, M. Misra and A. K. Mohanty, J. Appl. Polym. Sci., 2006, 102, 4856–4869 CrossRef CAS.
- L. T. Lim, R. Auras and M. Rubino, Prog. Polym. Sci., 2008, 33, 820–852 CrossRef CAS.
- K. Madhavan Nampoothiri, N. R. Nair and R. P. John, Bioresour. Technol., 2010, 101, 8493–8501 CrossRef CAS PubMed.
- S. Ghosh and S. Krishnan, Indian J. Fiber Textil. Res., March 2007, 32, 119–121 Search PubMed.
- R. Masirek, Z. Kulinski, D. Chionna, E. Piorkowska and M. Pracella, J. Appl. Polym. Sci., 2007, 105, 255–268 CrossRef CAS.
- D. Garlotta, J. Polym. Environ., 2001, 9, 63–84 CrossRef CAS.
- R. M. Rasal, A. V. Janorkar and D. E. Hirt, Prog. Polym. Sci., 2010, 35, 338–356 CrossRef CAS.
- R. L. Quirino, T. F. Garrison and M. R. Kessler, Green Chem., 2014, 16, 1700–1715 RSC.
- M. T. Zafar, N. Zarrinbakhsh, A. K. Mohanty, M. Misra, S. N. Maiti and A. K. Ghosh, eXPRESS Polym. Lett., 2015, 10, 176–186 CrossRef.
- G. H. Yew, A. M. Mohd Yusof, Z. A. Mohd Ishak and U. S. Ishiaku, Polym. Degrad. Stab., 2005, 90, 488–500 CrossRef CAS.
- M. S. Huda, L. T. Drzal, A. K. Mohanty and M. Misra, Compos. Interfaces, 2008, 15, 169–191 CrossRef CAS.
- F. Corrales, F. Vilaseca, M. Llop, J. Gironès, J. A. Méndez and P. Mutjè, J. Hazard. Mater., 2007, 144, 730–735 CrossRef CAS PubMed.
- B. Bax and J. Müssig, Compos. Sci. Technol., 2008, 68, 1601–1607 CrossRef CAS.
- T. Bayerl, M. Geith, A. A. Somashekar and D. Bhattacharyya, Int. Biodeterior. Biodegrad., 2014, 96, 18–25 CrossRef.
- S. Ochi, Mech. Mater., 2008, 40, 446–452 CrossRef.
- H. Takagi, S. Kako, K. Kusano and A. Ousaka, Adv. Compos. Mater., 2007, 16, 377–384 CrossRef CAS.
- T. Yu, J. Ren, S. Li, H. Yuan and Y. Li, Composites, Part A, 2010, 41, 499–505 CrossRef.
- Y. Wang, R. Qi, C. Xiong and M. Huang, Iran. Polym. J., 2011, 20, 281–294 CAS.
- H. Zou, L. Wang, H. Gan and C. Yi, Polym. Compos., 2012, 33, 1659–1666 CrossRef CAS.
- M. Sawpan, K. Pickering and A. Fernyhough, Adv. Mater. Res., 2007, 29, 337–340 CrossRef.
- H. Ma and C. W. Joo, J. Compos. Mater., 2011, 45, 1451–1460 CrossRef CAS.
- Y. Tao, Y. Li and J. Ren, Trans. Nonferrous Met. Soc. China, 2009, 19(3), s651–s655 Search PubMed.
- D. Plackett, T. Løgstrup Andersen, W. Batsberg Pedersen and L. Nielsen, Compos. Sci. Technol., 2003, 63, 1287–1296 CrossRef CAS.
- R.-H. Hu, M.-Y. Sun and J.-K. Lim, Mater. Des., 2010, 31, 3167–3173 CrossRef CAS.
- G. M. A. Khan, M. Terano, M. A. Gafur and M. S. Alam, J. King Saud Univ., Eng. Sci., 2016, 28, 69–74 CrossRef.
- Y. Yang, M. Murakami and H. Hamada, J. Polym. Environ., 2012, 20, 1124–1133 CrossRef CAS.
- M. T. Zafar, S. N. Maiti and A. K. Ghosh, Fibers Polym., 2016, 17, 266–274 CrossRef CAS.
- A. P. Mathew, K. Oksman and M. Sain, J. Appl. Polym. Sci., 2006, 101, 300–310 CrossRef CAS.
- R. Auras, B. Harte and S. Selke, Macromol. Biosci., 2004, 4, 835–864 CrossRef CAS PubMed.
- J. Guan and M. A. Hanna, Bioresour. Technol., 2006, 97, 1716–1726 CrossRef CAS PubMed.
- G. Kister, G. Cassanas and M. Vert, Polymer, 1998, 39, 267–273 CrossRef CAS.
- T. Semba, K. Kitagawa, U. S. Ishiaku and H. Hamada, J. Appl. Polym. Sci., 2006, 101, 1816–1825 CrossRef CAS.
- M. S. Huda, L. T. Drzal, A. K. Mohanty and M. Misra, Compos. Sci. Technol., 2008, 68, 424–432 CrossRef CAS.
- M. T. Zafar, S. N. Maiti and A. K. Ghosh, Fibers Polym., 2016, 17, 266–274 CrossRef CAS.
- W. Ding, T. Kuboki, A. Wong, C. B. Park and M. Sain, RSC Adv., 2015, 5, 91544–91557 RSC.
- N. E. Zafeiropoulos, C. A. Baillie and F. L. Matthews, Composites, Part A, 2001, 32, 525–543 CrossRef.
- M. Zhou, J. Yan, Y. Li, C. Geng, C. He, K. Wang and Q. Fu, RSC Adv., 2013, 3, 26418–26426 RSC.
- S. Pilla, S. Gong, E. O'Neill, R. M. Rowell and A. M. Krzysik, Polym. Eng. Sci., 2008, 48, 578–587 CAS.
- P. Sari, P. Spatenka, Z. Jenikova, Y. Grohens and S. Thomas, RSC Adv., 2015, 5, 97536–97546 RSC.
- M. Sreekala, M. Kumaran and S. Thomas, J. Appl. Polym. Sci., 1997, 66, 821–835 CrossRef CAS.
- F. Ahmad, H. S. Choi and M. K. Park, Macromol. Mater. Eng., 2015, 300, 10–24 CrossRef CAS.
- O. Faruk, A. K. Bledzki, H.-P. Fink and M. Sain, Prog. Polym. Sci., 2012, 37, 1552–1596 CrossRef CAS.
- G. Perego, G. D. Cella and C. Bastioli, J. Appl. Polym. Sci., 1996, 59, 37–43 CrossRef CAS.
- S. D. Park, M. Todo, K. Arakawa and M. Koganemaru, Polymer, 2006, 47, 1357–1363 CrossRef CAS.
- P. Hedenberg and P. Gatenholm, J. Appl. Polym. Sci., 1995, 56, 641–651 CrossRef CAS.
- Q. Zhang, L. Shi, J. Nie, H. Wang and D. Yang, J. Appl. Polym. Sci., 2012, 125, E526–E533 CrossRef CAS.
| This journal is © The Royal Society of Chemistry 2016 |

