Haichang Dingab,
Chunhong Zhengb,
Baoqiang Li*a,
Gang Liub,
Shouzhi Pu*b,
Dechang Jiaa and
Yu Zhoua
aInstitute for Advanced Ceramics, State Key Laboratory of Urban Water Resource and Environment, Harbin Institute of Technology, Harbin 150001, PR China. E-mail: libq@hit.edu.cn
bJiangxi Key Laboratory of Organic Chemistry, Jiangxi Science and Technology Normal University, Nanchang, Jiangxi 330013, PR China. E-mail: pushouzhi@tsinghua.org.cn; Fax: +86-791-83831996; Tel: +86-791-83831996
First published on 10th August 2016
The recognition and sensing of ions have attracted growing attention because of the important role played by ions in biological, industrial and environmental processes. However, many sensors can only detect a single ion. We report here a rhodamine-based sensor with functions of dual ion detection. It displays a quick colorimetric and fluorometric sensing ability on 1:
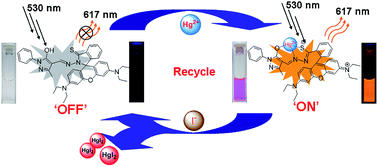
1 binding to Hg2+, with a change of color of solution (colorless to pink) and fluorescence color (dark to orange) due to Hg2+-induced opening of the spirolactam ring in the rhodamine structure. The detection limits were found to be 32 nM and 44 nM by absorption and fluorescence methods, respectively. More importantly, the resulting complex 1–Hg2+ can be used as a reversible fluorescence sensor for I−. With the addition of I−, the fluorescence intensity was quenched because Hg2+ in the complex was grabbed by I− attributed to the stronger binding force between Hg2+ and I−. Based on the “OFF–ON–OFF” behavior, a molecular device with “INHIBIT” logic gate function was constructed.
The fluorescence approach is simple, sensitive, and rapid for the detection of Hg2+ in biological, toxicological and other environments.7 To date, several fluorescence methods using organic fluorophores8–11 and nanoparticles12–15 as prototype tools have been developed for simple and rapid detection of Hg2+. Additionally, many kinds of fluorescence chemosensors also have been frequently used to detect Hg2+.16–19 These small molecule-based sensors were developed by covalently attaching binding sites with different signaling moieties like phenothiazine,20 BODIPY,21 quinoline,22 coumarin,23 rhodamine,24 etc. Among all these, rhodamine appears to be one of the ideal structures due to its excellent photophysical properties, such as large molar extinction coefficient, long excitation and emission wavelengths and high fluorescence quantum yields.25 The sensing principle is generally based on the reversible molecular structural change between the spirocycle (non-fluorescent) and the open-ring isomers (strongly fluorescent).26 Many rhodamine-based chemosensors have been developed for metal ions such as Al3+,27 Cu2+,28 Fe3+,29 Cr3+,30 and Zn2+.31
Meanwhile, anions also have an important influence in many biological, chemical, and environmental processes.32 I−, a trace essential element in human beings, is one of the most closely linked to the human body, an abnormal level of which causes various diseases. For example, its deficiency in the human body causes diseases such as goiter, hypothyroidism and cretinism; however, its excess may lead to disorders in thyroid functioning and autoimmune diseases.33–35 Therefore, the determination of I− has important significance. To solve this problem, optical-based sensors have been developed using small molecules for the sensing of I−. Recently, a few fluorescence sensors for I− have been prepared based on metal coordination compounds, such as Cu2+,36 Ag+,37 and Hg2+, which work due to the stronger binding force between metal ions and I− than between metal ions and sensors.38,39 Hg2+ complexes can be disrupted by the formation of HgI2, which has an extremely low solubility constant (Ksp = 3.2 × 10⁻²⁹),40 meaning that Hg2+ complexes have potential use to detect I− via fluorescence response.
Based on all of the above, we designed and synthesized a rhodamine-based fluorescence chemosensor (1). In order to achieve the specific recognition of Hg2+, the “O” in amide bond was replaced by “S” of the rhodamine structure due to the high affinity between Hg and S atoms.41,42 It displayed a fluorescent and colorimetric response toward Hg2+ with high selectivity and sensitivity and no interference from competing metal ions. However, the sequential addition of I− can quench the Hg2+-induced strong fluorescence, and the resultant Hg2+ complex of this chemosensor shows no change in the presence of other anions for I− detection.
NMR spectra were recorded with a Bruker AV400 (400 MHz) spectrometer with CDCl3 as the solvent and tetramethylsilane (TMS) as an internal standard. UV-visible spectra were measured with an Agilent 8453 UV/vis spectrophotometer. Fluorescence spectra were recorded with a Hitachi F-4600 fluorescence spectrophotometer. The fluorescence quantum yield was measured with an Absolute PL Quantum Yield Spectrometer QY C11347-11. Infrared (IR) spectra were collected with a Bruker Vertex-70 spectrometer. Elemental analysis was carried out with a PE CHN 2400 analyzer. Melting points were measured using a WRS-1B melting point apparatus.
The UV-visible and fluorescence studies of 1 were performed using a 2 mL CH3CN–H2O (1/1, v/v, 2 × 10⁻⁵ mol L−1) solution with appropriate amounts of metal ions. Solutions were shaken for about 10 min before measuring the absorption and fluorescence intensity in order to allow the metal ions to chelate sufficiently with the sensors.
Rhodamine B thiohydrazide (5, 0.24 g, 0.50 mmol) and 1-phenyl-3-methyl-4-formylpyrazolone-5 (3, 0.20 g, 1.00 mmol) were dissolved in 5 mL of ethanol. Then, after refluxing for 48 h, the orange powder was collected by filtration and washed with hot ethanol three times. Yield: 42%. Mp: 368–370 K. 1H NMR (400 MHz, CDCl3): δ (ppm) 8.56 (s, 1H), 8.02–8.08 (m, 1H), 7.49 (d, J = 8 Hz, 2H), 7.41 (t, J = 8 Hz, 2H), 7.33–7.36 (m, 3H), 7.03–7.09 (m, 1H), 6.72 (d, J = 8 Hz, 2H), 6.25 (s, 3H), 6.23 (s, 1H), 3.23–3.28 (m, 8H), 2.47 (s, 3H), 1.08 (t, J = 8 Hz, 12H). 13C NMR (100 MHz, CDCl3) 154.54, 150.81, 149.80, 149.57, 136.74, 134.10, 131.09, 129.34, 128.26, 128.14, 128.03, 127.37, 126.76, 126.13, 124.17, 123.88, 121.19, 113.00, 109.58, 107.18, 96.43, 61.85, 43.33, 14.17, 11.63 (Fig. S1†). ESI-MS (m/z): 675.2 [M + H2O + H+]+ (Fig. S2†). Anal. calcd for C39H40N6O2S: C, 71.31; H, 6.14; N, 12.79%. Found: C, 71.22; H, 6.21; N, 12.73%. IR (KBr, ν, cm−1): 1217, 1510, 1612, 3425.
Fig. 2A shows the UV-visible absorption spectra of 1 upon the addition of the various metal ions. When 10 eq. of these metal ions were added to the CH3CN–H2O (1/1, v/v, 2 × 10⁻⁵ mol L−1) solutions of 1, the results show that Cu2+ and Hg2+ can induce an absorption spectra change. When Cu2+ and Hg2+ were added, a strong absorption peak appeared at 562 nm and 558 nm, respectively, which are characteristic of rhodamine B in its opening state. Although Cu2+ could induce an obvious change, the change was weaker than that of Hg2+. Fig. 2B shows the fluorescence spectra of 1 upon the addition of the various ions. 1 showed no fluorescence upon excitation at 530 nm. Only Hg2+ can induce an emission peak to appear and cause 268-fold enhancement in the fluorescence intensity at 617 nm because of the formation of the open-ring amide form of rhodamine B. Cu2+ also induced an increase in the fluorescence intensity, with an emission peak at 614 nm, but this effect can be neglected due to the fluorescence intensity being far weaker than that induced by Hg2+. Hence, the different fluorescence intensity changes make it possible for 1 to discriminate between Hg2+ and Cu2+.
Fluorescence competition experiments were also conducted for sensor 1. When 5 eq. of Hg2+ was added into a solution of 1 in the presence of 10 eq. other ions, similar fluorescence spectral change was displayed to that with Hg2+ ion only; the addition of these metal ions did not result in significant fluorescence intensity changes (Fig. 3), indicating the binding ability of Hg2+ with compound 1 is higher than that of other metal ions. The presence of other metal ions does not interfere with the Hg2+ detection, making 1 very useful in practical applications.
Fig. 4A shows the absorption response in aqueous solution. Upon the gradual addition of Hg2+, the intensity of the absorption band at 558 nm was found to increase. As a consequence, the solution color changed from colorless to pink upon addition of Hg2+, due to the structure change of rhodamine B from spirocycle (colorless) to the open-ring state (pink). This is consistent with the undoubted conversion of free 1 to the 1–Hg2+ complex. By plotting the changes of 1 in terms of the absorbance at 558 nm as a function of Hg2+ concentration, a curve has been obtained and is shown in the inset of Fig. 4A. The curve was divided into two parts before reaching the titration plateau. The peak at 558 nm slowly increased with the addition of Hg2+ before 0.3 eq. When the proportion of mercury ions was ≥0.3 eq., the absorbance at 558 nm rapidly increased. Finally, the absorbance at 558 nm reached plateau when 0.7 eq. of Hg2+ was added. There is a good linearity between the concentration of Hg2+ and the absorbance in the range of 6–14 µM, indicating that 1 can quantitatively detect Hg2+ at the relevant concentration. The linear equation is found to be y = 0.1639x − 0.9165 (R = 0.997) (Fig. S3†). The limit of detection of Hg2+ was determined by the 3σ method and found to be 32 nM (Fig. S4†).
The fluorescence titration profile of 1 with Hg2+ is shown in Fig. 4B. Free 1 showed very weak fluorescence signal in the range of 540–800 nm. Upon gradual addition of Hg2+ to the solution of 1, a significant enhancement in fluorescence intensity at 617 nm was observed following excitation at 530 nm which gradually increased with Hg2+ concentration. With a handheld UV lamp (at an excitation of 365 nm), the fluorescence color significant changed from dark to orange. In accord with UV-visible titration spectra, the emission peak at 617 nm slowly increased with the addition of Hg2+ before 0.3 eq. When the proportion of mercury ions was 0.3–0.7 eq., the reaction continued and the emission intensity at 617 nm rapidly increased. Fig. S5† also shows that there is a good linearity between the concentration of Hg2+ and the fluorescence intensity in the range of 5–12 µM, indicating that sensor 1 can quantitatively detect Hg2+ at the relevant concentration. The linear equation is found to be y = 301.46x − 1376.68 (R = 0.992) (Fig. S5†). Meanwhile, the absolute fluorescence quantum yield of 1–Hg2+ complex peaked at 0.34 from 0.05. The limit of detection of Hg2+ was determined by the 3σ method and found to be as low as 44 nM (Fig. S6†).
In order to understand the binding stoichiometry of 1–Hg2+ complexe, Job's plot experiments were carried out. In Fig. 5A, the emission intensity at 617 nm is plotted as a function of the mole fraction of 1 under a constant total concentration. Maximum emission intensity was reached when the mole fraction was 0.5. These results indicate a 1:
1 ratio for 1–Hg2+ complexe, in which one Hg2+ ion was bound with one 1 unit. Further, the formation of 1–Hg2+ complex was confirmed using ESI-MS in which the peak at m/z 911.1 ([1 + H2O + Hg2+ + Cl−]+) indicates a 1
:
1 stoichiometry for 1–Hg2+ complexes (Fig. 5B).
To study the performance of the 1–Hg2+ complex in anion sensing, the fluorescence changes of the complex in the presence of a number of anions were systematically examined. Fig. 6 shows the changes in the fluorescence emissions of the complex 1–Hg2+ solution upon the addition of a series of anions (10 eq. of F−, Cl−, Br−, NO3−, SCN−, CN−, HSO4−, CO32−, HCO32−, SO42−, H2PO4−, SO32−, ClO4− and CH3COO−). As expected, among these anions (Fig. 6A), only I− caused a significant decrease in fluorescence. This indicates that the selectivity of the 1–Hg2+ complex for I− is high compared with its selectivity for other anions.
A competition experiment was subsequently carried out by adding I− to a 1–Hg2+ solution containing other anions, and the results are shown in Fig. 6B. Before the introduction of I−, there was almost no fluorescence change at 617 nm in the presence of other anions (10 eq.). When 5 eq. of I− were introduced to the above mentioned solutions, a remarkable quenching in the fluorescence emission intensity at 617 nm was observed. This clearly demonstrated any anions considered in the study did not interfere with the detection of I−.
The 1–Hg2+ complex shows high specificity for I−. Thus, we further investigated the sensitivity of the 1–Hg2+ complex to I−. A fluorescence titration experiment was performed to determine the interaction between I− and the 1–Hg2+ complex. Fig. 7 shows that the fluorescence intensities gradually decreased as the I− concentration was increased, and a highly linear relationship between the fluorescence decrease and the I− concentration was obtained when the concentration of I− varied from 32 to 72 µM (Fig. S7†). Thus, those results prove the analytical platform based on 1–Hg2+ complex for I− detection is practicable and sufficiently accurate.
Footnote |
† Electronic supplementary information (ESI) available. See DOI: 10.1039/c6ra17861h |
This journal is © The Royal Society of Chemistry 2016 |