Green method to fabricate porous microspheres for ultrasensitive SERS detection using UV light

Fei Wanga, Yang Qiua, Bing-Jie Wanga, Hua-Lin Wang*a and Yi-Tao Longb
aState Key Laboratory of Chemical Engineering, East China University of Science and Technology, Shanghai, 200237, P. R. China. E-mail: wanghl@ecust.edu.cn
bState Key Laboratory of Bioreactor Engineering, Department of Chemistry, East China University of Science and Technology, Shanghai 200237, China

Received 13th July 2016 , Accepted 11th October 2016

First published on 12th October 2016


Abstract

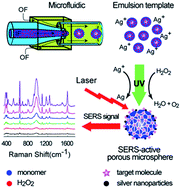
A green method was developed to fabricate a novel porous polymer microsphere with SERS activity, which can be used for ultrasensitive detection because of its preconcentration function. Ultraviolet irradiation as “green” reduction was successfully achieved through several complex processes, namely, monomer solidification, hydrogen peroxide photolysis, and silver nanoparticle fabrication, in only one step. During the solidification process, H2O and O2, which are originally from H2O2 reduction, escaped from the emulsion templates, resulting in various interconnected micro-/nano-channels. The mean pore size of the prepared porous microspheres was 4 μm, and the specific surface area can reach 31 m2 g−1. The silver nanoparticles produced in the reduction process of silver nitrate were deposited on the porous surface of the microsphere and contributed to stable SERS activity with a SERS enhancement factor of up to 3.8 × 10⁶ and a low detection limit of 10−13 M level for rhodamine 6G. This green method provides highly sensitive and uniform SERS substrates and ensures the stability and reliability of our “SERS substrate”.

Introduction

Surface Enhanced Raman Spectroscopy (SERS) has evolved as a sensitive and selective technology for biomedicine, pollutant monitoring, and material characterization, even down to the limit of single-molecule detection, since the first observation by Fleischmann in 1974.1–4 The critical factor that influences SERS detection is the performance characteristics of the SERS-active substrate. The “hot spots” formed in the gap region between two or multiple nanoparticles of the SERS substrate can provide a remarkable enhancement factor.5,6 Currently, various methods, such as metal colloid, electrochemically roughened electrodes, metal island films, self-assembled metal colloid films, and laser-ablated silver plate, have been developed in the fabrication of SERS substrates.7–11 Although metal colloid has strong SERS enhancement, the major intrinsic drawback, namely, the introduction of additional reaction reagents, and undesired by-products cannot be ignored.12 Meanwhile, substrates prepared through laser ablation have strong stability and repeatability and are free of organic or ionic species compared with conventional chemical procedures; however, this method has disadvantages, including noble metal waste and high management cost.13

With the improvement of testing standards, most of these methods cannot meet the requirements for trace detection. The major problem is that no efficient mechanism exists to bring the target molecules to the SERS hot spots, which are regions of strongly localized electromagnetic near-field that are required for the SERS effect.14 In the past several decades, various methods have been developed to preconcentrate and drive the target molecules to the hot spot. For example, Cho,15 Park,16 and Li17 used the electrokinetic effect and electrochemistry to preconcentrate analytes. Choi18 achieved the accumulation of adsorbed molecules on SERS-active sites by repeating a “filling-drying” cycle of the assay solution on the optofluidic CD platform. Wang19 demonstrated the benefits of the coffee-ring effect in the construction of SERS substrates and preconcentration of analytes through the evaporation of an aqueous droplet containing both silver nanoparticles (AgNPs) and analytes. In all these studies, however, high management cost and tedious operation were required.

In recent years, porous polymer microspheres20–22 have been widely utilized for the preconcentration or extraction of contaminants in wastewater. Trace levels of contaminants in wastewater were enriched on the surface of porous polymer microspheres through solid-phase extraction. Meanwhile, ultraviolet irradiation as “green” reduction has been successfully applied for polymer microspheres23–25 and silver nanoparticle fabrication.26,27

In this work, which is inspired by previous studies, a novel porous polymer microsphere with SERS activity as the “SERS substrate” was successfully prepared using UV light. The polymer microsphere can meet trace detection requirements because of its preconcentration function. High inner phase emulsion (HIPE) was prepared via high-speed stirring. A capillary microfluidic device was then applied to shear the HIPE primary emulsion into multiple emulsion templates for the porous structure. Facile UV irradiation allowed us to address three issues simultaneously: monomer polymerization, the reaction of H2O2 wrapped in the emulsion templates, and reduction of Ag+ surrounding the emulsion templates. Then, we demonstrated a preconcentration porous polymer microsphere that is effective in improving the sensitivity of detection in trace levels of concentrations.

Experimental section

Reagents

2-Hydroxy-2-methylpropiophenone (HMPP), pluronic F-127, glycerin, peroxide (50 wt%), hydrogen polyglycerol polyricinoleate (PGPR 90), TX-100, and absolute ethyl alcohol were purchased from Sigma-Aldrich (St. Louis, MO, USA). 1,6-Bis (acryloyloxy) hexane (HDODA) was purchased from TCI (JAPAN). Silver nitrate (99%), rhodamine 6G (R6G), aniline, and methylene blue (MB) were obtained from Danisco, (Denmark). All solutions were prepared with 18 MΩ cm deionized water from a Mili-Q System (Billerica, MA, USA). All other reagents were of analytical grade and purchased from Aladdin-Reagent Co., Ltd. (Shanghai, China).

Instruments

Multiple emulsion templates were obtained with a high-speed emulsification homogenizer (C10, HENC Co. Ltd., Shanghai), syringe pumps (Longer Pump, LSP01-2A, China), and an inverted optical microscope with a CCD camera (Go-5, Qimaging). Polymerization of the monomer and reduction of Ag+ and H2O2 were achieved with UV light irradiated by a UV lamp (400 W, 260 nm, Guyou Co. Ltd., Shenzhen). Detailed characterization of the porous structure was performed with a field-emission scanning electron microscope (SEM; NOVA NanoSEM450, FEI Inc., USA). Surficial deposited Ag NPs were observed with the above SEM with an additional back scattering lens. The porosity of the microsphere substrates was acquired with an automated surface area and pore size analyzer (ASAP 3020, Micromeritics Inc. USA). Raman spectra were recorded with a small portable Raman spectrometer (BWS415, B&W Tek Inc., USA) with an excitation wavelength of 785 nm, a resolution of 5 cm−1, and a beam diameter of 10 μm.

Emulsion templating

HIPE, a composite emulsion system, was utilized to prepare porous microspheres. The inner phase (IP) comprised polymerizable monomers, a pore-forming agent, a surfactant, and a photoinitiator. Additionally, a high-speed stirrer was utilized to emulsify a mixture of oil and water into a composite W/O emulsion. The outer phase (OP) was mainly composed of deionized water added with a viscosity modifier and a surfactant. An extra acceptation phase containing a certain amount of OP solution and a fixed concentration of dissolved silver nitrate was prepared in advance in a Petri dish for emulsion templating. The composition of the solution in each phase is shown in Table S1. Afterward, each phase was pumped respectively into a one-stage capillary microfluidic device,28 where the emulsion templates were synthesized.

Emulsion solidification and nanosilver preparation

As-prepared emulsion templates were collected and solidified by employing the off-chip solidification method. Photopolymerization among these templates occurred under a UV lamp with continuous irradiation of 20 min. As a result, H2O and O2 were released via photolysis at the cost of the consumption of H2O2. Notably, a large portion of pores emerged; these pores were generated originally from H2O2 and H2O interconnected with numeral channels because of the escape of O2. Simultaneously, Ag+ surrounding the templates was reduced by the UV lamp. Hence, silver nanoparticles were deposited on the porous microsphere surface. After solidification, the microspheres were purged with ethanol and deionized water three times alternately and allowed to evaporate to dryness in an oven at a low temperature (30 °C). SERS-active porous microspheres were thus obtained (representative photographs of microspheres were shown in Fig. S1).

SERS detection

The pore sizes and porosities of microspheres can be easily adjusted by simply varying the operating parameters, such as stirring velocity and time, the volume ratio of oil to water, and concentration of H2O2 in IP. By regulating the UV intensity and irradiation time, the as-prepared porous microspheres were endowed with different SERS activities. After on-chip fabrication and off-chip solidification, the microspheres were soaked in the preconfigured solution added with a certain concentration of target molecules (R6G, methylene blue, and aniline). When adsorption equilibrium was reached, the microspheres were removed and dried at a fixed low temperature. The Raman spectra of the target molecules on the microsphere surface were collected with a portable Raman spectrometer to investigate the SERS activity of the microspheres prepared under different conditions.

Results and discussions

The preparation of porous microspheres using a UV lamp and their application in ultrasensitive SERS detection are illustrated in Fig. 1. HIPE, which includes polymerizable monomers and the H2O2 solution, was prepared through high-speed stirring. A self-made capillary microfluidic device was then applied to shear the HIPE primary emulsion into multiple emulsion templates for the porous structure. Notably, monomer polymerization, the reaction of H2O2 wrapped in the emulsion templates, and reduction of Ag+ surrounding the emulsion templates completed at the same time by UV light. H2O and O2 produced in the reduction of H2O2 simultaneously escaped from the emulsion templates during emulsion solidification and formed interconnected micro-/nano-channels. Silver nanoparticles abounded on the porous microsphere surface during the reduction of Ag+. Thus, SERS-active porous microspheres, which can be utilized as a substrate for ultrasensitive trace detection, were obtained.
image file: c6ra17820k-f1.tif
Fig. 1 Schematic of the preparation of porous microspheres using a UV lamp and their application in ultrasensitive SERS detection.

Effects of stirring parameters on emulsification

For the HIPE system selected for the preparation of porous microspheres, the emulsification degree directly determines the pore size distribution and porosity of porous microspheres. Thus, we confirmed the optimal operating parameters by investigating the effects of stirring time and velocity on emulsion size. The specific stirring parameters are indicated in Table S2, and a photograph of the emulsion under different stirring conditions from Table S2 is shown in Fig. S2. The stirring parameters were selected as A1 (stirring speed of 1600 rpm and stirring time of 1 min).

Effects of varying O/W ratio on pore morphology

The O/W ratio as another vital factor determines the stability of emulsion templates, the pore morphology of porous microspheres after solidification, and the limit of SERS detection. The pore morphology of the internal porous microspheres prepared at different oil–water ratios (2[thin space (1/6-em)]:[thin space (1/6-em)]1, 1[thin space (1/6-em)]:[thin space (1/6-em)]1, 1[thin space (1/6-em)]:[thin space (1/6-em)]2, 1[thin space (1/6-em)]:[thin space (1/6-em)]3, and 1[thin space (1/6-em)]:[thin space (1/6-em)]4) is shown in Fig. 2. When the O/W ratio was 2[thin space (1/6-em)]:[thin space (1/6-em)]1 (Fig. 2A), the prepared SERS-active porous microspheres exhibited minimal pores with poor pore connectivity. A rational explanation for this observation is that at this O/W ratio (about 33%), the emulsion template belongs to the category of a water-in-oil emulsion. Furthermore, oil-phase droplets were spherically distributed and unconnected to one another, and the monomers occupied a large space. Hence, after UV solidification of the polymerizable monomers, the microspheres exhibited scattered and almost totally isolated pores. As the O/W ratio decreased, an increasing number of pores appeared in the microspheres connected with increasing tiny channels. When the O/W ratio was 1[thin space (1/6-em)]:[thin space (1/6-em)]3 (Fig. 2D), the microspheres showed a “spongy” morphology with uniform and interconnected pores. The pore morphology at a volume ratio of 1[thin space (1/6-em)]:[thin space (1/6-em)]2 (Fig. 2C) was similar to that at a ratio of 1[thin space (1/6-em)]:[thin space (1/6-em)]4 (Fig. 2E), but was not as uniform as that at a ratio of 1[thin space (1/6-em)]:[thin space (1/6-em)]3. The corresponding pore size at a ratio of 1[thin space (1/6-em)]:[thin space (1/6-em)]3 was slightly larger than that at a ratio of 1[thin space (1/6-em)]:[thin space (1/6-em)]2 probably because when the O/W ratio was 1[thin space (1/6-em)]:[thin space (1/6-em)]2, the emulsion templates were HIPE, in which the water-phase volume fraction reached 67%, and the water phase occupied most of the entire space of microspheres. However, as shown in Fig. 2C, a small portion of the oil phase in the bottom-left corner was not fully occupied or separated by the water phase. After solidification, a large piece of “solid” skeleton appeared. When the O/W ratio was 1[thin space (1/6-em)]:[thin space (1/6-em)]4 (Fig. 2E), the water-phase droplets were tightly stacked, and the wrapped continuous phase (monomer) surrounding the water phase in the emulsion was film-like. However, in the process from the generation of emulsion templates to the next-step solidification, the collision rates significantly increased and resulted in the partial collapse of the “solid” skeleton. Thus, the pore size of the prepared SERS-active porous microspheres was larger than that when the O/W ratio was 1[thin space (1/6-em)]:[thin space (1/6-em)]3.
image file: c6ra17820k-f2.tif
Fig. 2 SEM spectra of porous morphology at different O/W ratios. (A–E) 2[thin space (1/6-em)]:[thin space (1/6-em)]1, 1[thin space (1/6-em)]:[thin space (1/6-em)]1, 1[thin space (1/6-em)]:[thin space (1/6-em)]2, 1[thin space (1/6-em)]:[thin space (1/6-em)]3, and 1[thin space (1/6-em)]:[thin space (1/6-em)]4, and (F) represents the “skin” phenomenon of porous microsphere prepared from pure H2O2.

As shown in Fig. 2F, the as-prepared microspheres presented shell–core structures. In detail, the porous core was surrounded by a smooth, airtight, non-uniform shell, which is also called “skin”. Thus, channels inside the particles cannot extend to the surface, thereby a closed pore structure was generated. The presence of the protective layer influences the mass transfer inside and outside the porous microspheres and subsequently affects the limit for SERS detection. Bea29 provided a reasonable explanation for this phenomenon; during the H2O2 reduction procedure, O2 escapes from the inside of microspheres and results in an obvious increase in OP concentration on the surface and velocity of polymerization. However, Kim30 utilized NH4HCO3 as a pore-forming agent and obtained opened porous microspheres with interconnected micropores, which are also beneficial according to the same pore-forming theory, that is, pore-forming agent reduction and product-gas escape. Herein, opened porous microspheres were prepared by simply adjusting the initial concentration of H2O2, which directly affected the volume of gas and gas escape time.

Effects of concentrations of H2O2 on pore morphology

Previous studies have extensively investigated the reduction of H2O2 under a UV lamp. Hunt et al.31,32 divided the decomposition reaction of an H2O2 solution under a UV lamp into four steps. Firstly, under a UV lamp, H2O2 is decomposed into two ˙OH after absorbing photons. Secondly, ˙OH reacts with H2O2. Then, HO2˙/O2 and water is produced. Finally, HO2˙ reacts with H2O2 to produce hydrated oxygen ions. Excess HO2˙ in the reaction process directly produces H2O2 and O2.

UV absorption/initial stage:

 
H2O2 + → 2OH˙ (1)

Decomposition process:

 
OH˙ + H2O2/HO2 → HO2˙/O2 + H2O (2)
 
HO2˙ + H2O2 → ˙OH + H2O + O2 (3)

End of the reaction:

 
HO2˙ + HO2˙ → H2O2 + O2 (4)

Wang et al.33 found that the decomposition reaction rate of H2O2 under a UV lamp increases with an increasing concentration of H2O2. According to previous studies, when the O/W ratio is 1[thin space (1/6-em)]:[thin space (1/6-em)]3, six types of porous microspheres are created by different concentrations of H2O2 in IP (10%, 20%, 40%, 50%, 60%, and 80%). The SEM spectra of the surface porous morphology of microspheres are shown in Fig. 3.


image file: c6ra17820k-f3.tif
Fig. 3 SEM spectra of micro-holes on the surface of microsphere at different mass concentrations of H2O2. (A–F) 10%, 20%, 40%, 50%, 60%, and 80%, respectively.

As shown in Fig. 3B, the surface porous morphology of the microspheres was similar to the internal porous morphology, but had more interconnected pores on the “spongy” surface. In the UV solidification process of polymerizable monomers with a appropriate concentration of H2O2 (20%), the photolysis rate of H2O2 was equal to the polymerization rate of the monomer. The two procedures, the formation of the porous structures and polymerization of the monomers, occurred at the same time and resulted in well-opened porous geometry. When the concentration of H2O2 decreased from 20% to 10%, the relative microspheres exhibited a larger skeleton thickness and fewer pores per unit surface area. As the concentration of H2O2 increased from 40% to 80%, the number of microsphere surface pores decreased, and the hole-to-hole skeleton became increasingly compact. This can be attributed to the condition that in the UV solidification process of polymerizable monomers with a low concentration of H2O2 (10%), the photolysis rate was lower than the polymerization rate of the oil-phase monomer film wrapped on the surface of the water phase. In this case, less O2 produced by the reduction of H2O2 could break through the surface and further form porous structures. However, the remaining H2O2 inside led to a porous core with a small size. The surface pores of the microspheres (Fig. 3C–F) decreased because of the increase in H2O2 concentration and the reaction rate. The H2O and O2 already released by the H2O2 reduction before the polymerization and solidification of the monomer film of the water phase wrapped on the surface. Meanwhile, the original space in H2O2, was occupied by the monomer solution and became a compact skeleton structure after polymerization. When the concentration of H2O2 was further increased, the porous structures exhibited fewer pores and even no pores on the surface (referred to as the “skin” phenomenon above and is shown in Fig. 2F).

Effects of UV light parameters on SERS activity

SERS is a phenomenon that occurs when the signal from the coarse surface of a precious metal at the nanoscale is enhanced by 106 to 1014, at which the Raman signal of the analyte molecules may be amplified abnormally on the appropriate nanoparticle surface of the precious metal. In this study, silver nitrate was reduced under a UV lamp to achieve in situ deposition of silver nanoparticle clusters26 on the porous surface without reducing agents or excessive by-products. During the reduction of Ag+ under a UV lamp, reduction speed was closely related to UV intensity. The irradiation time directly determined the number and size of silver nanoparticles and further affected the SERS activity of the microsphere surface. Therefore, the effects of the intensity of the UV lamp and irradiation time on SERS activity on the porous microsphere surface were explored. The relationships between UV intensity and lamp-template distance were shown in Fig. S3.

The SERS spectra of 10−7 M R6G were collected on the surface of porous microspheres under different UV intensities and irradiation times. Fig. 4 show that with increasing UV irradiation time, the SERS intensity of the characteristic peak at 1508 cm−1 sharply increased at first and then flattened out upon reaching the maximum after irradiation of 60 min. This phenomenon was due to the fact that the diameters of silver nanoparticles decreased as the irradiation time under a UV lamp increased. As-prepared silver nanoparticles as the “silver core” continued to grow with the increase in irradiation time. When the irradiation time reached 60 min, the silver nanoparticles were closely distributed on the microsphere surface, and the particle size was around 80 nm (Fig. S4). In this regard, the “hot spot” between silver nanoparticles enhanced the coupling and resonance effect among the plasmas themselves. As a result, optimal SERS activity was achieved. However, excessive irradiation under a UV lamp cannot further enhance SERS activity because of the extreme growth of silver nanoparticles.


image file: c6ra17820k-f4.tif
Fig. 4 SERS spectra of 10−7 M R6G collected under different UV intensities and irradiation times: (A) 10 min, (B) 20 min, (C) 40 min, (D) 60 min, (E) 80 min, and (F) 100 min. Each data point represents the average value of three SERS spectra, and the error bars show the standard deviations.

SERS activity of the porous microspheres

The qualities of SERS-active microspheres play an important role in SERS detection. SERS activity can be estimated by calculating the SERS enhancement factor (EF) as follows:34 EF = (ISERS/Nsurf)/(Ibulk/Nbulk), where Ibulk and ISERS represent the Raman peak intensity and SERS peak intensity of the solid sample of the target molecules, respectively. Nbulk and Nsurf represent the amount of laser-irradiated molecules on the solid sample of the target molecules and a number of target molecules within the laser irradiation area of the SERS-active porous microsphere surface, respectively. In this study, to detect the target molecules with selected R6G, the porous microspheres were soaked in R6G (5.0 × 10⁻⁸ M) solution and removed after sufficient adsorption. The mean surface density of R6G was 1.96 × 10⁻²¹ mol μm−2. The laser spot diameter was approximately 10 μm until the fluid on the microsphere surface naturally evaporated at room temperature and calculated with Nsurf = 1.96 × 10⁻²¹ mol μm−2 × π × 25 μm2 = 1.54 × 10⁻¹⁹ mol. The sample volume of the solid sample of R6G was determined by the penetration depth of the focused laser beam and the laser spot area on the porous microsphere surface. The penetration depth of the laser beam was approximately 2 μm, and the calculated spot area on the porous microsphere surface was approximately 78.54 μm2. Given that the solid sample density of R6G was 0.79 g cm−3, Nbulk = 0.79 g cm−3 × π × 25 μm2 × 2 μm/(479.01 g mol−1) = 2.59 × 10⁻¹³ mol. The vibration characteristic peak intensity of R6G at 1508 cm−1 was selected to calculate EF. The calculated value of ISERS/Nsurf was 2.2 (Fig. S5) and that of EF was approximately 3.8 × 10⁶. The result shows that the SERS activity of the porous microspheres prepared by this process is comparable with that prepared by any other advanced process.35

Repeatability and stability of the SERS-active porous microspheres

Aside from activity, the reproducibility of SERS spectra is important for the use of SERS as a routine analytical tool. To verify if the nanosilver clusters on the porous microsphere surface are able to provide reproducible SERS signals, the reproducibility of the SERS signals collected from the porous microsphere surfaces was evaluated. Fig. 5A shows the SERS spectra of 5.0 × 10⁻⁷ M R6G molecules from 15 random samples of porous microsphere surfaces. The main Raman bands of R6G that appeared at 1508 cm−1, which is assigned to the aromatic C–C stretching modes, was enhanced at each porous microsphere surface. To obtain a statistically meaningful result, different spectra of the variations in the intensity of the characteristic peak at 1508 cm−1 were quantified and are presented in Fig. 5B. The blue dotted line indicates the mean value line of the results from the 15 samples. Among the 15 data points, 8 lie within a 5% variation range, and others are within 5% to 10%. This result reveals the high reproducibility of the porous microsphere surfaces with SERS activity.
image file: c6ra17820k-f5.tif
Fig. 5 (A) Reproducibility of microsphere SERS. SERS spectra were collected from 15 randomly; (B) intensity distribution of the 1508 cm−1 peak in the 15 spectra. The blue line indicates the average intensity of 15 spectra.

Limit of detection of the SERS-active porous microspheres

Three types of target molecules (R6G, methylene blue, and aniline) with different concentrations were prepared to estimate the limit of detection of the SERS-active porous microspheres prepared under the optimal conditions mentioned above (the concentration of H2O2 in IP is 20% and the irradiation time is 60 min). A portable Raman spectrometer was utilized to collect the Raman spectra of the target molecules on the microsphere surface. As shown in Fig. 6, the SERS spectra of the three types of target molecules on the porous microsphere surface were obtained under optimal conditions. As the concentrations increased, the signal enhancements increased. Meanwhile, the typical intensity of the characteristic peak of each target molecule was measured. A linear correlation between SERS intensities and logarithmic concentration was observed within the concentration range 1.0 × 10⁻¹³ M to 1.0 × 10⁻⁸ M for R6G (608 and 1058 cm−1), 1.0 × 10⁻¹⁰ M to 1.0 × 10⁻⁵ M for methylene blue (500 and 1396 cm−1), and 1.0 × 10⁻⁹ M to 1.0 × 10⁻⁴ M for aniline (525 and 796 cm−1). Each fitting curve exhibited an explicit linear relationship, and the correlation coefficients for the three target molecules were 0.9926, 0.9735, and 0.9851. As shown in Fig. 6B, D and F, with the porous microspheres serving as the SERS substrate, the limits for the detection of R6G, methylene blue, and aniline were 1.0 × 10⁻¹³ M, 1.0 × 10⁻¹⁰ M, and 1.0 × 10⁻⁹ M, respectively. These results demonstrate the superior SERS activity and stability of the porous microsphere surface.
image file: c6ra17820k-f6.tif
Fig. 6 (A) SERS spectra of R6G obtained on the surface of microsphere: (a) 1.0 × 10⁻¹³ M, (b) 1.0 × 10⁻¹² M, (c) 1.0 × 10⁻¹¹ M, (d) 1.0 × 10⁻¹⁰ M, (e) 1.0 × 10⁻⁹ M, and (f) 1.0 × 10⁻⁸ M. (C) SERS spectra of methylene blue obtained on the surface of microsphere: (a) 1.0 × 10⁻¹⁰ M, (b) 1.0 × 10⁻⁹ M, (c) 1.0 × 10⁻⁸ M, (d) 1.0 × 10⁻⁷ M, (e) 1.0 × 10⁻⁶ M, and (f) 1.0 × 10⁻⁵ M. (E) SERS spectra of aniline obtained on the surface of a microsphere: (a) 1.0 × 10⁻⁹ M, (b) 1.0 × 10⁻⁸ M, (c) 1.0 × 10⁻⁷ M, (d) 1.0 × 10⁻⁶ M, (e) 1.0 × 10⁻⁵ M, and (f) 1.0 × 10⁻⁴ M. Plots of intensity vs. logarithmic concentration: (B) R6G at 608 and 1508 cm−1, (D) methylene blue at 500 and 1396 cm−1, and (F) aniline at 525 and 796 cm−1. Each data point represents the average value of three SERS spectra. The error bars show the standard deviations.

Conclusions

In this study, a green method was developed to fabricate a novel porous polymer microsphere with SERS activity that can be used for ultrasensitive detection because of its preconcentration function. UV irradiation as “green” reduction was successfully achieved through several complex processes, namely, monomer solidification, hydrogen peroxide photolysis, and silver nanoparticle fabrication, in only one step. The mean pore size of the prepared SERS-active porous microspheres was 4 μm, and the specific surface area reached 31 m2 g−1. The porous microsphere as the “SERS substrate” possessed a SERS enhancement factor of up to 3.8 × 10⁶ and a detection limit of 10−13 M level for rhodamine 6G. The high EF of the synthesized porous microsphere can be useful for ultrasensitive Raman detection in the field of biotechnology and environmental science.

Acknowledgements

This research was supported by the sponsorship of National Science Foundation for Distinguished Young Scholars of China (Grant No. 51125032).

Notes and references

  1. J. Kneipp, H. Kneipp and K. Kneipp, Chem. Soc. Rev., 2008, 37, 1052–1060 RSC.
  2. D. W. Li, L. L. Qu, W. L. Zhai, J. Q. Xue, J. S. Fossey and Y. T. Long, Environ. Sci. Technol., 2011, 45, 4046–4052 CrossRef CAS PubMed.
  3. R. A. Alvarez-Puebla and L. M. Liz-Marzán, Chem. Soc. Rev., 2012, 41, 43–51 RSC.
  4. M. Fleischmann, P. J. Hendra and A. J. McQuillan, Chem. Phys. Lett., 1974, 26, 163–166 CrossRef CAS.
  5. M. Rycenga, X. Xia, C. H. Moran, F. Zhou, D. Qin, Z. Y. Li and Y. Xia, Angew. Chem., 2011, 123, 5587–5591 CrossRef.
  6. X. Zhang, N. C. Shah and R. P. Van Duyne, Vib. Spectrosc., 2006, 42, 2–8 CrossRef CAS.
  7. M. P. Konrad, A. P. Doherty and S. E. Bell, Anal. Chem., 2013, 85, 6783–6789 CrossRef CAS PubMed.
  8. K. Kneipp, Y. Wang, H. Kneipp, L. T. Perelman, I. Itzkan, R. R. Dasari and M. S. Feld, Phys. Rev. Lett., 1997, 78, 1667 CrossRef CAS.
  9. W. B. Lacy, J. M. Williams, L. A. Wenzler and J. M. Harris, Anal. Chem., 1996, 68, 1003–1011 CrossRef CAS.
  10. X. Li, W. Xu, J. Zhang, H. Jia, B. Yang, B. Zhao and Y. Ozaki, Langmuir, 2004, 20, 1298–1304 CrossRef CAS PubMed.
  11. Y. H. Chen and C. S. Yeh, Colloids Surf., A, 2002, 197, 133–139 CrossRef CAS.
  12. P. C. Lee and D. Meisel, J. Phys. Chem. Lett., 1982, 86, 3391–3395 CAS.
  13. J. Neddersen, G. Chumanov and T. M. Cotton, Appl. Spectrosc., 1993, 47, 1959–1964 CrossRef CAS.
  14. M. Fan, F. Cheng, C. Wang, Z. Gong, C. Tang, C. Man and A. G. Brolo, Chem. Commun., 2015, 51, 1965–1968 RSC.
  15. H. Cho, B. Lee, G. L. Liu, A. Agarwal and L. P. Lee, Lab Chip, 2009, 9, 3360–3363 RSC.
  16. M. Park, Y. J. Oh, S. G. Park, S. B. Yang and K. H. Jeong, Small, 2015, 11, 2487–2492 CrossRef CAS PubMed.
  17. D. Li, D. W. Li, J. S. Fossey and Y. T. Long, Anal. Chem., 2010, 82, 9299–9305 CrossRef CAS PubMed.
  18. D. Choi, T. Kang, H. Cho, Y. Choi and L. P. Lee, Lab Chip, 2009, 9, 239–243 RSC.
  19. W. Wang, Y. Yin, Z. Tan and J. Liu, Nanoscale, 2014, 6, 9588–9593 RSC.
  20. Y. Cai, Y. Chen, X. Hong, Z. Liu and W. Yuan, Int. J. Nanomed., 2013, 8, 1111–1120 Search PubMed.
  21. R. J. Krupadam, B. A. Korde, M. Ashokkumar and S. D. Kolev, Anal. Bioanal. Chem., 2014, 406, 5313–5321 CrossRef CAS PubMed.
  22. T. Yao, S. Guo, C. Zeng, C. Wang and L. Zhang, J. Hazard. Mater., 2015, 292, 90–97 CrossRef CAS PubMed.
  23. D. C. Pregibon, M. Toner and P. S. Doyle, Science., 2007, 315, 1393–1396 CrossRef CAS PubMed.
  24. S. Lone, H. C. Kim and S. W. Nam, Chem. Commun., 2011, 47, 2634–2636 RSC.
  25. C. H. Chen, A. R. Abate and D. Lee, Adv. Mater., 2009, 21, 3201–3204 CrossRef CAS.
  26. J. P. Abid, A. W. Wark, P. F. Brevet and H. H. Girault, Chem. Commun., 2002, 792–793 RSC.
  27. M. Basuny, I. O. Ali, A. A. El-Gawad, M. F. Bakr and T. M. Salama, J. Sol-Gel Sci. Technol., 2015, 75, 530–540 CrossRef CAS.
  28. Y. Qiu, F. Wang, Y. M. Liu, W. Wang, L. Y. Chu and H. L. Wang, Sci. Rep., 2015, 5, 13060 CrossRef PubMed.
  29. S. E. Bae, J. S. Son, K. Park and D. K. Han, J. Controlled Release, 2009, 133, 37–43 CrossRef CAS PubMed.
  30. T. K. Kim, J. J. Yoon, D. S. Lee and T. G. Park, Biomaterials, 2006, 27, 152–159 CrossRef CAS PubMed.
  31. J. P. Hunt and H. Taube, J. Am. Chem. Soc., 1952, 74, 5999–6002 CrossRef CAS.
  32. C. H. Liao and M. D. Gurol, Environ. Sci. Technol., 1995, 29, 3007–3014 CrossRef CAS PubMed.
  33. G. S. Wang, S. T. Hsieh and C. S. Hong, Water Res., 2000, 34, 3882–3887 CrossRef CAS.
  34. X. Deng, G. B. Braun, S. Liu, P. F. Sciortino Jr, B. Koefer, T. Tombler and M. Moskovits, Nano Lett., 2010, 10, 1780–1786 CrossRef CAS PubMed.
  35. F. D. Mai, T. C. Hsu, Y. C. Liu, K. H. Yang and B. C. Chen, Chem. Commun., 2011, 47, 2958–2960 RSC.

Footnote

Electronic supplementary information (ESI) available. See DOI: 10.1039/c6ra17820k

This journal is © The Royal Society of Chemistry 2016
Click here to see how this site uses Cookies. View our privacy policy here.