
 Open Access Article
 This Open Access Article is licensed under a
 Creative Commons Attribution 3.0 Unported Licence
Size-controlled synthesis of gold nanoparticles by a novel atmospheric pressure glow discharge system with a metallic pin electrode and a flowing liquid electrode
A.
Dzimitrowicz
a,
K.
Greda
a,
T.
Lesniewicz
b,
P.
Jamroz
a,
M.
Nyk
c and
P.
Pohl
*a
aWroclaw University of Technology, Faculty of Chemistry, Department of Analytical Chemistry and Chemical Metallurgy, Wybrzeze Stanislawa Wyspianskiego 27, 50-370 Wroclaw, Poland. E-mail: pawel.pohl@pwr.edu.pl
bOpEx (Six Sigma) Master Black Belt Independent Consultant, Klodzka 1f/1, 55-040 Bielany Wroclawskie, Poland
cWroclaw University of Technology, Faculty of Chemistry, Department of Advanced Materials Engineering and Modelling, Wybrzeze Stanislawa Wyspianskiego 27, 50-370 Wroclaw, Poland
First published on 9th August 2016
Abstract
A direct current atmospheric pressure glow discharge (APGD) operated between a pin-type solid metallic electrode and the surface of a flowing solution (the liquid electrode), positively or negatively charged and serving as the flowing liquid anode (FLA) or cathode (FLC), was used for synthesizing gold nanoparticles (AuNPs). To the best of our knowledge, the synthesis of AuNPs in such a system, with no noble gas required to support the APGD, has never been reported. The effect of the selected operating parameters on the performance of the AuNPs synthesis in the plasma-reaction system with the FLA or FLC was examined. The design of the experiments (DOE) was conducted using the response surface regression (RSR) approach. The response of both systems was the wavelength of the maximum (λmax) of the localized surface plasmon resonance (LSPR) absorption band of the AuNPs. On the basis of the established full quadratic regression models, the optimal operating parameters for both plasma-reaction systems (with the FLA or the FLC) were selected, which allowed for the smallest in size spherical AuNPs to be obtained. Both regression models were validated, the AuNPs produced in both plasma-reaction systems under the optimal operating parameters were characterized by UV-Vis absorption spectrophotometry, scanning electron microscopy (SEM) and transmission electron microscopy (TEM).
Introduction
Conventional methods for the synthesis of metallic nanoparticles (NPs) based on colloidal chemistry typically require many processing stages, including a cleaning step of the resulting nanofluids with various solvents.1 Unfortunately, multi-step methods are less feasible for industrial applications and this limits their throughput.2 Additionally, potentially toxic chemical reagents, e.g. NaBH4, are often used to reduce the NP precursors, making the synthesized metal nanocolloids unsafe and bioincompatible.1,3 Finally, the necessity to separate the NPs and clean them from the excess of the reducing agents can result in the irreversible contamination of their surface with different impurities.2In response to the above mentioned drawbacks of the traditional colloidal chemistry synthesis methods, the last decade of research activity in nanotechnology has brought a new alternative solution to metallic NP synthesis. It is a plasma-mediated, single-step, green synthesis process that takes place at the plasma–liquid interface of the atmospheric pressure glow discharge (APGD) generated between gaseous jets and the surfaces of the liquids containing the metallic precursors.4,5
The advantages of the plasma-assisted metallic NPs synthesis method are its simplicity, efficiency, low operation and material costs and the rapidness of the metallic NP nucleation and further growth.1 Indeed, the APGDs generated in contact with the relevant liquids are typically sustained in open-to-air atmosphere without any expensive vacuum equipment and can be operated with very low electric power.6,7 The discharge currents accompanying the normal operation of the APGDs are commonly within 1–5 mA.1,2,8–20 Higher discharge currents, e.g. 8,21 10,22 13,23,24 and 15 mA,21 are also used. The sustaining voltages change from 290 to 450 V,12,17,23,24 but in general they are not higher than 800–2000 V.1,2,8,9,13–15,22 The rapid and single-step production of the metallic NPs in the solutions is possible under ambient conditions because high-energy electrons from the discharge reach the surface of the liquid and, depending on their kinetic energy, participate in forming the various species, e.g. H2O2, OH, or they simply become solvated electrons.8,25 Both the species and/or solvated electrons can reduce the metallic NP precursors dissolved in the solutions and, as a result, the metal nanocolloids are instantly formed.
The construction of the open-to-air plasma-reaction chamber is relatively uncomplicated and inexpensive.4,5 In a typical plasma-reaction setup, a stable APGD is initiated between a low-flow gaseous jet cathode and a counter electrode, which is the liquid with an anode immersed into it, i.e. a graphite rod,1,8,9,13–15,17 Pt foil,2,10–12,16,21,23,24 a stainless-steel (SS) rod,8 a SS disk,22 or a Ni wire.8 To sustain the gaseous jet, SS,1,2,8–13,16–22 Cu,6,23,24 or Ni14,15 capillary tubes are used and Ar,1,6,10–12,14,15,23,24 He,2,8,9,13,16–21 or He mixed with H2 (ref. 22) are passed through the tubes at a relatively low flow rate, i.e. 10–50 sccm.1,2,6,8,10–17,21,23,24 Higher flow rates of the jet-supporting gases are also applied, i.e. 200 sccm18–20 and 600 sccm,22 or even 1000–1100 sccm18,19 when another jet sheath flow is used. The capillary tube is pointed downward, perpendicular to the surface of the liquid, grounded and negatively biased at a direct current high voltage (dc-HV). This makes the gaseous jet serve as the cathode of the discharge system and as the source of the high-energy electrons available for the plasma–liquid interactions. Instead of a solid anode, another gaseous jet can be applied.18–20 In this case, the metallic NPs are generated by irradiating the surface of the liquid not only with electrons but also with positive ions coming from the positively charged gaseous jet anode.18–20 The gap between the capillary tube tip and the liquid surface is usually 1–2 mm,1,2,6,10–12,14–16,18–21,23,24 but it can also be a bit lower (e.g. 0.3 mm,17 0.7 mm,8,9,13 and 0.9 mm (ref. 8)) or higher (5 mm (ref. 22)).
The APGD-based plasma-reaction systems and the plasma–liquid interactions accompanying them have thus far been used to synthesize AuNPs,6,8–11,13,18–21 AgNPs,10–12,16–20,24 alloyed AuxAg1−xNPs,2 core–shell Ag@AuNPs,20 PtNPs,22 as well as Fe2O3NPs,18 Fe3O4NPs,18,23 or Fe oxide nanoclusters.1 Fructose,2,10,11,16,21 sucrose,17 dextran,1,24 citric acid,6 or sodium dodecyl sulfate18–20 are applied to prevent uncontrolled particle growth and the agglomeration of the synthesized metallic NPs. Additionally, the APGDs generated in contact with liquid media were also used to modify the surface properties of the Si nanocrystals (SiNCs).8,14,15
All cited plasma-reaction systems are non-flow-through since the solutions are in small vessels1,2,8–17,21,22 or U-6,23,24 and H-shaped18–20 cells, and the synthesis is commonly performed within 1 to 30 min. To enhance this limited through-put of the APGD-assisted synthesis method and to increase its scope for the industrial applications, our research group developed a flow-through system and fully optimized it to obtain the spherical AuNPs of the smallest diameter.26,27 The system consisted of a flowing liquid cathode (FLC), i.e. a solution containing HAuCl4 and gelatin, which was continuously introduced to the system through a quartz tube at 3.0–5.0 mL min−1 and negatively charged through a Pt wire, and a gaseous jet anode, operated in Ar that was introduced at 60–180 sccm through a SS capillary tube. This plasma-reaction system continuously produced the AuNPs when the solutions of the AuNP precursors were introduced to it. The discharge was generated across a 5.0 mm gap between the surface of the flowing solution and the tip of the SS capillary tube. The discharge current was in the range of 15–45 mA. At the same time, another flow-through system was described by Ghosh et al. and used for the production of the AgNPs.28 In this system an Ar jet, formed in a SS capillary tube and negatively biased, was perpendicularly positioned to a liquid jet containing AgNO3 and poly(acrylic) acid and positively biased through a woven Pt wire. The APGD was sustained in a 1 mm gap between the surface of the liquid jet and the SS capillary tube.
Since Ar or He gaseous jets are used as the cathodes or/and the anodes of the APGD-based plasma-reaction systems, the cost-effectiveness of the metallic NP synthesis in the overwhelming majority of the non-flow-through systems and flow-through systems26–28 is considerably reduced. Additionally, in the case of the non-flow-through systems, the yield of the metal nanocolloidal products is quite limited. Hence, the present work aimed to further develop and improve the APGD-based plasma-reaction systems to synthesize the metallic NPs on the example of Au. Here, to simplify the system design and reduce the operational costs, the APGD was fully sustained and stably operated across the gap between a pin-type solid metallic electrode and the surface of a flowing solution (the liquid electrode) that was positively or negatively charged and served as the flowing liquid anode (FLA) or cathode (FLC), respectively. No noble gas was required to sustain and operate the discharge. To the best of our knowledge, the synthesis of the AuNPs in such system has never been reported. To study the effect of the selected operating parameters on the performance of the AuNP synthesis in both systems, i.e. with the FLA or the FLC depending on the polarization of the electrodes, the design of experiments (DOE) along with the response surface regression (RSR) approach was used. The response of both systems was the wavelength of the maximum (λmax) of the localized surface plasmon resonance (LSPR) absorption band of the AuNPs. On the basis of the full quadratic regression models, involving the main effects and the interactions of the studied parameters, the optimal operating parameters for both plasma-reaction systems (with the FLA or the FLC), which resulted in the spherical AuNPs with the smallest particle size, were selected. Both established regression models were validated, and the AuNPs obtained using the optimal parameters were characterized by UV-Vis absorption spectrophotometry, scanning electron microscopy (SEM) and transmission electron microscopy (TEM).
Experimental
Reagents and solutions
Re-distilled water was used for all preparations. Chemicals were analytical grade or better and used as received. Chloroauric acid tetrahydrate (HAuCl4·4H2O) was obtained from Avantor Performance Materials (Gliwice, Poland) and used to prepare a 1000 μg mL−1 Au stock solution. To synthesize the AuNPs in the APGD-based plasma-reaction system, the working solutions to support the FLA or the FLC were prepared by appropriately diluting the Au stock solution. The working solutions contained 10.0, 105 or 200 μg mL−1 of the Au(III) ions. Additionally, to prevent the uncontrolled growth of the synthesized AuNPs, their aggregation and sedimentation, gelatin from bovine and porcine bones from Sigma-Aldrich (Steinheim, Germany) were used. This was present in the working solutions at a final concentration of 0, 0.25 or 0.50% (m/v). In the latter case, the appropriate amounts of gelatin powder were dissolved at first in the 50 mL portions of water, and then, after gelatin swelling, the resulting aliquots were warmed to ∼36 °C and allowed to cool to room temperature. Finally, the appropriate amounts of the Au stock solution were added, and the working solutions were diluted with water to the required volume.Plasma-reaction system and the AuNP synthesis
A schematic diagram of the flow-through plasma-reaction system using the APGD to synthesize the AuNPs is given in Fig. 1. The APGD was sustained and stably operated in the open-to-air atmosphere with a 5.0 mm gap between a sharpened tip of a tungsten (W) rod (id 4.0 mm) and the surface of the flowing solution that was positively (the FLA) or negatively (the FLC) biased, as shown in Fig. 1a and b, respectively. The working solutions were delivered to the plasma-reaction system at flow rates of 1.0, 3.5 and 6.0 mL min−1 using a LabCraft (France) peristaltic pump, model Hydris 05. A quartz tube (id 2.0 mm), onto which a graphite tube (id 4.0 mm) was mounted, was used for this purpose. To charge the working solutions, a Pt wire was attached to the graphite tube. The overflowing solutions were collected in a small glass reservoir, which was a part of the liquid electrode casing, and were instantly drained out with the aid of another LabCraft Hydris 05 peristaltic pump. When the plasma-reaction system was working with the FLC, the solid pin electrode was positively biased at 900–1400 V (the anode of the system) using a dc-HV generator (Laboratory Electronic Instrumentation Production, Wroclaw, Poland). By changing the polarization of the electrodes, the plasma-reaction system functioned with the FLA, and the solid pin electrode acted as the cathode. Depending on the dc-HV used, the discharge current was changed within the range of 30 to 60 mA. Additionally, the discharge current was stabilized by a 10 kΩ ballast resistor in the anode circuit. | ||
| Fig. 1 The plasma-reaction systems based on the APGD sustained in the surrounding air between the solid pin electrode and the FLA (a) or the FLC (b). | ||
The synthesis of the AuNPs in the plasma-reaction system operated with the FLA or the FLC was carried out in a continuous-flow mode by introducing the working solutions and sustaining the APGD. The overflowing, APGD-treated solutions, which contained the AuNPs produced at the given working conditions of the plasma-reaction system, were collected into PP stoppered tubes. The Au nanofluids were further characterized with respect to their optical properties (using UV-Vis absorption spectrophotometry) as well as their morphology and particle size (using SEM and TEM).
Characterization of the synthesized AuNPs
The optical properties of the AuNPs colloids were evaluated using UV-Vis absorption spectrophotometry. A double-beam UV-Vis Specord 210 Plus (Analytik Jena AG, Jena, Germany) instrument was applied. The spectral bandwidth of the spectrophotometer was set as 2 nm while the wavelength scan speed was 12![[thin space (1/6-em)]](https://www.rsc.org/images/entities/char_2009.gif) 000 nm min−1. The measured absorption spectra gave information about the λmax of the LSPR absorption band of the AuNPs, normally located within the range of 520–550 nm in the case of spherical AuNPs.29 According to the Mie scattering theory,28 the λmax and its shift was used to elucidate changes in the particle size of the AuNPs synthesized under different working conditions of the plasma-reaction system. A blue shift in the λmax indicated that the obtained AuNPs were of a smaller particle size. The absorption spectra of all the collected solutions containing the Au nanocolloids were acquired 24 h after the APGD treatment in the spectral range of 400–1100 nm versus re-distilled water as the blank. Additionally, the stability of the obtained AuNPs (stored at 4 °C in dark) was determined by measuring the position of the λmax of the LSPR absorption band up to 4 months after the APGD treatment.
000 nm min−1. The measured absorption spectra gave information about the λmax of the LSPR absorption band of the AuNPs, normally located within the range of 520–550 nm in the case of spherical AuNPs.29 According to the Mie scattering theory,28 the λmax and its shift was used to elucidate changes in the particle size of the AuNPs synthesized under different working conditions of the plasma-reaction system. A blue shift in the λmax indicated that the obtained AuNPs were of a smaller particle size. The absorption spectra of all the collected solutions containing the Au nanocolloids were acquired 24 h after the APGD treatment in the spectral range of 400–1100 nm versus re-distilled water as the blank. Additionally, the stability of the obtained AuNPs (stored at 4 °C in dark) was determined by measuring the position of the λmax of the LSPR absorption band up to 4 months after the APGD treatment.
The first visual evidence of the morphology of the obtained AuNPs was attained using SEM. To provide good resolution for the SEM photomicrographs, the AuNPs present in the APGD-treated solutions were initially purified following a procedure recently described by Dzimitrowicz et al.26 A Joel (Joel USA Inc., Peabody, MA, USA) high-performance scanning electron microscope, model JSM-6610LVnx, was applied to characterize and image the AuNPs. The low vacuum pressure in the SEM chamber was within 10–270 Pa. The SEM micrographs were recorded using a magnification factor from 12000 to 33000 when adjusting the accelerating voltage within the range from 20–28 kV. Two drops of the fluids containing the purified AuNPs were placed on C sticky tape and evaporated.
Due to the limited SEM resolution, TEM was used for determining the shape and the size as well as the size distribution of the obtained AuNPs. A FEI Tecnai G220 X-TWIN instrument (FEI, Hillsboro, OR, USA) equipped with an FEI energy dispersive X-ray microanalyzer (EDXMA) was applied. The samples for the TEM and EDXMA measurements were prepared by putting a drop of the fluids containing the purified AuNPs onto a GF Microsystems (Poznan, Poland) ultra-thin Cu substrate grid (CF400-Cu-UL, 400 mesh) and allowing it to dry under an IR lamp. To calculate the average particle size of the AuNPs, the ImageJ software (version 1.46 r, NIH) was applied.
Optimization of the AuNP production by the design of experiments and response surface regression
A Box–Behnken experimental design (BBD) was used to develop the second-order response surface model for the λmax, which was taken on the basis of the UV-Vis absorption spectra of the APGD-treated solutions containing the AuNPs, and to identify the optimum levels of the independent parameters that provided the lowest λmax value referring to the spherical AuNPs of the smallest particle size. The BBD was selected in this particular case because it required fewer treatments than a central composite design (CCD) in the case of the system with 4 parameters. The mentioned continuously changed experimental parameters (factors), related to the performance of the plasma-reaction system and the course of the plasma–liquid interactions, were the flow rate of the flowing liquid electrode (the FLA or the FLC, in mL min−1) (A), the discharge current (in mA) (B), the Au(III) ions concentration in the solution of the FLA or the FLC (in μg mL−1) (C) and the gelatin concentration in this solution (in %, m/v) (D). The levels of the factors A, B, C and D were fixed on the basis of the preliminary experimental trials and considering the stable operation of the APGD.For modeling the response surface, the BBD was composed of 27 randomized treatments (runs) at 3 different levels (+1, 0, −1 in coded units) and included 3 center points (0, 0, 0). All the treatments were carried out in one block. The details of the runs with the input parameters are given in Table 1.
| Run order | Actual and (coded) levels of parameters | Response (λmax), nm | |||||||
|---|---|---|---|---|---|---|---|---|---|
| Standardized | Randomized | A, mL min−1 | B, mA | C, μg mL−1 | D, % | FLA | FLC | ||
| Mean (n = 3) | SD | Mean (n = 3) | SD | ||||||
| a SD – standard deviation. | |||||||||
| 1 | 21 | 3.5 (0) | 30 (−1) | 105 (0) | 0.00 (−1) | 541.4 | 3.8 | 542.4 | 7.9 |
| 2 | 20 | 6.0 (+1) | 45 (0) | 200 (+1) | 0.25 (0) | 543.4 | 6.5 | 546.4 | 5.6 |
| 3 | 5 | 3.5 (0) | 45 (0) | 10 (−1) | 0.00 (−1) | 529.2 | 4.0 | 544.0 | 2.0 |
| 4 | 23 | 3.5 (0) | 30 (−1) | 105 (0) | 0.50 (+1) | 531.6 | 4.4 | 536.6 | 0.8 |
| 5 | 13 | 3.5 (0) | 30 (−1) | 10 (−1) | 0.25 (0) | 532.0 | 1.8 | 531.0 | 8.1 |
| 6 | 24 | 3.5 (0) | 60 (+1) | 105 (0) | 0.50 (+1) | 533.2 | 4.7 | 540.0 | 1.7 |
| 7 | 6 | 3.5 (0) | 45 (0) | 200 (+1) | 0.00 (−1) | 553.6 | 11.7 | 558.0 | 3.4 |
| 8 | 9 | 1.0 (−1) | 45 (0) | 105 (0) | 0.00 (−1) | 528.0 | 16.4 | 550.2 | 7.1 |
| 9 | 2 | 6.0 (+1) | 30 (−1) | 105 (0) | 0.25 (0) | 542.4 | 8.2 | 550.6 | 20.2 |
| 10 | 4 | 6.0 (+1) | 60 (+1) | 105 (0) | 0.25 (0) | 537.6 | 3.0 | 544.2 | 3.8 |
| 11 | 18 | 6.0 (+1) | 45 (0) | 10 (−1) | 0.25 (0) | 534.0 | 1.4 | 540.4 | 9.6 |
| 12 | 17 | 1.0 (−1) | 45 (0) | 10 (−1) | 0.25 (0) | 536.8 | 1.4 | 534.4 | 6.9 |
| 13 | 14 | 3.5 (0) | 60 (+1) | 10 (−1) | 0.25 (0) | 534.8 | 2.7 | 538.8 | 8.8 |
| 14 | 10 | 6.0 (+1) | 45 (0) | 105 (0) | 0.00 (−1) | 553.2 | 9.6 | 560.6 | 5.6 |
| 15 | 22 | 3.5 (0) | 60 (+1) | 105 (0) | 0.00 (−1) | 566.8 | 19.9 | 553.2 | 1.7 |
| 16 | 27 | 3.5 (0) | 45 (0) | 105 (0) | 0.25 (0) | 548.0 | 12.4 | 545.6 | 6.1 |
| 17 | 19 | 1.0 (−1) | 45 (0) | 200 (+1) | 0.25 (0) | 538.4 | 3.1 | 546.8 | 0.7 |
| 18 | 11 | 1.0 (−1) | 45 (0) | 105 (0) | 0.50 (+1) | 539.6 | 6.4 | 548.8 | 0.1 |
| 19 | 15 | 3.5 (0) | 30 (−1) | 200 (+1) | 0.25 (0) | 548.4 | 5.7 | 550.8 | 0.8 |
| 20 | 12 | 6.0 (+1) | 45 (0) | 105 (0) | 0.50 (+1) | 531.4 | 0.8 | 549.0 | 1.8 |
| 21 | 8 | 3.5 (0) | 45 (0) | 200 (+1) | 0.50 (+1) | 548.8 | 9.6 | 543.6 | 0.3 |
| 22 | 3 | 1.0 (−1) | 60 (+1) | 105 (0) | 0.25 (0) | 536.2 | 4.4 | 540.0 | 0.7 |
| 23 | 16 | 3.5 (0) | 60 (+1) | 200 (+1) | 0.25 (0) | 534.4 | 2.4 | 551.6 | 6.1 |
| 24 | 7 | 3.5 (0) | 45 (0) | 10 (−1) | 0.50 (+1) | 532.0 | 2.5 | 529.6 | 4.1 |
| 25 | 25 | 3.5 (0) | 45 (0) | 105 (0) | 0.25 (0) | 533.2 | 1.6 | 531.0 | 9.9 |
| 26 | 1 | 1.0 (−1) | 30 (−1) | 105 (0) | 0.25 (0) | 531.6 | 0.8 | 540.0 | 7.6 |
| 27 | 26 | 3.5 (0) | 45 (0) | 105 (0) | 0.25 (0) | 534.2 | 1.6 | 544.2 | 2.1 |
Results and discussion
Model development for the plasma-reaction systems with the flowing liquid electrodes
The analysis of the results for the BBD matrix for the plasma-reaction system working with the FLA started with their inspection. The variability of the response (the λmax) between the treatments acquired for 3 independent series of the results was checked. By analyzing a scatter plot overlying the response for all 3 measurement series versus the randomized run order, it was revealed that the variability of the response between the treatments was higher than the variability of the response within the treatments. This could indicate the presence of active parameters in the BBD. Additionally, no correlation between the standard deviation (SD) for the 3 replicated λmax values at given parameters settings and the mean value of the λmax in those conditions was observed; hence, there was no need to stabilize the variance of the response through its transformation. Finally, a scatter plot of the mean value of the λmaxversus the randomized run order did not indicate any trend or pattern. Therefore, it was concluded that the plasma-reaction system with the FLA and the AuNP synthesis process in this system were likely not affected by any uncontrolled external parameters.The response surface, giving the relationship between the λmax and the operating parameters, was approximated with a second-order polynomial function using the least-square regression model and included the linear combinations of the parameters (A, B, C and D), their quadratic combinations (AA, BB, CC and DD) and 2-way interactions (AB, AC, AD, BC, BD, CD). The selection of the significant terms in the response surface regression (RSR) model was carried out using a forward selection procedure. The procedure started with no predictors in the model and iteratively added the most significant parameters at each step. It stopped when all parameters not in the model had a p-value greater than that specified at the beginning α-to-enter value (α-to-enter = 0.1). The developed RSR full-quadratic model was given as: λmax = 500.3 + 4.39 × A + 0.483 × B + 0.0598 × C + 99.6 × D − 13.36 × AD − 1.587 × BD (in uncoded units). The analysis of variance (ANOVA) was used to check the model assumptions at a significance level of α = 0.1. On the basis of the ANOVA output (see details in Table 2), it can be seen that the RSR model is statistically significant (the F-value of 4.00 with the p-value of 0.009). Additionally, the lack-of-fit test does not identify the lack of fit of the model since the respective p-value is at 0.744. The R-squared value for the RSR model was 54.6% meaning that it explained almost 55% of the total variance of the λmax. The adjusted R-squared value was lower (40.9%), probably due to a couple of insignificant terms. As can be seen from Table 2, the effect of the terms C, D, AD and BD, included in the RSR model equation, was significant as the p-values for these terms were lower than α. The predicted R-squared value (0.4%) was however close to 0%, pointing out that the developed RSR model for the plasma-reaction system with the FLA could not well predict the response for new observations.
| Source of data | DF | Adjusted SS | Adjusted MS | F-Valueb | p-Value |
|---|---|---|---|---|---|
| a DF – degrees of freedom. SS – sum of squares. MS – mean of squares. A – the flow rate of the flowing liquid electrode. B – the discharge current. C – the Au(III) ions concentration. D – the gelatin concentration. b The value of the F-test for comparing the model variance with the residual (error) variance. | |||||
| The plasma-reaction system with the flowing liquid anode (FLA) | |||||
| Model | 6 | 1168.16 | 194.69 | 4.00 | 0.009 |
| Linear | 4 | 747.66 | 186.91 | 3.84 | 0.018 |
| A | 1 | 82.16 | 82.16 | 1.69 | 0.209 |
| B | 1 | 20.28 | 20.28 | 0.42 | 0.526 |
| C | 1 | 387.60 | 387.60 | 7.96 | 0.011 |
| D | 1 | 257.61 | 257.61 | 5.29 | 0.032 |
| 2-Way interactions | 2 | 420.50 | 210.25 | 4.32 | 0.028 |
| AD | 1 | 278.89 | 278.89 | 5.73 | 0.027 |
| BD | 1 | 141.61 | 141.61 | 2.91 | 0.104 |
| Error | 20 | 973.31 | 48.67 | ||
| Lack-of-fit | 18 | 836.48 | 46.47 | 0.68 | 0.744 |
| Pure error | 2 | 136.83 | 68.41 | ||
| Total | 26 | 2141.47 | |||
|
|||||
| The plasma-reaction system with the flowing liquid cathode (FLC) | |||||
| Model | 5 | 1125.74 | 225.15 | 10.21 | 0.000 |
| Linear | 3 | 908.22 | 302.74 | 13.73 | 0.000 |
| A | 1 | 80.08 | 80.08 | 3.63 | 0.071 |
| C | 1 | 520.08 | 520.08 | 23.58 | 0.000 |
| D | 1 | 308.05 | 308.05 | 13.97 | 0.001 |
| Square | 2 | 217.52 | 108.76 | 4.93 | 0.018 |
| AA | 1 | 113.68 | 113.68 | 5.15 | 0.034 |
| DD | 1 | 146.82 | 146.82 | 6.66 | 0.017 |
| Error | 21 | 463.20 | 22.06 | ||
| Lack-of-fit | 19 | 333.42 | 17.55 | 0.27 | 0.956 |
| Pure error | 2 | 129.79 | 64.89 | ||
| Total | 26 | 2141.47 | |||
In the case of the plasma-reaction system working with the reversed polarity, where the flowing solution of the AuNP precursor with added gelatin acted as the FLC, the same BBD-RSR approach was used. As before, the experiment was repeated 3 times and the resulting series of the responses were considered. The analysis of the results obtained for the BBD matrix (see the input parameters and the output response as the mean values of the λmax along with the SD values in Table 1) also confirmed that the variability between the treatments was dominate. This pointed out that there were active parameters in the BBD. Considering the randomized run order, there was no trend or pattern evident in the data, indicating that the parameters selected for the plasma-reaction system with the FLC were fully controlled. Additionally, this also confirmed that the AuNP synthesis process was not affected by any uncontrolled external parameters. The RSR with the forward selection of the terms (α-to-enter = 0.1) was used as before to develop the best model describing the effect of the parameters A, B, C and D on the λmax. A full quadratic equation was used to fit the response surface, and the developed RSR model was given as: λmax = 547.36 − 3.69 × A + 0.0693 × C − 58.6 × D + 0.674 × AA + 76.6 × DD (in uncoded units). The ANOVA evaluation of this RSR model is given in Table 2. As can be seen, the model is statistically significant (the F-value of 10.21 with the p-value < 0.001). The relatively high non-significant p-value for the lack-of-fit test (0.956) also confirmed that the model fits the data. The values of the R-squared and the adjusted R-squared were high, i.e. 70.8% and 63.9%, showing the goodness-of-fit of the developed RSR model. Additionally, it seems that the model could well predict the response for new treatments since the predicted R-squared value was 53.1%. Considering the p-values, the following terms included in the fitted model had a significant effect on the λmax: A, C, D as well as AA and DD.
Validation of the developed models
To validate the RSR models developed for the plasma-reaction system working with the FLA and the FLC, the residuals were analyzed by plotting the normal probability plots (the distribution of the standardized residuals) and the scatter plots of the standardized residuals versus the fitted values. As can be seen from Fig. 2, any unusual observations or deviations from the normal distribution of the residuals can be observed. In the case of the scatter plots of the standardized residuals versus the fitted values, no patterns such as strong curvatures or clusters, which might indicate problems with the regression models, were noted. The points were rather randomly scattered on both sides of 0. Only single large residuals were identified, i.e. for the run no. 23 in the model of the system with the FLA and run no. 25 in the model of the system with the FLC. This confirmed the correctness of both models and the goodness-of-fit of the experimental data with the RSRs found using the BBD-RSR approach. Considering these observations, it was concluded that there was no reason to reject both models. | ||
| Fig. 2 The distribution of the standardized residuals for the λmax and the standardized residuals versus the fitted values for the RSR models developed for the plasma-reaction system with the FLA (a and b) and the FLC (c and d). | ||
On the basis of both RSR model equations, the combination of the input parameters that jointly led to obtaining the response of the lowest λmax value was determined using the respective optimization plots (see Fig. 3). It was established that in the case of the plasma-reaction system working with the FLA, the lowest λmax was obtained for the AuNPs produced when the following parameters were used: 6.0 mL min−1 (A), 60 mA (B), 10.0 μg mL−1 (C) and 0.50% (D). The predicted value of the λmax under these conditions was 518.3 ± 6.5 nm. To validate the RSR model, the plasma-reaction system with the FLA was operated under the established optimal settings. During 3 independently run experiments, the APGD-treated solutions were collected, and the optical properties of the AuNPs synthesized in the above mentioned experimental conditions were determined by UV-Vis absorption spectrophotometry. It was found that the λmax of the LSPR absorption band of the AuNPs was 518.8 ± 1.1 nm. This value corresponded well with the value predicted by the model and confirmed its reliability; the relative error was only 0.1%.
 | ||
| Fig. 3 The effects of the main parameters on the λmax derived from the RSR models developed for the plasma-reaction system with the FLA (a) and the FLC (b). | ||
In a similar way, the optimal settings of the working parameters providing the lowest λmax were derived from the respective optimization plots (see Fig. 3) for the plasma-reaction system operated with the FLC. These parameters were 2.7 mL min−1 (A), 10.0 μg mL−1 (C) and 0.38% (D). According to the RSR model, the predicted value of the λmax under these conditions was 531.8 ± 2.0 nm. During the validation of the model, the plasma-reaction system was operated under the optimal settings, and the APGD-treated solutions containing the synthesized AuNPs were collected and subsequently analyzed by UV-Vis absorption spectrophotometry. It was determined that the λmax of the LSPR absorption band of the produced AuNPs was 526.2 ± 2.1 nm. This was in a quite good agreement with the predicted value since the relative error was −1.0%.
The effects of the main parameters on the performance of the plasma-reaction systems
In the case of the plasma-reaction system sustained between the solid pin cathode and the FLA, the model developed using the BBD-RSR approach showed that the λmax of the LSPR absorption band of the AuNPs produced using this system was affected by the flow rate of the FLA (A), the discharge current (B), the Au concentration in the solution of the FLA (C) and the gelatin concentration in the FLA solution (D). A graphical representation of the effects of all 4 main parameters is shown in Fig. 3a with the labeled optimal settings responsible for producing the AuNPs with the smallest particle size that correspond to the lowest value of the λmax in the LSPR absorption band for these nanostructures.As can be seen, the increase in the flow rate of the FLA (A) and the discharge current (B) leads to a decrease in the λmax as a result of the synthesis of the small sized AuNPs. This behavior could rationally be explained considering the reactions occurring at the plasma-liquid interface under the impact of the electrons on the surface of the FLA solution18–20 and the competition existing between the nucleation and growth of the AuNPs in the liquid phase.13 It seems coherent that at higher flow rates of the FLA solution (A) the contact time of the APGD phase with the solution containing the AuCl4− ions would be shorter. Hence, the surface-mediated interactions of the resulting nucleation seeds or the growing AuNPs with the partially reduced AuCl4− ions, leading to the formation of larger nanostructures, would be less probable. As a result, very small in size and spherical in shape AuNPs could be produced.
It can also be presumed that the rate of irradiation of the FLA solution surface with the high-energy electrons would be enhanced when the discharge current increased (B). In these conditions, the hydrated electrons could readily be formed, subsequently inducing the formation of the H radicals.18–20 Both the hydrated electrons and the H radicals could be responsible for the massive reduction of the AuCl4− ions and the development of a great number of nucleation seeds. This could certainly result in the synthesis of the AuNPs with a smaller particle size. Finally, as the concentration of the Au(III) ions (C) increases (see Fig. 3a), the number of the nucleation seeds would be much higher, thereby significantly reducing the distance between them. Due to the increased probability of interactions between the nucleation seeds and the growing AuNPs as well as the higher amounts of the AuCl4−, larger AuNPs would be synthesized. Similar explanations reference the effects of the discharge current and the concentration of the AuNP precursor, but they were reported for non-flow through systems operated with gaseous (Ar or He) jets as the cathodes (here, a solid W rod was used and the discharge was fully sustained in the surrounding air) and were lately given by Mariotti et al.,9 Patel et al.,13 Wang et al.,6 and Huang et al.21 It was found that the presence of gelatin was required to stabilize the synthesized AuNPs. As can be seen from Fig. 3a, high concentrations of gelatin facilitate the formation of the AuNPs with small particle sizes by preventing their agglomeration and further growth.26 The need to use the stabilizers, e.g. fructose21 or sodium citrate,6 in the plasma-mediated synthesis of the AuNPs was reported in other research.
In the case of the plasma-reaction system operated between the solid pin anode and the FLC, the surface of the flowing solutions of the AuCl4− ions was exposed to the positive ions. As compared to the systems with the FLA, it is noted that some of the reactions taking place at the plasma–liquid interface of the system with the FLC and the processes occurring in the liquid phase and accompanying the formation of the AuNPs are different.18,19 It is hypothesized that the positive ions bombarding the liquid surface could trigger the dissociative reaction of the AuCl4− ions.20 Additionally, the reactive species such as H+, OH˙ and H2O2 are effectively produced in this case.18,19,30 According to the developed RSR model, the effect of the discharge current (B) was insignificant on the synthesis process of the AuNPs. Only the flow rate of the FLC solution (A), the AuNP precursor concentration (C) and the gelatin concentration (D) were significant parameters. As can be seen from Fig. 3b, given the optimization plots for this system derived from the RSR regression, at lower flow rates of the FLC solution (A), the plasma-mediated reactions and processes favor the synthesis of the AuNPs with a relatively small particle size as shown by the decreasing λmax values. This could be related to the higher contact time of the solution of the AuCl4− ions with the discharge.30 Likely, H2O2 and the H+ ions could efficiently be produced in these conditions, as measured by Jamroz et al.,30 while the AuCl4− ions could readily dissociate, as presumed by Shirai et al.20 All of this together could induce an easier reduction of the AuCl4− ions and the formation of a higher number of nucleation seeds, finally leading to the synthesis of the small-sized and spherical AuNPs. The effect of the decreased pH on the APGD-treated solutions could also be important and possibly result in etching the AuNPs, making their size smaller and uniform. A similar observation in reference to the effect of the flow rate of the FLC solution on the performance of the AuNP synthesis process was very lately described by Dzimitrowicz et al.27 but for a plasma-reaction system operated with an Ar jet and the FLC. The use of higher concentrations of the AuCl4− ions in the FLC solution was either inconvenient (see Fig. 3b) because it resulted in an increase in the average diameter of the synthesized AuNPs as reflected by the higher λmax values. This was probably related to the enhanced formation of the nucleation seeds in the solution and the higher probability of the interactions of the growing AuNPs with each other and/or with the partly reduced AuCl4− ions as suggested by Patel et al.13 The presence of gelatin in the FLC solution at a relatively high concentration was also required to produce the small-sized AuNPs, likely for the same reasons as in the case of the synthesis process in the plasma-reaction system with the FLA.
Size and shape characterization of the synthesized AuNPs
To confirm the adequacy and the reliability of both RSR models developed for the plasma-reaction system with the FLA and the FLC on the basis of the λmax of the LSPR absorption band measured by UV-Vis absorption spectrophotometry for the AuNPs present in the APGD-treated solutions, as well as the established effects of the significant parameters, both flow-through plasma-reaction systems were used to synthesize the AuNPs under optimal and non-optimal, i.e. boundary and mid, experimental conditions (see details in Table 3). Next, the respective APGD-treated solutions were collected, and the resulting AuNPs were further characterized by DLS (no purification of the obtained nanocolloids) as well as SEM and TEM (with a prior purification of the obtained nanocolloids).| FLA | The system with the FLC | |||||
|---|---|---|---|---|---|---|
| Optimal | Mid | Boundary | Optimal | Mid | Boundary | |
| a Predicted using the developed response surface regression (RSR) models. b Assessed on the basis of the UV-Vis absorption spectra of the LSPR bands measured for the APGD-treated solutions. c Determined using DLS (average diameter ± SD by size number) for the APGD-treated solutions containing the produced AuNPs. d Determined using DLS. | ||||||
| A, mL min−1 | 6.0 | 3.5 | 6.0 | 2.7 | 3.5 | 6.0 |
| B, mA | 60 | 45 | 60 | 60 | 60 | 60 |
| C, μg mL−1 | 10.0 | 105 | 200 | 10.0 | 105 | 200 |
| D, % | 0.50 | 0.25 | 0.00 | 0.38 | 0.25 | 0.00 |
| Predicted λmaxa, nm | 518.3 ± 6.5 | 539.0 ± 1.3 | 567 ± 6.5 | 531.2 ± 2.0 | 540.1 ± 1.6 | 563.7 ± 3.0 |
| Measured λmaxb, nm | 519.6 | 539.6 | 570.2 | 528.2 | 538.4 | 556.8 |
| Particle sizec, nm | 20.0 ± 13.7 | 31.1 ± 21.9 | 82.8 ± 56.9 | 25.8 ± 13.4 | 46.6 ± 32.6 | 69.8 ± 28.3 |
| Diffusion coefficientd, cm2 s−1 | 3.0 × 10⁻⁸ | 1.1 × 10⁻⁸ | 8.6 × 10⁻⁹ | 3.6 × 10⁻⁸ | 1.3 × 10⁻⁸ | 2.4 × 10⁻⁸ |
As can be seen from Table 3, the results on the particle size of the AuNPs produced in the plasma-reaction system with the FLA, assessed using DLS, coincided very well with the results obtained with UV-Vis absorption spectrophotometry and referred to the location of the λmax of the LSPR absorption band of the synthesized nanostructures. Indeed, the average diameters of the AuNPs produced under the mentioned optimal and non-optimal conditions and measured by DLS revealed changes in the λmax caused by changing the parameter settings from the optimal, to mid and boundary conditions. The linear correlation coefficient (r) between the λmax and the average diameter (as determined by the size number) was 0.973. For the boundary conditions, the average diameter of the resulting AuNPs was the highest, while the λmax of the solutions containing the AuNPs produced under these conditions shifted toward the larger wavelengths to the highest degree.
An even better coincidence between the measured optical properties and the size of the synthesized AuNPs was observed for the plasma-reaction system with the FLC. In this case, the r between the λmax and the average diameter, as determined by DLS, for the AuNPs produced in the optimal and non-optimal conditions was 0.991. As compared to the optimal parameters settings, their change to mid and boundary conditions resulted in the production of AuNPs with a bigger particle size that linearly coincided with the red shift of the λmax of the LSPR absorption band.
All findings assessed for the AuNPs synthesized using both plasma-reaction systems under the optimal and non-optimal conditions given in Table 3 were also established to agree with the information retrieved from the SEM and TEM images and related to the particle size of the AuNPs. The representative SEM micrographs of the AuNPs produced in both plasma-reaction systems under the optimal conditions, which provide the smallest particle size, are given in Fig. 4a and b (the system with the FLA) and Fig. 4c and d (the system with the FLC). The representative TEM micrographs of the AuNPs synthesized under the same conditions are given in Fig. 5 (the system with the FLA) and Fig. 6 (the system with the FLC). As can be seen from Fig. 5 and 6, under the optimal parameter settings established on the basis of the developed RSR models, the AuNPs have the smallest diameters, are spherical, uniform (considering relatively narrow particle size distributions) and well dispersed in the medium of the measured nanofluids, with no tendency to agglomerate. The average diameter of the AuNPs synthesized in the plasma-reaction system with the FLA was 10.9 ± 7.9 nm (the calculation was done in the ImageJ software and based on 21 NPs). In the case of the plasma-reaction system with the FLC, the average diameter of the AuNPs was 13.4 ± 8.6 nm (the calculation was done on the basis of 38 NPs). These results corresponded to the outcomes provided by the UV-Vis absorption spectrophotometry and DLS measurements. Indeed, by changing the parameter settings to those recognized as boundary or mid (see details in Table 3), the diameters of the resulting AuNPs, retrieved on the basis of the respective TEM micrographs, were enlarged and in shapes other than spherical, i.e. triangular, pentagonal and hexagonal, were present in the measured nanofluids, leading to the broadening of the particle size distribution.
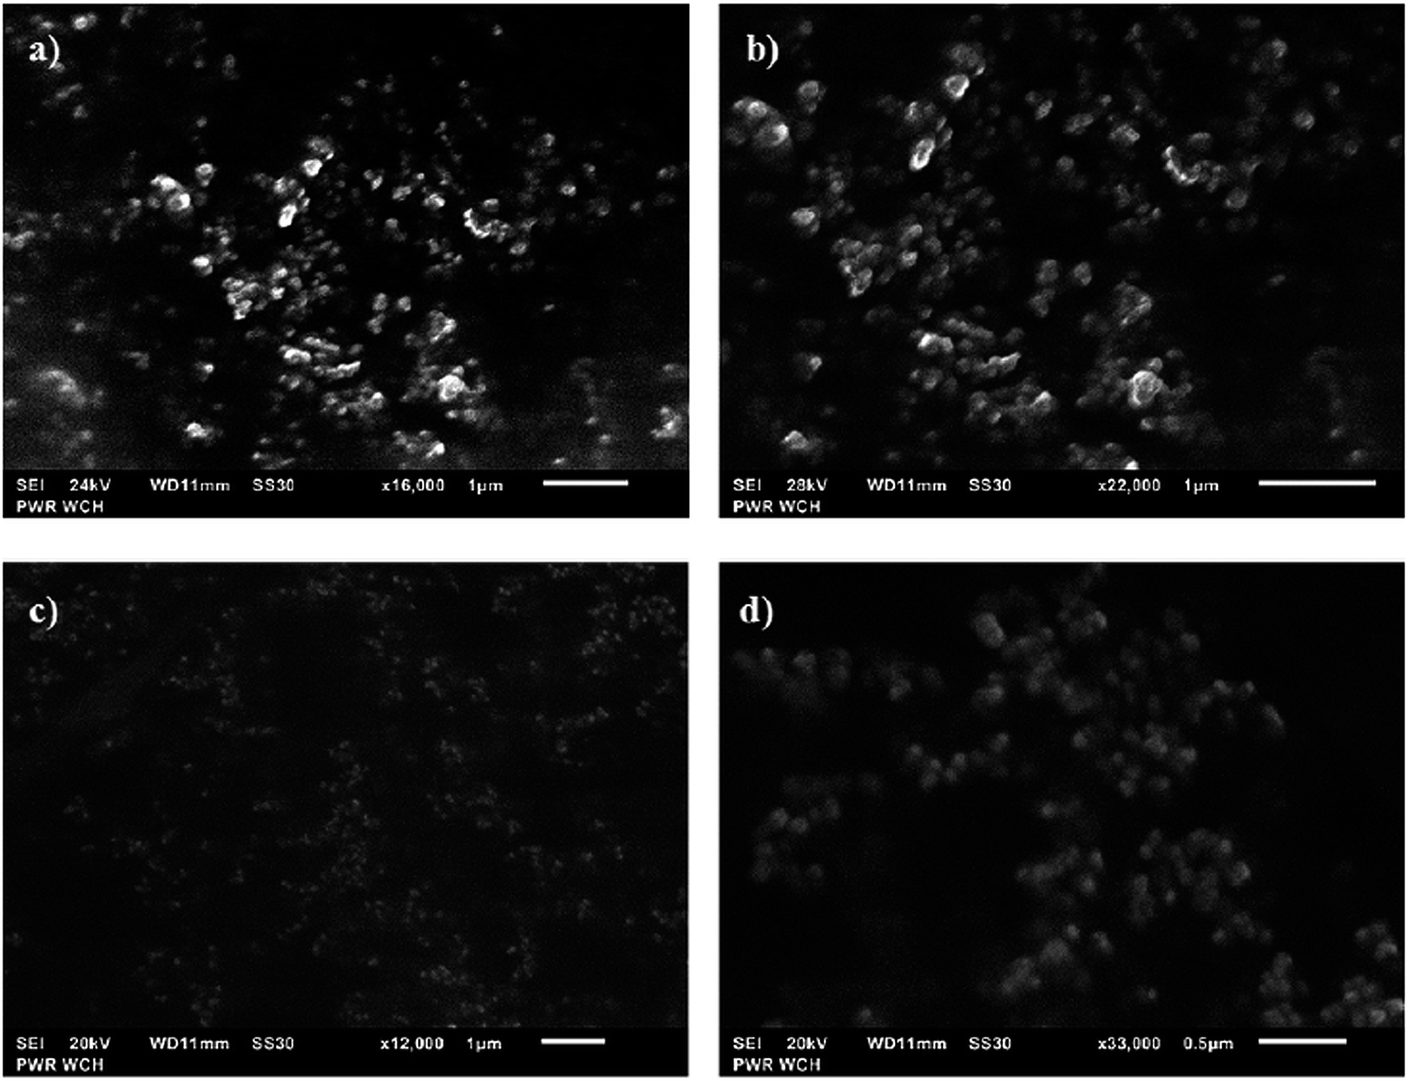 | ||
| Fig. 4 The representative SEM images of the AuNPs synthesized under the optimal conditions using the plasma-reaction system with the FLA (a and b) and the FLC (c and d). | ||
 | ||
| Fig. 5 The representative TEM micrographs of the AuNPs synthesized under the optimal conditions using the plasma-reaction system with the FLA (a–c) along with the EDXMA spectra (d). | ||
 | ||
| Fig. 6 The representative TEM micrographs of the AuNPs synthesized under the optimal conditions using the plasma-reaction system with the FLC (a–c) along with the EDXMA spectra (d). | ||
In addition, the long term optical stability was evaluated by measuring over 4 consecutive months the position of the λmax of the representative LSPR absorption band of the spherical AuNPs fabricated under the optimal experimental conditions. It was revealed that the changes in the λmax were lower than 1%. This indicated that the AuNPs synthesized using the plasma-mediated synthesis method in the studied plasma-reaction systems were highly stable over time.
Conclusions
To the best of our knowledge, the present work shows for the first time the production of stable over time AuNPs in a plasma-reaction system utilizing the APGD fully operated in the surrounding air between a solid pin electrode, which replaced the gaseous jet, and the FLA or the FLC, depending on the polarization of the electrodes. The proposed BDB-RSR approach to the multivariate optimization of the plasma-mediated synthesis of the AuNPs allowed for production of mono-dispersed and spherical nanostructures in a controllable and predictable way. This fully size-controlled synthesis of the AuNPs appears to be crucial in reference to the future use of the resulting nanocolloids of Au in relevant technological or medical applications. The smallest AuNPs, as indicated by the UV-Vis absorption spectrophotometry, DLS and TEM, were obtained using the FLA mode, where the solid pin electrode acted as the cathode and the surface of the solution containing the AuNP precursor was irradiated with high-energy electrons. Nevertheless, in the case of both studied plasma-reaction systems, the size of the AuNPs could easily be tuned within the nanometer range by changing the main parameter settings according to the RSR models developed on the basis of the λmax of the LSPR absorption band.Acknowledgements
AD is thankful to the National Science Centre for financial support (UMO-2015/17/N/ST4/03804). PJ and PP also acknowledge the National Science Centre for funding this work (UMO-2014/13/B/ST4/05013). In addition, this work was financed by a statutory activity subsidy from the Polish Ministry of Science and Higher Education for the Faculty of Chemistry of Wroclaw University of Technology.References
- M. Bouchard, M. Letourneau, C. Sarra-Bournet, M. Laprise-Pelletier, S. Turgeon, P. Chevallier, J. Lagueux, G. Laroche and M.-A. Fortin, Langmuir, 2015, 31, 7633 CrossRef CAS PubMed.
- T. Yan, X. Zhong, A. E. Rider, Y. Liu, S. A. Furman and K. Ostrikov, Chem. Commun., 2014, 50, 3144 RSC.
- C. Richmonds, M. Witzke, B. Bartling, S. W. Lee, J. Wainright, C.-C. Liu and R. M. Sankaran, J. Am. Chem. Soc., 2011, 133, 17582 CrossRef CAS PubMed.
- R. Akolkar and R. M. Sankaran, J. Vac. Sci. Technol., A, 2013, 31, 050811 Search PubMed.
- D. Mariotti and R. M. Sankaran, J. Phys. D: Appl. Phys., 2010, 43, 323001 CrossRef.
- R. Wang, S. Zuo, D. Wu, J. Zhang, W. Zhu, K. H. Becker and J. Fang, Plasma Processes Polym., 2014, 12, 380 CrossRef.
- D. Mariotti, T. Belmonte, J. Benedikt, T. Velusamy, G. Jain and V. Svrcek, Plasma Processes Polym., 2016, 13, 70 CrossRef CAS.
- J. McKenna, J. Patel, S. Mitra, N. Soin, V. Svrcek, P. Maguire and D. Mariotti, Eur. Phys. J.: Appl. Phys., 2011, 56, 24020 CrossRef.
- D. Mariotti, J. Patel, V. Svrcek and P. Maguire, Plasma Processes Polym., 2012, 9, 1074 CrossRef CAS.
- C. Richmonds and R. M. Sankaran, Appl. Phys. Lett., 2008, 93, 131501 CrossRef.
- W.-H. Chiang, C. Richmonds and R. M. Sankaran, Plasma Sources Sci. Technol., 2010, 19, 034011 CrossRef.
- F.-C. Chang, C. Richmonds and R. M. Sankaran, J. Vac. Sci. Technol., A, 2010, 28, L5 CAS.
- J. Patel, L. Nemcova, P. Maguire, W. G. Graham and D. Mariotti, Nanotechnology, 2013, 24, 245604 CrossRef CAS PubMed.
- V. Svrcek, D. Mariotti and M. Kondo, Appl. Phys. Lett., 2010, 97, 161502 CrossRef.
- D. Mariotti, V. Svrcek, J. W. J. Hamilton, M. Schmidt and M. Kondo, Adv. Funct. Mater., 2012, 22, 954 CrossRef CAS.
- X. Z. Huang, X. Zhong, Y. Lu, Y. S. Li, A. E. Rider, S. A. Furman and K. Ostrikov, Nanotechnology, 2013, 24, 095604 CrossRef CAS PubMed.
- Y. L. Thong, O. H. Chin, B. H. Ong and N. M. Huang, Jpn. J. Appl. Phys., 2016, 55, 01AE19 CrossRef.
- F. Tochikubo, N. Shirai and S. Uchida, J. Phys.: Conf. Ser., 2014, 565, 012010 CrossRef.
- F. Tochikubo, Y. Shimokawa, N. Shirai and S. Uchida, Jpn. J. Appl. Phys., 2014, 53, 126201 CrossRef.
- N. Shirai, S. Uchida and F. Tochikubo, Jpn. J. Appl. Phys., 2014, 53, 046202 CrossRef.
- X. Huang, Y. Li and Z. Zhong, Nanoscale Res. Lett., 2014, 9, 572 CrossRef PubMed.
- I. G. Koo, M. S. Lee, J. H. Shim, J. H. Ahn and W. M. Lee, J. Mater. Chem., 2005, 15, 4125 RSC.
- R. Wang, S. Zuo, W. Zhu, J. Zhang and J. Fang, Plasma Processes Polym., 2014, 11, 448 CrossRef CAS.
- R. Wang, S. Zuo, W. Zhu, S. Wu, W. Nian, J. Zhang and J. Fang, Plasma Processes Polym., 2014, 11, 44 CrossRef CAS.
- Q. Chen, J. Li and Y. Li, J. Phys. D: Appl. Phys., 2015, 48, 424006 CrossRef.
- A. Dzimitrowicz, P. Jamroz, K. Greda, P. Nowak, M. Nyk and P. Pohl, J. Nanopart. Res., 2015, 17, 185 CrossRef PubMed.
- A. Dzimitrowicz, T. Lesniewicz, K. Greda, P. Jamroz, M. Nyk and P. Pohl, RSC Adv., 2015, 5, 90534 RSC.
- S. Ghosh, B. Bishop, I. Morrison, R. Akolkar, D. Scherson and R. M. Sankaran, J. Vac. Sci. Technol., A, 2015, 33, 021312 Search PubMed.
- M. A. Bratescu, S.-P. Cho, O. Takai and N. Saito, J. Phys. Chem. C, 2011, 115, 24569 CAS.
- P. Jamroz, K. Greda, P. Pohl and W. Zyrnicki, Plasma Chem. Plasma Process., 2014, 34, 25 CrossRef CAS.
| This journal is © The Royal Society of Chemistry 2016 |