Hierarchical porous carbon materials derived from a waste paper towel with ultrafast and ultrahigh performance for adsorption of tetracycline

Atian Xiea, Jiangdong Daia, Xiang Chena, Jinsong Hea, Zhongshuai Changa, Yongsheng Yan*ab and Chunxiang Li*a
aSchool of Chemistry and Chemical Engineering, Jiangsu University, Zhenjiang 212013, China. E-mail: cjy18252586640@163.com; Fax: +86 0511 88791800; Tel: +86 0511 88790683
bKey Laboratory of Preparation and Applications of Environmental Friendly Materials (Ministry of Education), Jilin Normal University, Siping 136000, China

Received 6th July 2016 , Accepted 18th July 2016

First published on 19th July 2016


Abstract

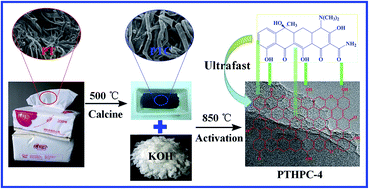
Herein, waste paper towels, a mass garbage product from daily life, were used as precursors for the production of hierarchical porous carbon (PTHPC) via KOH activation to be used for the removal of tetracycline. In this study, the influence of KOH content on porosity and adsorption capacity was investigated, and the optimal property of hierarchical porous carbon was obtained at weight ratios of carbonization: KOH = 1[thin space (1/6-em)]:[thin space (1/6-em)]4 (PTHPC-4). The physico-chemical properties of PTHPC-4 were characterized by different technology. Notably, PTHPC-4 possesses an ultrahigh specific surface area of 3524 m2 g−1 and a large pore volume of 1.839 cm3 g−1. Additionally, the isothermal adsorption results showed that PTHPC-4 displayed an ultrahigh adsorption capacity of 1661.13 mg g−1 for tetracycline, which is superior to other previously reported adsorbents. Moreover, PTHPC-4 also has excellent kinetics performance: when C0 = 100 mg L−1, the pseudo-second-order kinetics constant k2 values at 298, 308 and 318 K are 1.055 × 10⁻², 5.731 × 10⁻² and 8.916 × 10⁻² g mg−1 min−1, respectively, which were 1–3 magnitude higher than previously reported adsorbents. In addition, the investigation of the effect temperature, pH and ionic strength on the adsorption property for tetracycline are included in this study.

1. Introduction

Recently, tremendous efforts have been devoted to improving decontamination techniques for heavy metals, synthetic dyes, aromatic pollutants and antibiotics from water because of their detrimental impacts on the ecological environment and human health.1–3 In particular, antibiotics have been recognized as a new type of pollutant in the aquatic environment as they belong to bio-refractory materials with high biological activity, persistence and bioaccumulation.4 Trace levels of antibiotic residue in the water can continuously accumulate and transfer through the food chain, resulting in adverse effects.5,6 The tetracycline (TC) antibiotic is one of the most widely used antibiotics, as it is broadly applied in the treatment of disease and in feed additives of the livestock industry.7,8 TC is difficult to metabolism in organisms, which has led to a large proportion being excreted into the environment.9,10 A large quantity of TC has been released into water environments in its original and metabolized forms, causing wide spread detection of TC in soils, urban sewage, ground water and drinking water.11 Due to its potential risk for human health and the ecological environment, it is of great significance to develop an efficient treatment method for removal of TC.

We have already made remarkable achievements in the development of TC wastewater treatments.12–17 Although advanced oxidation methods have been employed to treat TC wastewater and have displayed a high efficiency, the tedious operation and high economic cost prevent their practical application.12,13 Considering the advantages of cost-saving, easy operation and lack of secondary product, an adsorption approach provides a feasible alternative for TC removal. Various adsorbents have been adopted to remove TC and have been reported to eliminate TC from aqueous solutions. These include silica,14 metal oxides,15,16 and polymer resins.17 However, such adsorbents suffer from either low adsorption capacities or high economic cost. Therefore, the development of a low cost and highly efficient adsorbent for TC and analogous antibiotics' removal from wastewater has become an inevitable subject for environmental researchers.

Carbon materials are promising adsorbents because they are available and carbon precursors such as coal, wood, shells and so on are cheap.18 Moreover, carbon also possesses a highly porous structure, large specific surface area and excellent surface activity.19 Currently, the issues of resources shortage and environment decline have become increasingly serious. Therefore, adopting abandoned resources as carbon resources to prepare low cost and highly efficient porous carbon adsorbents for TC removal is of great significance. For example, Li et al.20 reported on activated carbon derived from Iris tectorum for removal of TC from aqueous solutions with a maximum monolayer adsorption capability of 769.23 mg g−1. Martins et al.21 prepared NaOH-activated carbon from macadamia nut shells that showed a maximum monolayer adsorption capacity (Qm) of 455.33 mg g−1 for TC. Although the carbon materials derived from abandoned resources have acceptable adsorption performance, the adsorption capacity and kinetics properties still need to be improved.

The paper towel usage amount from catering service industries and daily life has rapidly increased. However, a large extent of waste paper towels (PT) are placed in the landfill or even incinerated. The compositions of PT are mainly cellulose, hemicelluloses and lignin, which can be used as ideal carbon resources for preparation of carbon materials. In a way, PT are renewable biomass materials because they are abundant in nature and exhibit the advantages of easy availability and biodegradable. Thus, preparation of carbon materials using PT as a carbon precursor to remove TC is beneficial for environmental protection and resource conservation.

In the present work, PTHPCs with high specific surface area were prepared from PT for removing TC. The isotherm adsorption and kinetics performances were investigated by batch adsorption experiments. In addition, the effects of test parameters including pH, ionic strength, contact time, and initial concentration of TC on the adsorption of TC by PTHPC-4 were also researched. Moreover, the regeneration experiments showed that the PTHPC-4 exhibited excellent durability and stability. Furthermore, the adsorption mechanism of PTHPC-4 for TC was explored and a reasonable mechanism is proposed. Importantly, this work provides a new prospect for the preparation of advanced adsorbents using biomass materials to remove TC from the water environment. Additionally, we believe the as-prepared PTHPC has great promise not only in wastewater treatment but also in energy storage and catalysis.

2. Experimental

2.1 Materials and chemicals

Tetracycline hydrochloride (TC, 98%) was purchased from Aladdin Industrial Corporation (Shanghai, China) and stored in the dark at 4 °C. High purity nitrogen (99.999%) was purchased from Zhongpu (gas) Company (Zhenjiang, China). NaOH (AR, 96%), NaHCO3 (AR, 99.8%), Na2CO3 (AR, 99.8%), NaCl (AR, 99.5%), KOH (AR, 96%), KBr (AR, 99%) and HCl (AR, 36–38%) were purchased from Sinopharm Chemical Reagent Co., Ltd. (Shanghai, China). Paper towel were obtained from a local supermarket. All chemicals were of analytical purity and used in the experiments directly without any further purification. All solutions were prepared using deionized water.

2.2 Instruments and characterization

The samples for the carbonization and activation process were conducted in a tube furnace (SK-GO6123K, Tianjin, China) with N2 protection. The pHPZC of PTHPC was measured by pH drift method (in ESI). Quantification of the surface functional groups was determined by Boehm titration (in ESI). Elemental composition was done using an element analyzer (FLASH1112A, CE, Italy), the microstructure and morphology of samples were observed by transmission electron microscopy (TEM; JEM-2100, JEOL, Japan) and a field emission scanning electron microscope (EF-SEM; S-4800, Hitachi, Japan). The microstructure and morphology of PTHPC-2 were observed by scanning electron microscope (SEM; S-3400N, Hitachi, Japan). X-ray diffraction (XRD) experiments were conducted on specimens using an X-ray diffractometer (Bruker D8 Advance, Bruker AXS, Germany) operating at 40 kV and 40 mA. Nickel-filtered Cu Kα radiation was used in the incident beam. Raman spectroscopy was examined with a laser Raman spectrometer (DXR, Thermo Fisher, USA). The specific surface area and pore size distribution of the samples were calculated from the N2 adsorption–desorption isotherms at 77 K by multi-point BET and DFT method using a BELSORP instrument (BEL, Japan, Inc.). X-ray photoelectron spectroscopy (XPS) analysis was carried out in a Kratos Axis Ultra DLD spectrometer, using monochromated Al Kα X-rays, at a base pressure of 1 × 10⁻⁹ Torr. Survey scans determined between 1000 and 0 eV revealed the overall elemental compositions of the sample, and regional scans for specific elements were performed. The peak energies were calibrated by placing the major C 1s peak at 284.5 eV. Samples were prepared identically to those of the batch experiments.

2.3 Preparation of PTHPC

A detailed procedure for fabricating PTHPC is described as follows: PT was treated at 500 °C in a tube furnace for 2 h with a heating ramp of 5.0 °C min−1 under ambient N2 to obtain carbonization of PT (PTC). After that, the right amount of PTC was evenly ground with KOH (mass ratio of PTC[thin space (1/6-em)]:[thin space (1/6-em)]KOH = 1[thin space (1/6-em)]:[thin space (1/6-em)]1–5), and, subsequently, the mixture was treated at 850 °C for 1 h with a heating ramp rate of 5.0 °C min−1 under ambient N2. Then, the activation product was soaked in HCl (2 M) to remove impurities (K2CO3 and KOH etc.). The final PTHPC was obtained via vacuum filtration and washed thoroughly with deionized water several times to a neutral pH and dried at 60 °C for 12 h (denoted as PTHPC-x; x represents mass ratio).

2.4 Batch adsorption studies

The batch adsorption experiments were conducted to evaluate the adsorption properties of the PTHPC for adsorption of TC from a water environment. All tests were conducted by adding 2 mg of PTHPC-4 to 10 mL solutions of TC in triplicate under dark conditions. After adsorption equilibrium, a sample of the supernatant was obtained using a 0.45 μm membrane filter to analyze the amount of TC adsorbed onto the PTHPC-4 by a UV-vis spectrophotometer (Agilent Cary 8454 UV-vis) at the maximum absorption wavelength of TC (357 nm).

For isothermal adsorption experiments, the tests were conducted with TC solution initial concentrations ranging from 50 to 350 mg L−1 for 12 h to reach equilibrium at 298, 308 and 318 K. The equilibrium adsorption amount, qe (mg g−1), was obtained according to the following equation:

 
image file: c6ra17286e-t1.tif(1)

The kinetics adsorption of PTHPC-4 was conducted at time intervals of 1 to 90 min using 100, 150 and 200 mg L−1 of TC solutions at 298, 308 and 318 K, respectively. The computational formula of the adsorption amount, qt (mg g−1), at t time was written as:

 
image file: c6ra17286e-t2.tif(2)
where, C0 and Ct (mg L−1) are the beginning and t time concentrations of TC, respectively. Ce (mg L−1) is the equilibrium concentration of TC. V (mL) is the volume of TC aqueous solution, and M (g) is the mass of the adsorbents.

The effects of solution pH and ionic strength on adsorption capacity were also investigated. The 250 mg L−1 TC solutions were adjusted to the required pH (3–8) by 0.1 M NaOH and 0.1 M HCl. The 250 mg L−1 TC solutions with different ionic strengths (0.05, 0.2, 0.5, 1.0, 1.5 and 2.0 M) were prepared by adding NaCl. The above solutions were used for 12 h to reach adsorption equilibrium at 298 K.

In addition, regeneration experiments were carried out to study the stability of the adsorbents. The saturated adsorbents were treated with a NaOH solution (0.2 M) for 24 h at 318 K, and then washed with deionized water until neutralized for reuse. The cyclic adsorption–desorption experiments were continually operated 3 times.

To obtain precise data for the different modules, all of the experimental data were average determinations of triplicate measurements and the relative error is less than 5%.

3. Results and discussion

3.1 Optimization of preparation conditions

Fig. S1 depicts the effect of the KOH ratio on the PTHPC yield. Essentially, PT is a complex material formed from natural polymers (cellulose, lignin, and hemicellulose) and inorganic salts (K, Ca, Na, Mg). In carbonization and activation procedures, these polymeric structures decompose and release most of the non-carbon elements (mainly hydrogen, oxygen) in the form of tars and gases. The existence of KOH during activation promotes dehydration, depolymerization, and redistribution of the constituent polymers, favoring the conversion of aliphatic compounds to aromatic compounds. Fig. S1 shows that the carbon yield decreased with an increasing KOH ratio, indicating the KOH ratio is a critical parameter that affects the carbon yield. Thus, excess KOH will promote gasification of char and increase the total weight loss of carbon.

To optimize the experimental parameters, the impact of KOH content on porosity and adsorption capacity of PTHPC was investigated, and the results are shown in Fig. 1. Fig. 1 shows the BET surface area increases from 1416 to 3524 m2 g−1 as the mass ratio (PTC[thin space (1/6-em)]:[thin space (1/6-em)]KOH) varies from 1[thin space (1/6-em)]:[thin space (1/6-em)]1 to 1[thin space (1/6-em)]:[thin space (1/6-em)]4. However, the BET surface area decreases to 3079 m2 g−1 at a mass ratio (PTC[thin space (1/6-em)]:[thin space (1/6-em)]KOH) of 1[thin space (1/6-em)]:[thin space (1/6-em)]5, indicating the significant influence of KOH content on porosity. Furthermore, the high BET surface area shows excellent adsorption capacity for TC, suggesting the BET surface area plays a key role in the adsorption property of PTHPC. Thus, considering the effects of KOH content on yield and porosity of PTHPC, PTHPC-4 was chosen for a detailed investigation on the physicochemical properties and following adsorption experiments.


image file: c6ra17286e-f1.tif
Fig. 1 Comparison of the adsorption capacity and BET surface area for different mass ratios.

3.2 Characterizations

The morphological features of PT, PTC and PTHPC-4 were observed by SEM. From Fig. 2a and b, it can be clearly seen the PT consist of interlaced nano-fibers and noodles with relatively smooth surfaces. Fig. 2c and d of PTC show that the nano-fibers and noodles have the same original morphological structure after carbonization, but the stacking of the fibers is no longer close. Remarkably, a layered structure appears on the surface of the fibers, resulting in a rough surface. The SEM images (Fig. 2e and f) of PTHPC-4 show the fibers are broken into small pieces creating a harsh surface, implying a significant change in the morphology after the activation process. In order to compare with PTHPC-4, the SEM images of PTHPC-2 are given in Fig. S2. From Fig. S2a, it can be seen that the ribbon fibers also broke into small pieces, which is consistent with the SEM images of PTHPC-4. However, the surface of the fibers is smoother than PTHPC-4, as shown in Fig. S2b. The result indicates that the amount of KOH is crucial for the preparation of porous carbon. The microstructures of PTHPC-2 and PTHPC-4 were also studied by TEM. The TEM images of PTHPC-2 (Fig. 3a) and PTHPC-4 (Fig. 3c) show that the carbon remains a massive body. Interestingly, PTHPC-2 (Fig. 3b) shows an uneven surface, indicating the surface of PTHPC-2 is partially etched by KOH. PTHPC-4 (Fig. 3d) shows a porous structure, which indicates regeneration of a large amount of microporous surface area after KOH activation (mass ratio of PTC[thin space (1/6-em)]:[thin space (1/6-em)]KOH = 1[thin space (1/6-em)]:[thin space (1/6-em)]4).
image file: c6ra17286e-f2.tif
Fig. 2 SEM images of PT (a and b), PTC (c and d) and PTHPC-4 (e and f).

image file: c6ra17286e-f3.tif
Fig. 3 TEM images of PTHPC-2 (a and b) and PTHPC-4 (c and d) at different magnifications.

The lattice structures of PTC and PTHPC-4 were characterized with the XRD technique. The XRD patterns of PTC and PTHPC-4 are recorded in Fig. 4. From the pattern of PTHPC-4, a very wide and weak intensity diffraction peak can be seen in the 2θ = 26.2° location, indicating the presence of amorphous carbon in PTHPC-4. Meanwhile, another broad and weak peak appears at 2θ = 43.1°, which is ascribed to the diffraction peaks of the graphitization structure from the (100) and (101) crystal surface.22 However, the pattern of PTC just has one feature band at 2θ = 28° corresponding to the (002) crystal plane, indicating the presence of amorphous carbon.22 The results show the as-prepared PTHPC-4 possesses a large amount of the amorphous carbon structure but also has a certain graphitization structure.


image file: c6ra17286e-f4.tif
Fig. 4 XRD pattern of PTC and PTHPC-4.

The crystallization degree of PTC and PTHPC-4 was tested by Raman spectroscopy. The Raman spectra of PTC and PTHPC-4 are shown in Fig. 5. The Raman spectra displays two prominent peaks at around 1357 and 1587 cm−1, indicating the coexistence of graphite and disordered amorphous carbon in the samples.23 The graphitization degree of the samples was evaluated qualitatively based on the intensity ratio of the D and G bands (ID/IG). In order to better study the structural properties of PTC and PTHPC-4, the Raman spectra of PTC and PTHPC-4 were deconvoluted into four peaks located at 1163, 1332, 1499 and 1590 cm−1, which were identified as D4, D1, D3 and G bands, respectively. The disordered graphitic carbon is represented by the D1 and D4 bands, the D3 band indicates amorphous carbon and the G band represents ideal graphitic sp2 carbon.24 The detailed percentages of the carbon species are shown in Table S1. From Table S1, it can be seen that the percentage of amorphous carbon is reduced after activation, whereas the percentage of disordered graphitic carbon apparently is increased. Simultaneously, ideal graphitic sp2 carbon decreases after the activation reaction. The results clearly indicated the activation process causes a higher percentage of graphitic carbon. However, the carbon layer is destroyed due to regeneration of the porous structure during the activation reaction, which leads to a decreased percentage of ideal graphitic sp2 carbon.


image file: c6ra17286e-f5.tif
Fig. 5 The Raman spectra of PTC (a) and PTHPC-4 (b).

The elemental compositions of PT, PTC and PTHPC-4 were briefly analyzed by an element analyzer, and the results are shown in Table S2. We can see the oxygen content has decreased but is still more than 6% after activation, suggesting the presence of oxygen containing functional groups. The elemental compositions of PTC and PTHPC-4 were further evaluated by XPS analysis. Fig. S3 gives the wide survey scan of the XPS spectra in the 200–600 eV range presenting a predominant C 1s peak (284.5 eV) and O 1s peak (532.0 eV). The high-resolution C 1s and O 1s XPS spectra are presented in Fig. 6. The C 1s spectrum (Fig. 6a and c) was deconvoluted into three peaks at 284.4, 284.83, and 286.4 eV corresponding to C–C, C[double bond, length as m-dash]C, C–O and C[double bond, length as m-dash]O bonds, respectively.25–27 In the O 1s spectrum (Fig. 6b and d), the peaks at 531.2, 532.4, and 533.7 eV correspond to C[double bond, length as m-dash]O, H–O, and C–O–C bonds, respectively.28,29 The results indicated that the types of functional groups did not change, but the proportion slightly changed after activation. The quantitative percentages of the functional groups are given in Table 1. The results indicated abundant oxygen-containing groups exist in PTHPC-4 and proved the speculation based on element analysis.


image file: c6ra17286e-f6.tif
Fig. 6 XPS spectra of PTC (a and b) and PTHPC-4 (c and d).
Table 1 Functional group percentages in PTC and PTHPC-4
Samples Carbon content (%) Oxide content (%)
C[double bond, length as m-dash]C, 284.4 eV C–C, 285.0 eV C–O, 286.2 eV C[double bond, length as m-dash]O, 288.0 eV O[double bond, length as m-dash]C, 531.2 eV C–OH, 532.4 eV C–O–C, 533.7 eV
PTC 71.15 19.05 4.29 5.51 4.92 70.45 24.63
PTHPC-4 69.93 19.81 5.57 4.70 24.43 70.72 4.85


The textural properties of PTHPC were evaluated by N2 adsorption–desorption isotherms. Fig. 7a shows the N2 adsorption–desorption isotherms of PTHPC. According to the results, the isotherms show a combination of type I and type IV, which is characteristic of microporous and mesoporous materials.30 Also, the isotherms show a capillary condensation step, indicating the presence of mesoporous structures. The porosity characteristics of PTHPC at different parameters are listed in Table 2. The increase in the KOH ratio led to an increase in the specific surface area values for PTHPC. The BET surface areas of PTHPC-1, PTHPC-2, PTHPC-3, PTHPC-4 and PTHPC-5 are 1416, 2041, 2961, 3524 and 3079 m2 g−1, respectively. Fig. 7b shows the pore size distribution that was calculated by a DFT method. The pore size distribution analysis reveals the presence of mesopores and micropores. Additionally, as shown in Table 2, the increase in the KOH ratio caused an increase in the total pore volume of PTHPC from 0.736 to 1.898 cm3 g−1. Interestingly, the average pore size of PTHPC shows a trend of first a decrease and then an increase. With an increase in the KOH ratio, the amount of micropores gradually increased, which will inevitably lead to a decrease in the average pore size. However, the average pore size increased in PTHPC-4, which may be due to a gradual transformation of microporous to mesoporous. Correspondingly, the average pore size of PTHPC-5 reaches 2.465 nm. A gradual increase in pore volume (from 0.736 to 1.898 cm3 g−1) confirms this inference. Intrinsically, the chemical reaction between KOH and carbon atoms causes the difference in porosity characteristics. The activation mechanism of KOH normally includes independent hydroxide and redox processes during the reaction. The detailed chemical reaction process is as follows:31

6KOH + C ↔ 2K + 3H2 + 2K2CO3 (T > 400 °C)

K2CO3 + C ↔ K2O + 2CO (T > 700 °C)

K2CO3 ↔ K2O + CO (T > 700 °C)

2K + CO2 ↔ K2O + CO (T > 700 °C)

K2O + C ↔ 2K + CO (T > 800 °C)


image file: c6ra17286e-f7.tif
Fig. 7 (a) N2 adsorption–desorption isotherms and (b) pore-size-distribution curves of PTHPC.
Table 2 The porosity characteristics of PTHPC obtained at different parametersa
Samples SBET (m2 g−1) Smicro (m2 g−1) Smicro/SBET (%) VP (cm3 g−1) Vmicro (cm3 g−1) Vmicro/VP (%) daver (nm)
a SBET = specific surface area, Smicro = micropore surface area, VP = total pore volume, Vmicro = micropore volume, daver = average pore size.
PTHPC-1 1416 1148 81.07 0.736 0.454 61.68 2.078
PTHPC-2 2041 1749 85.69 1.026 0.725 70.66 2.011
PTHPC-3 2961 2566 86.66 1.362 1.087 79.81 1.830
PTHPC-4 3524 3162 89.73 1.839 1.503 81.73 2.074
PTHPC-5 3079 2211 71.81 1.898 1.244 65.54 2.465


The chemical reaction between a proper quantity of KOH and carbon atoms tends to mainly produce microporous surfaces causing an increase in microporosity. However, an excessive reaction occurs with a KOH overdose, leading to an increase in pore volume, which makes the change from microporous to small mesoporous. Thus, the KOH content in activation synthetic processes can be said to be crucial for highly porous PTHPC.

3.3 Surface composition of the carbons

The acidity and basicity of carbon material surfaces basically determines their surface composition. The presence of surface functional groups (e.g. carboxyl, lactone, phenol, carboxylic anhydride, etc.) has been considered as the source of surface acidity. However, the basicity of carbon materials is attributed to the presence of pyrone, chromene and carbonyl structures and oxygen free Lewis basic sites. The quantitative surface composition of PTHPC is shown in Table 3, indicating PTHPC consists of acidic and basic functional groups. An example of the point of zero charge (pHPZC) determination for PTHPC, e.g. PTHPC-4, is shown in Fig. S4. The results indicated our carbons exhibit low pHPZC values in the range of 3.0–3.1. Thus, our carbon materials display negative surfaces for pH values higher than the pHPZC and positive surfaces for pH values less than the pHPZC. Furthermore, Boehm titration results are also listed in Table 3, and they show the dominance of acidic groups on the surface of the PTHPC. The Boehm titration results are consistent with low pHPZC values. From Table 3, we can see that increasing the KOH ratio increases the amount of acidic groups and reduces the basic groups of PTHPC. These oxygen-containing functional groups are very crucial for adsorption because they act as active sites capable of interacting with other molecules.
Table 3 Content of surface functional groups in PTHPC determined by Boehm method
Samples pHPZC Acid, mmol g−1 Basic, mmol g−1 Carboxyl, mmol g−1 Phenol, mmol g−1 Total, mmol g−1
PTHPC-1 3.1 1.650 0.824 0.809 0.841 2.474
PTHPC-2 3.1 1.656 0.806 0.812 0.844 2.462
PTHPC-3 3 1.678 0.758 0.827 0.851 2.436
PTHPC-4 3 1.682 0.727 0.828 0.854 2.409
PTHPC-5 3 1.685 0.723 0.831 0.854 2.408


3.4 Adsorption isotherms

To better understand the interaction between PTHPC-4 and TC, static isothermal adsorption experiments were conducted at different temperatures. As shown in Fig. 8a, the adsorption capacity of TC onto PTHPC-4 increased with increasing solution initial concentration and gradually reached equilibrium. Meanwhile, the appropriate temperature improved adsorption capacity from 1329.98 to 1648.71 mg g−1, indicating the excellent adsorption affinity of PTHPC-4 for TC. Moreover, the isothermal adsorption data was analyzed by Langmuir and Freundlich isotherm models.
image file: c6ra17286e-f8.tif
Fig. 8 The fitted adsorption isotherms of tetracycline on porous carbon materials at different temperatures (a) and plot of ln[thin space (1/6-em)]K0 vs. 1/T (b).

The Langmuir isotherm adsorption model hypothesis believes that the adsorption process of the adsorbent is monolayer adsorption without any interaction of molecules, and the linear equations is as follows:32

 
image file: c6ra17286e-t3.tif(3)
where qm (mg g−1) and KL (L mg−1) are the theoretical monolayer adsorption capacity and Langmuir constant, respectively.

Furthermore, the Freundlich isothermal adsorption model assumes that the adsorption process is a multilayer adsorption, and the linear equation is as follows:33

 
image file: c6ra17286e-t4.tif(4)
where KF (mg g−1) (L mg−1)1/n and n represent the Freundlich constant related to adsorption capacity and adsorption intensity, respectively.

The fitting curves of the Langmuir and Freundlich isotherm models for TC adsorbing onto PTHPC-4 at different temperatures are shown in Fig. 8a, and the relative parameters are listed in Table 4. The Langmuir model shows higher correlation coefficients (>0.998) as compared with the Freundlich isotherm model (<0.90). Moreover, the values calculated (qe) by the Langmuir model matched well with the experimental values (qe,exp), indicating that the adsorption data can be well described by the Langmuir model. The above results verified that the PTHPC-4 possessed a homogeneous surface, and monolayer adsorption played a dominant role in the adsorption process of TC. From Table 4, we can easily find that the maximum monolayer adsorption amounts (qm) of TC are 1358.70, 1536.10 and 1661.13 mg g−1 at 298, 308 and 318 K, respectively. The adsorption capacity of PTHPC-4 is higher than other adsorbents20,21,34–40 (listed in Table 5), suggesting the as-prepared PTHPC-4 possesses a high adsorption capacity for TC from water environments. Its high specific surface area and large pore volume allow for its excellent adsorption capacity.

Table 4 Langmuir, Freundlich isotherm parameters
T (K) qe,exp (mg g−1) Langmuir isotherm model Freundlich isotherm model
KL (L mg−1) qm (mg g−1) R2 RL × 10−2 KF (mg g−1)(L mg−1)1/n l/n R2
298 1329.98 0.8279 1358.70 0.9989 2.358–0.344 558.85 0.2621 0.847
308 1537.12 1.813 1536.10 0.9985 1.091–0.157 834.12 0.2026 0.615
318 1648.71 2.213 1661.13 0.9986 0.896–0.129 915.19 0.2649 0.697


Table 5 Comparison of the adsorption capacities of various adsorbents for TC
Adsorbents SBET (m2 g−1) VP (cm3 g−1) T (K) Qm (mg g−1) Ref.
ITAC-Fe 1371 0.917 295 ± 1 769.23 20
ACM 1524 0.826 298 455.33 21
Diatomite 318 303.03 34
Graphene oxide 298 313 35
Activated carbon fiber 1153 0.4925 298 339 36
Bio-char 118 0.073 303 58.80 37
Magnetic resin (Q100) 298 429.70 38
Sludge-derived materials 139 0.06 298 672.00 39
Commercial activated carbon 1301 0.42 471.10
MWCNTs 1839 1.92 293 269.50 40
PTHPC-4 3524 1.839 298 1358.70 In this work
308 1536.10
318 1661.13


The essential characteristics of the Langmuir isotherm can be expressed based on the a dimensionless constant separation factor, RL, and the equation is defined as follows:41

 
image file: c6ra17286e-t5.tif(5)
where, KL (L mg−1) is the Langmuir constant and C0 (mg L−1) is the initial TC concentration. The RL value indicates the shape of the isotherm as follows:
RL value Shape of the isotherm
RL > 1 Unfavorable
RL = 1 Linear
0 < RL < 1 Favorable
RL = 0 Irreversible

The calculated values of RL at different temperatures are included in Table 4. All RL values obtained are in the range of 0.00129–0.02358, indicating the favorable adsorption of TC onto PTHPC-4. The results indicated the Langmuir model can describe the equilibrium isotherms well, and the adsorption process is a monolayer adsorption. TC is homogeneously distributed over the surface of PTHPC-4.

3.5 Thermodynamics analysis

The analysis of thermodynamic properties is important to investigate the adsorption behavior and mechanism. Thus, TC adsorption onto PTHPC-4 was tested at 298, 308 and 318 K. The thermodynamic parameters such as the standard enthalpy change (ΔHθ), Gibbs free energy (ΔGθ) and standard entropy change (ΔSθ) were calculated according to the following two formulas:42
 
ΔGθ = −RT[thin space (1/6-em)]ln[thin space (1/6-em)]K0 (6)
 
image file: c6ra17286e-t6.tif(7)
where R is the universal gas constant (8.314 J mol−1 K−1) and T (K) is the temperature in kelvin. The values of ΔHθ and ΔSθ can be evaluated from the intercept and slope of the linear plots of ln[thin space (1/6-em)]K0 vs. 1/T (Fig. 8b), respectively. When the TC concentration in the aqueous solution gradually decreases and approaches zero, the thermodynamics equilibrium constant K0 can be obtained by plotting ln(qs/Cs) vs. qs. The qs (mmol g−1) is the amount of TC adsorbed per unit gram of the adsorbent, and Cs (mmol mL−1) is the equilibrium concentration of TC.43 The calculated values of the relative thermodynamic parameters are given in Table 6. Table 6 displays the thermodynamic parameters, which show negative ΔGθ, positive ΔHθ and ΔSθ, indicating that the reaction at the solid–liquid interface in the adsorption process is spontaneous and endothermic and increases randomness.43 As we known, the adsorption heat of physisorption is between 0 and 40 kJ mol−1 and the chemisorption heat is in the range from 40 to 418.4 kJ mol−1. Thus, we can infer that physisorption may dominate the adsorption of TC onto the adsorbent from the ΔHθ result.
Table 6 Thermodynamic parameters for TC adsorption onto PTHPC-4
T (K) K0 ΔGθ (kJ mol−1) ΔHθ (kJ mol−1) ΔSθ (kJ mol−1 K−1)
298 15.48 −6.787 5.481 0.041
308 16.66 −7.203
318 17.79 −7.611


3.6 Adsorption kinetics

To better understand the adsorption behaviors, kinetics adsorption experiments were conducted, and the results are given in Fig. 9. As shown in Fig. 9a, the adsorption of TC onto PTHPC-4 happened quickly during the initial period (within 5 min) owing to a large number of available adsorption sites on PTHPC-4. Then, with an increase in contact time (5 to 30 min), the adsorption rate gradually slows. The result shows this phenomenon may be caused by increasing repulsive forces between the adsorbed TC molecules on the PTHPC-4 and adsorbate molecules in the bulk solution. More importantly, the adsorption reaches equilibrium within approximately 30 min, showing the ultrafast kinetics property of PTHPC-4. The enlarged view (Fig. 9b) of the kinetics curve shows the ultrafast kinetics property. We also found that the adsorption capacity increased with an increase in the solution initial concentration. The higher initial concentration with a larger driving force can overcome the mass transfer resistance for TC molecules from liquid phase to solid phase. In addition, the increasing contact temperature enhanced the adsorption capacity, indicating that the adsorption procedure is an endothermic reaction.
image file: c6ra17286e-f9.tif
Fig. 9 Kinetics curves (a), magnified view of kinetics curves (b), the linear-fitting kinetics curves by pseudo-second-order (c) and intra-particle diffusion model (d) for TC adsorption onto PTHPC-4 at 298 (A), 308 (B) and 318 K (C).

In order to further study the adsorption behavior, the kinetics adsorption experiments data were analyzed by pseudo-first-order and pseudo-second-order models. The pseudo-first-order model and pseudo-second-order model linear equations correspond to the following:44,45

 
ln(qeqt) = ln[thin space (1/6-em)]qek1t (8)
 
image file: c6ra17286e-t7.tif(9)
where qe and qt are the amount of TC adsorbed (mg g−1) at equilibrium and time t (min), respectively. k1 (min−1) is the rate constant of the pseudo first-order kinetic model, and k2 (g mg−1 min−1) is the rate constant of the pseudo second-order kinetic model.

The fitting line of the pseudo-second-order model is shown in Fig. 9c (linear fitting by pseudo-first-order model is not given), and the kinetic parameters are given in Table 7. It is easy to see that all the correlation coefficients (>0.999) of the pseudo-second-order model were larger than the pseudo-first-order models' under the same conditions (initial concentration, contact temperature). Moreover, all the values (qe,cal) calculated from the pseudo-second-order model were closer to the experimental values (qe,exp). The results show that the pseudo-second-order model can better describe the adsorption behavior of TC onto the surface of the adsorbents. As we know, the rate constant represents the kinetics property of the adsorbents. From the values of k2 in Table 7, we find that increasing the contact temperature could enhance the dynamics and increase the chance of collision between the TC molecules and PTHPC-4 under the same initial TC concentration, which can accelerate the adsorption rate. Besides, at the same temperature, the achievement of an adsorption equilibrium will take longer for a higher initial TC concentration, and the decreasing kinetics constant, k2, corresponds well with the result.

Table 7 Kinetic parameters for pseudo-first-order and pseudo-second-order models
C0 (mg L−1) qe,exp (mg g−1) T (K) Pseudo-first-order model Pseudo-second-order model
qe (mg g−1) k1 (min−1) R2 qe (mg g−1) k2 × 10−3 (g mg−1 min−1) R2
100 479.83 298 32.96 0.085 0.849 499.5 10.55 0.9999
499.38 308 6.521 0.076 0.980 499.25 57.31 0.9999
499.18 318 2.707 0.068 0.964 499.38 89.16 0.9999
150 745.83 298 33.17 0.059 0.961 749.63 7.35 0.9999
748.78 308 15.85 0.04 0.966 749.06 12.66 0.9999
749.08 318 8.61 0.03 0.905 748.50 26.60 0.9999
200 978.21 298 250 0.054 0.981 998.01 0.81 0.9994
998.48 308 72.10 0.016 0.914 981.35 2.65 0.9998
998.63 318 43.25 0.024 0.925 993.25 4.62 0.9999


The kinetics property of adsorbents is crucial for practical application. Fast kinetics properties can make adsorption reach equilibrium in a short time, providing a possibility for large-scale application. The as-prepared PTHPC-4 exhibits an ultrafast kinetics property, and the comparison of the kinetics constant, k2, of various adsorbents35–38,46 for TC are shown in Table 8. As shown in Table 8, the k2 values of PTHPC-4 are about 1 to 3 orders of magnitude higher than the other adsorbents, meaning the kinetics property is well above other adsorbents. We analyzed and speculated that the main reasons for the ultrafast adsorption rate are the following aspects: (1) high specific surface area and large pore volume; (2) micropores and mesopores in favor of the molecular transport; and (3) the relatively hydrophilic surface of PTHPC-4 (static water contact angle of 84.2 °C, see Fig. S5) is conducive to fast and effective water contact. Thus, PTHPC-4 has great potential for removal of contaminates.

Table 8 Comparison of the kinetics constant k2 of various adsorbents for TC
Adsorbents C0 (mg L−1) T (K) k1 (min−1) k2 (g mg−1 min−1) Ref.
Graphene oxide 166.67 298 1.083 × 10⁻³ 35
Activated carbon fiber 250 293 ± 1 0.0095 3.306 × 10⁻⁴ 36
350 0.0049 1.353 × 10⁻⁴
450 0.0067 1.268 × 10⁻⁴
Raw bio-chars 303 0.000168 0.903 × 10⁻⁵ 37
Acid treated bio-chars 0.000228 0.537 × 10⁻⁵
Alkali treated bio-chars 0.00145 0.738 × 10⁻⁵
Magnetic resin (Q100) 150 303 0.025 1.800 × 10⁻⁴ 38
SWy-2 1000 298 7.500 × 10⁻⁴ 46
SAz-1 2.500 × 10⁻⁴
PTHPC-4 100 298 0.085 1.055 × 10⁻² In this work
308 0.081 5.731 × 10⁻²
318 0.072 8.916 × 10⁻²


The adsorption kinetics data was further analyzed using an intra-particle diffusion model. The intra-particle mass transfer diffusion model proposed by Weber and Morris can be written as follows:47

 
qt = Kit1/2 + C (10)
where qt (mg g−1) is the adsorption amount at different intervals, C (mg g−1) is the intercept and Ki (mg g−1 min−0.5) is the intra-particle diffusion rate constant of the adsorption step.

According to the model, the intra-particle diffusion is the adsorption rate limiting step of the entire adsorption process if the plots of qt vs. t1/2 produce a straight line through the origin. The fitting lines of the intra-particle diffusion model at various initial TC concentrations and contact temperatures are shown in Fig. 9d. The plots of qt vs. t1/2 show a piecewise-linear pattern with two slopes, indicating two steps occur in the adsorption process. The values of Ki and C calculated according to the slope and intercept are given in Table S3. Fig. 9d shows the large slope that indicates the fast removal rate of TC at an early stage due to the instantaneous availability of the ultrahigh surface area and active adsorption sites. However, the subdued portion means a low removal rate, the diffusion of relatively low TC residuals takes a long time into the mesoporous and microporous. The second stage is not through the origin, demonstrating the intra-particle diffusion is not the only rate-limiting step and a complex chemical reaction or chemical redox reaction might be involved.

To demonstrate the activity of the adsorption of TC onto PTHPC-4, the changes in the adsorption spectra for TC using different initial TC concentrations are shown in Fig. 10. It is clear the intensity of the strong adsorption peak at 357 nm for the TC solution rapidly decreases and disappears within 90 min, indicating the TC molecule has been almost completely adsorbed. Additionally, Fig. 10d shows the color of the initial TC concentration of 200 mg L−1 changed from pale yellow to colorless after 30 min. The above results further indicate the ultrafast kinetics property of PTHPC-4.


image file: c6ra17286e-f10.tif
Fig. 10 (a–c) UV-visible absorption spectra of the TC solutions (C0 = 100, 150, 200 mg L−1) at different adsorption times, (d) comparison of the original color and after 30 min (C0 = 200 mg L−1, T = 298 K).

3.7 Effect of ionic strength

Ionic strength influences not only the adsorption thermodynamics but also the adsorption kinetics. The effects of ionic strength (NaCl concentration) on TC adsorption onto the absorbents were investigated, and the results are shown in Fig. 11a. The adsorption capacity gradually reduced with the augmentation of the ionic strength. However, the adsorption amount reached a stable value when the NaCl concentration was above 1.5 M, which may be because the addition of the electrolyte compresses the thickness of the electric double layer and weakens the electrostatic interaction between adsorbates and adsorbents. Therefore, the adsorption process may partially involve electrostatic interactions.
image file: c6ra17286e-f11.tif
Fig. 11 (a) Effect of ionic strength and (b) pH values on TC adsorption onto PTHPC-4 (TC concentration = 250 mg L−1, adsorbents concentration = 200 mg L−1).

3.8 Effect of pH

TC adsorption onto PTHPC-4 in solutions with different pH values (3 to 8) was investigated, and the results are given in Fig. 11b. The influences of solution pH on adsorption are mainly by changing the surface charge of the adsorbents and adsorbates, which has a strong influence on the electrostatic interaction between adsorbents and adsorbates. It is well known that the TC molecule shows multiple ionizable functional groups at different pH values, and its predominant species are TC+ (pH < 3.3), TC0 (3.3 < pH < 7.7), TC (7.7 < pH < 9.69) and TC2− (pH > 9.69).48 The solution pH affects the surface properties of the adsorbents and the chemical form of mass transfer in solution. The electrostatic interaction occurs between the predominant species, TC+, and oxygen containing functional groups on PTHPC-4 (corresponding with the results of the Boehm titration). Also, the low pHPZC (3.0–3.1) values of PTHPC display negative surfaces for pH values higher than pHPZC. As shown in Fig. 11b, PTHPC-4 exhibits the best adsorption capacity at pH = 3 but retains its excellent adsorption property at pH < 7 values. However, the adsorption capacity decreased rapidly at pH ≥ 7, which may be due to the enhanced electrostatic repulsion between TC with negative charge and negative surfaces of PTHPC-4. The results suggested the adsorption of TC onto PTHPC-4 partially includes electrostatic interactions and might involve other reactions.

3.9 Recyclability of PTHPC-4

The regeneration capacity of adsorbents is crucial for practical application. Hence, adsorption–desorption tests were performed to study the recyclability of PTHPC-4. Briefly, saturated PTHPC-4 was treated by NaOH solution (0.2 M) at 318 K and washed with deionized water several times to neutral for reusing. The experiments lasted 3 cycles, and the results are shown in Fig. 12. As shown in Fig. 12, the regenerated PTHPC-4 still retains an excellent adsorption capacity of 9402.35 mg g−1 after 3 cycles. This demonstrated PTHPC-4 has good reusability for the removal of TC from aqueous solution. Moreover, PTHPC-4 has great promise as a highly efficient and environmental friendly adsorbent for removal of other contaminants in practical applications.
image file: c6ra17286e-f12.tif
Fig. 12 Regeneration of PTHPC-4.

3.10 Proposed adsorption mechanism

Adsorption is a complex process including physical and chemical interactions. Normally, the physico-chemical properties of adsorbents and mass-transfer form in the liquid phase have a great impact on the adsorption mechanism. TC molecules with a strong electron-withdrawing ability from the conjugated enone structures can act as π-electron acceptors; therefore, π–π EDA interactions may occur between TC molecules and graphite-like sheets (π-electron-donors), which was confirmed by XRD and Raman results. More importantly, the graphite-like surface can also provide a strong van der Waals force.49 Also, TC can effectively interact with PTHPC-4 via cation-π bonding between the protonated amino groups and graphite π-electrons. Additionally, considering PTHPC-4 has polar functional groups (Table 3), hydrogen bonding is a possible mechanism for the adsorption of TC on PTHPC-4, such as hydrogen bonding between the phenolic proton or carboxylic group on PTHPC-4 and electronegative species in antibiotics. The Ph–OH or –COOH proton could form an attractive interaction with the oxygen of the protonated or deprotonated carbonyl and carboxylate functional groups via hydrogen bonding. Also, the electrostatic interactions are also important because of the negative surface charge (pH > pHPZC, Table 3) of PTHPC-4 and the presence of charged species. Notably, the high BET surface area greatly contributes to TC adsorbing onto PTHPC-4 and provides a large number of sites for the above-mentioned interaction. In a word, the adsorption process of TC onto carbon materials involves complicated physical and chemical processes. Thus, the mechanisms of adsorption require a further in-depth study.

4. Conclusions

In conclusion, an excellent adsorbent was prepared using carbonized PT as the carbon precursor in the presence of different amounts of KOH. The physico-chemical properties of the resultant materials were analyzed by various characterization techniques. The results of the adsorption experiments indicated PTHPC-4 has an excellent adsorption capacity (1661.13 mg g−1 at 318 K) for TC, which attributed to its high porosity, abundant functional groups and large BET surface area. Moreover, PTHPC-4 exhibits an ultrafast kinetics property, demonstrated by the kinetics constant k2 values. In addition, the large BET surface area and pore volume are conducive to the TC molecular mass transfer process and could be responsible for the ultrafast kinetics property. Also, the regeneration experiments indicated the reusability of PTHPC-4. We believe the as-prepared PTHPC can serve as an excellent, cost-saving adsorbent for efficient and fast removal of TC or other organic pollutants from water environments.

Acknowledgements

This work was financially supported by the National Natural Science Foundation of China (No. 21277063 and 21407058, 21446015, 21546013, U1510126), the National Basic Research Program of China (973 Program, 2012CB821500), Natural Science Foundation of Jiangsu Province (BK20140534), Research Fund for the Doctoral Program of Higher Education of China (20133227110022 and 20133227110010) and Jiangsu Planned Projects for Postdoctoral Research Funds (1102119C).

References

  1. F. He, W. Wang, J. W. Moon, J. Howe, E. M. Pierce and L. Y. Liang, Rapid removal of Hg(II) from aqueous solutions using thiol-functionalized Zn-doped biomagnetite particles, ACS Appl. Mater. Interfaces, 2012, 4, 4373–4379 CAS.
  2. C. Y. Cao, J. Qu, W. S. Yan, J. F. Zhu, Z. Y. Wu and W. G. Song, Low-cost synthesis of flowerlike α-Fe2O3 nanostructures for heavy metal ion removal: adsorption property and mechanism, Langmuir, 2012, 28, 4573–4579 CrossRef CAS PubMed.
  3. C. L. Warner, W. Chouyyok, K. E. Mackie, D. Neiner, L. V. Saraf, T. C. Droubay, M. G. Warner and R. S. Addleman, Manganese doping of magnetic iron oxide nanoparticles: tailoring surface reactivity for a regenerable heavy metal sorbent, Langmuir, 2012, 28, 3931–3937 CrossRef CAS PubMed.
  4. H. Chen and M. Zhang, Effects of advanced treatment systems on the removal of antibiotic resistance genes in wastewater treatment plants from Hangzhou, China, Environ. Sci. Technol., 2013, 47, 8157–8163 CAS.
  5. H. Y. Done and R. U. Halden, Reconnaissance of 47 antibiotics and associated microbial risks in seafood sold in the United States, J. Hazard. Mater., 2015, 282, 10–17 CrossRef CAS PubMed.
  6. S. Rodriguez-Mozaz, S. Chamorro, E. Marti, B. Huerta, M. Gros, A. Sanchez-Melsio, C. M. Borrego, D. Barcelo and J. L. Balcazar, Occurrence of antibiotics and antibiotic resistance genes in hospital and urban wastewaters and their impact on the receiving river, Water Res., 2015, 69, 234–242 CrossRef CAS PubMed.
  7. M. S. Price, J. J. Classen and G. A. Payne, Aspergillus niger absorbs copper and zinc from swine wastewater, Bioresour. Technol., 2001, 77, 41–49 CrossRef CAS PubMed.
  8. T. Zhang, M. Wang, W. Yang, Y. Zhen, Y. Wang and Z. Gu, Synergistic removal of copper(II) and tetracycline from water using an environmentally friendly chitosan-based flocculant, Ind. Eng. Chem. Res., 2014, 53, 14913–14920 CrossRef CAS.
  9. R. Daghrir and P. Drogui, Tetracycline antibiotics in the environment: a review, Environ. Chem. Lett., 2013, 11, 209–227 CrossRef CAS.
  10. Q. Zhou, M. Zhang, C. Shuang, Z. Li and A. Li, Preparation of a novel magnetic powder resin for the rapid removal of tetracycline in the aquatic environment, Chin. Chem. Lett., 2012, 23, 745–748 CrossRef CAS.
  11. Y. Gao, Y. Li, L. Zhang, H. Huang, J. J. Hu, S. M. Shah and X. G. Su, Adsorption and removal of tetracycline antibiotics from aqueous solution by graphene oxide, J. Colloid Interface Sci., 2012, 368, 540–546 CrossRef CAS PubMed.
  12. N. Oturan, J. Wu, H. Zhang, V. K. Sharma and M. A. Oturan, Electrocatalytic destruction of the antibiotic tetracycline in aqueous medium by electrochemical advanced oxidation processes: effect of electrode materials, Appl. Catal., B, 2013, 140–141, 92–97 CrossRef CAS.
  13. J. Joonseon, S. Weihua, W. J. Cooper, J. Jinyoung and G. John, Degradation of tetracycline antibiotics: mechanisms and kinetic studies for advanced oxidation/reduction processes, Chemosphere, 2010, 78, 533–540 CrossRef PubMed.
  14. E. Repo, J. K. Warchol, A. Bhatnagar and M. Sillanpaa, Heavy metals adsorption by novel EDTA-modified chitosan–silica hybrid materials, J. Colloid Interface Sci., 2011, 358, 261–267 CrossRef CAS PubMed.
  15. C. Y. Cao, J. Qu, F. Wei, H. Liu and W. G. Song, Superb adsorption capacity and mechanism of flowerlike magnesium oxide nanostructures for lead and cadmium ions, ACS Appl. Mater. Interfaces, 2012, 4, 4283–4287 CAS.
  16. T. Zhai, S. L. Xie, X. H. Lu, L. Xiang, M. H. Yu, W. Li, C. L. Liang, C. H. Mo, F. Zeng, T. G. Luan and Y. X. Tong, Porous Pr(OH)3 nanostructures as high-efficiency adsorbents for dye removal, Langmuir, 2012, 28, 11078–11085 CrossRef CAS PubMed.
  17. Y. Zhang, Y. F. Li, L. Q. Yang, X. J. Ma, L. Y. Wang and Z. F. Ye, Characterization and adsorption mechanism of Zn2+ removal by PVA/EDTA resin in polluted water, J. Hazard. Mater., 2010, 178, 1046–1054 CrossRef CAS PubMed.
  18. M. A. Yahya, Z. Al-Qodah and C. W. Z. Ngah, Agricultural bio-waste materials as potential sustainable precursors used for activated carbon production: a review, Renewable Sustainable Energy Rev., 2015, 46, 218–235 CrossRef CAS.
  19. C. J. Shen, T. X. Yu and G. Lu, Double shock model in graded cellular rod under impact, Int. J. Solids Struct., 2013, 50, 217–233 CrossRef.
  20. L. Gang, D. Zhang, W. Man, H. Ji and L. Huang, Preparation of activated carbons from Iris tectorum employing ferric nitrate as dopant for removal of tetracycline from aqueous solutions, Ecotoxicol. Environ. Saf., 2013, 98, 273–282 CrossRef PubMed.
  21. A. C. Martins, O. Pezoti, A. L. Cazetta, K. C. Bedin, D. A. S. Yamazaki, G. F. G. Bandoch, T. Asefa, J. V. Visentainer and V. C. Almeid, Removal of tetracycline by NaOH-activated carbon produced from macadamia nut shells: kinetic and equilibrium studies, Chem. Eng. J., 2015, 260, 291–299 CrossRef CAS.
  22. G. Jiang, J. Feng, L. Jie, Z. Jiang, X. Chen, E. Mijowska, X. Wen and T. Tang, Catalytic carbonization of polypropylene into cup-stacked carbon nanotubes with high performances in adsorption of heavy metallic ions and organic dyes, Chem. Eng. J., 2014, 248, 27–40 CrossRef.
  23. S. S. Gupta, S. K. Das and T. Pradeep, Graphene from sugar and its application in water purification, ACS Appl. Mater. Interfaces, 2012, 4, 4156–4163 CAS.
  24. J. W. Jeon, R. Sharma, P. Meduri, B. W. Arey, H. T. Schaef, J. L. Lutkenhaus, J. P. Lemmon, P. K. Thallapally, M. I. Nandasiri, B. P. McGrail and S. K. Nune, In situ one-step synthesis of hierarchical nitrogen-doped porous carbon for high-performance supercapacitors, ACS Appl. Mater. Interfaces, 2014, 6, 7214–7222 CAS.
  25. J. Chen, G. Zhang, B. Luo, D. Sun, X. Yan and Q. Xue, Surface amorphization and deoxygenation of graphene oxide paper by Ti ion implantation, Carbon, 2011, 49, 3141–3147 CrossRef CAS.
  26. J. W. Lang, X. B. Yan, W. W. Liu, R. T. Wang and Q. J. Xue, Influence of nitric acid modification of ordered mesoporous carbon materials on their capacitive performances in different aqueous electrolytes, J. Power Sources, 2012, 204, 220–229 CrossRef CAS.
  27. G. Milczarek, A. Ciszewski and I. Stepniak, Oxygen-doped activated carbon fiber cloth as electrode material for electrochemical capacitor, J. Power Sources, 2011, 196, 7882–7885 CrossRef CAS.
  28. A. Alabadi, S. Razzaque, Y. Yang, S. Chen and B. Tan, Highly porous activated carbon materials from carbonized biomass with high CO2 capturing capacity, Chem. Eng. J., 2015, 281, 606–612 CrossRef CAS.
  29. C. Hinnen, D. Imbert, J. M. Siffre and P. Marcus, An in situ XPS study of sputter-deposited aluminium thin films on graphite, Appl. Surf. Sci., 1994, 78, 219–231 CrossRef CAS.
  30. J. Gong, B. Michalkiewicz, X. Chen, E. Mijowska, J. Liu, Z. Jiang, X. Wen and T. Tang, Sustainable conversion of mixed plastics into porous carbon nanosheets with high performances in uptake of carbon dioxide and storage of hydrogen, ACS Sustainable Chem. Eng., 2014, 2, 2837–2844 CrossRef CAS.
  31. E. Raymundo-Piñero, P. Azaïs, T. Cacciaguerra, D. Cazorla-Amorós, A. Linares-Solano and F. Béguin, KOH and NaOH activation mechanisms of multiwalled carbon nanotubes with different structural organisation, Carbon, 2005, 43, 786–795 CrossRef.
  32. I. Langmuir, The adsorption of gases on plane surfaces of glass, mica and platinum, J. Am. Chem. Soc., 1918, 40, 1361–1403 CrossRef CAS.
  33. H. M. F. Freundlich, Uber die adsorption in Losungen, J. Phys. Chem., 1906, 57, 385–471 CAS.
  34. Y. Chao, W. Zhu, F. Chen, P. Wang, Z. Da, X. Wu, H. Ji, S. Yan and H. Li, Commercial diatomite for adsorption of tetracycline antibiotic from aqueous solution, Sep. Sci. Technol., 2014, 49, 2221–2227 CrossRef CAS.
  35. Y. Gao, Y. Li, L. Zhang, H. Huang, J. Hu, S. M. Shah and X. Su, Adsorption and removal of tetracycline antibiotics from aqueous solution by graphene oxide, J. Colloid Interface Sci., 2012, 368, 540–546 CrossRef CAS PubMed.
  36. L. Huang, C. Shi, B. Zhang, S. Niu and B. Gao, Characterization of activated carbon fiber by microwave heating and the adsorption of tetracycline antibiotics, Sep. Sci. Technol., 2013, 48, 1356–1363 CrossRef CAS.
  37. P. Liu, W. Liu, H. Jiang, J. Chen, W. Li and H. Yu, Modification of bio-char derived from fast pyrolysis of biomass and its application in removal of tetracycline from aqueous solution, Bioresour. Technol., 2012, 121, 235–240 CrossRef CAS PubMed.
  38. Q. Zhou, Z. Li, C. Shuang, A. Li, M. Zhang and M. Wang, Efficient removal of tetracycline by reusable magnetic microspheres with a high surface area, Chem. Eng. J., 2012, 210, 350–356 CrossRef CAS.
  39. J. Rivera-Utrilla, C. V. Gomez-Pacheco, M. Sanchez-Polo, J. J. Lopez-Penalver and R. Ocampo-Perez, Tetracycline removal from water by adsorption/bioadsorption on activated carbons and sludge-derived adsorbents, J. Environ. Manage., 2013, 131, 16–24 CrossRef CAS PubMed.
  40. L. Zhang, X. Y. Song, X. Y. Liu, L. J. Yang, F. Pan and J. N. Lv, Studies on the removal of tetracycline by multi-walled carbon nanotubes, Chem. Eng. J., 2011, 178, 26–33 CrossRef CAS.
  41. C. Namasivayam and D. Kavita, Removal of congo red from water by adsorption on to activated carbon prepared from coir pith, an agricultural solid waste, Dyes Pigm., 2002, 54, 47–58 CrossRef CAS.
  42. S. Kumar, R. R. Nair, P. B. Pillai, S. N. Gupta, M. A. Iyengar and A. K. Sood, Graphene oxide–MnFe2O4 magnetic nanohybrids for efficient removal of lead and arsenic from water, ACS Appl. Mater. Interfaces, 2014, 6, 17426–17436 CAS.
  43. X. Y. Yu, T. Luo, Y. X. Zhang, Y. Jia, B. J. Zhu, X. C. Fu, J. H. Liu and X. J. Huang, Adsorption of lead(II) on O2-plasma-oxidized multiwalled carbon nanotubes: thermodynamics, kinetics, and desorption, ACS Appl. Mater. Interfaces, 2011, 3, 2585–2593 CAS.
  44. Y. H. Li, S. Wang, Z. Luan, J. Ding, C. Xu and D. Wu, Adsorption of cadmium(II) from aqueous solution by surface oxidized carbon nanotubes, Carbon, 2013, 41, 1057–1062 CrossRef.
  45. H. Wang, A. Zhou, F. Peng, H. Yu and J. Yang, Mechanism study on adsorption of acidified multi-walled carbon nanotubes to Pb(II), J. Colloid Interface Sci., 2007, 316, 277–283 CrossRef CAS PubMed.
  46. Z. Li, P. H. Chang, J. S. Jean, W. T. Jiang and C. J. Wang, Interaction between tetracycline and smectite in aqueous solution, J. Colloid Interface Sci., 2010, 341, 311–319 CrossRef CAS PubMed.
  47. W. J. Weber and J. C. Morris, Kinetics of adsorption on carbon from solution, J. Sanit. Eng. Div., 1963, 89, 31–60 Search PubMed.
  48. X. Zhu, Y. Liu, Q. Feng, Z. Chao, S. Zhang and J. Chen, Preparation of magnetic porous carbon from waste hydrochar by simultaneous activation and magnetization for tetracycline removal, Bioresour. Technol., 2013, 154, 209–214 CrossRef PubMed.
  49. W. Chen, L. Duan, L. Wang and D. Zhu, Response to comment on “adsorption of hydroxyl- and amino-substituted aromatics to carbon nanotubes”, Environ. Sci. Technol., 2009, 42, 3400–3401 CrossRef.

Footnote

Electronic supplementary information (ESI) available. See DOI: 10.1039/c6ra17286e

This journal is © The Royal Society of Chemistry 2016