DOI:
10.1039/C6RA17190G
(Paper)
RSC Adv., 2016,
6, 91584-91593
Thermal, mechanical and magnetic properties of functionalized magnetite/vinyl ester nanocomposites†
Received
5th July 2016
, Accepted 15th September 2016
First published on 15th September 2016
Abstract
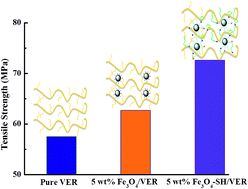
Magnetite (Fe3O4) nanoparticles grafted with thiol groups through silanization of (3-mercaptopropyl) trimethoxy-silane (Fe3O4-SH) were used for preparing vinyl ester resin (VER) nanocomposites with different Fe3O4 nanoparticle loading levels. The calculated thiol group graft percentage of only ∼2.25% did show a significant effect on the physicochemical properties of VER nanosuspensions and nanocomposites. The exothermal curing peak temperature was shifted from 80 °C for pure VER to 75 °C for liquid VER with 10 wt% Fe3O4-SH. The tensile strength (72.6 MPa) of 5 wt% Fe3O4-SH reinforced nanocomposites was increased by 26.3% as compared with that (57.5 MPa) of pure VER composites. However, the tensile strength (62.7 MPa) of 5 wt% Fe3O4 was just increased by 9.0%. The polymer matrix and surface coating were observed to have negligible effects on the magnetic properties of nanoparticles, exhibiting superparamagnetic behaviors.
1. Introduction
Vinyl ester resin (VER), a well-known thermosetting polymer obtained from the reaction between α,β-unsaturated acids and epoxy resins,1,2 the performance of VER lies between that of unsaturated polyester and epoxy resins,3 has been widely used in marine technology, chemical tanks and as a matrix for composite fabrication due to its high corrosion and water resistance,4–6 and VER has relatively high moduli, strength, and glass transition temperature while maintaining low weight and cost.7,8
Magnetic nanoparticles with a size close to the single-domain are of tremendous interest in different fields of chemistry and physics due to their unique magnetic properties such as high coercivity and chemical catalytic properties inherent with their small size and high specific surface area.9–11 The magnetic nanoparticles have great potential to be applied in a wide range of disciplines, including magnetic fluids,12,13 catalysis,14 biotechnology and biomedicine,15 magnetic resonance imaging,16 data storage,17–19 magnetic sensing,20–22 electromagnetic interference shielding,23,24 and environmental remediation.25 The magnetite (Fe3O4) is oxidation state and it can't be oxidized further, however Fe, Co and Ni are easily oxidized during its usage. Compared with low magnetization of γ-Fe2O3 around 35 emu g−1, Fe3O4 has a relatively larger magnetization (around 60 emu g−1) among all natural minerals on earth.26,27 Fe3O4 is a mixed iron oxide with a cubic inverse spinel structure, AB2O4,28 where the A site is occupied by Fe3+ ion, and octahedral B sites are occupied by an equal number of randomly distributed 2+ and 3+ Fe ions.29 Fe3O4 is a half-metallic ferromagnetic material, in which the density of state at the Fermi level N(EF) is completely polarized and the conductivity is determined by the metallic electron spin charge carriers because of the coexistence of metallic electron spin and insulating electron spin.28,30 Fe3O4 with a lot of unique catalytic, magnetic, and electrical properties28,31,32 has been widely applied in many fields such as biomedicine, information storage, color imaging, cell separation, environment remediation,33 and magnetic structural nanocomposites.34 Incorporating the Fe3O4 nanoparticles into polymer matrix can broaden their deployments in electronic, biomedical, and magnetic fields.35–38
The composite materials containing magnetic nanoparticles not only have the intrinsic properties of the magnetic nanoparticles but also possess properties of the polymer. VER combined with nano-Fe3O4 is a kind of polymer nano-composites possessing the performance of VER and the properties of Fe3O4 (such as magnetism). Different reagents have been used to modify Fe3O4 for usages in many fields.39–41 Meanwhile, different methods and materials have been used to modify VER to obtain good performances with many unique properties. For example, Li et al.42 used multifunctional polyhedral oligomeric silsesquioxane to improve the thermal stabilities, flexural strength, modulus and hardness of VER. Thostenson et al.43 have reported a technique to disperse the nanotubes in a vinyl ester monomer synthesized from an epoxy precursor for a potential usage as sensors in traditional fiber composites. Guo et al.44 functionalized γ-Fe2O3 nanoparticles with bi-functional coupling agent to increase thermal stability and mechanical properties. J. Karger-Kocsis et al.45–49 have made a series of efforts dedicated to the modification of VER. They used a novolac-based polyisocyanate (NPI) to modify the VER, the polyisocyanate-containing systems were termed VEUH, finding that adding NPI improved markedly the Tg values of the resins. VEUH was then toughened by adding various vinyl-functionalized branched polyethers and a set of six-arm star polymers. It was established that VER hybridized with other resins can be improved toughness with different toughening methods. They also found that hybridization of acrylated epoxidized soybean oil with vinyl ester is a promising strategy to develop hybrid resins with tailored thermal and mechanical properties, which are suited for engineering applications. The researches of vinyl ester resins modified with organophilic synthetic layered silicates and multiwall carbon nanotube have also performed. The results found that the fracture toughness and energy of composites were markedly improved with increasing organophilic synthetic layered silicates amount, and the electrical conductivity has improved much larger than on the fracture mechanical performance of composites modified with multiwall carbon nanotube. However, the Fe3O4 nanoparticles grafted with (mercaptopropyl) trimethoxy-silane (thiol group) to prepare the VER nanocomposites and their effects on the properties of VER nanocomposites have not been reported. Thiol–ene reactions, in both radical and base/nucleophilic forms, are able to change surface properties simply by light exposure.50 For example, Goldmann et al. reported the functionalization of cross-linked poly(divinylbenzene) microspheres using thiol–ene chemistry. It is really desirable that VER bearing vinyl moieties could be modified by thiol–ene reaction.51 Thiol–ene reaction could be exploited to build-in the magnetite nanoparticles in the VER network.
In this work, the Fe3O4 nanoparticles with surface grafted with thiol groups by using (3-mercaptopropyl) trimethoxy-silane coupling agent (Fe3O4-SH) have been used to prepare VER nanocomposites to increase the mechanical properties at the same time to introduce magnetization. The surface functional groups of Fe3O4-SH were analyzed by Fourier transform infrared (FT-IR) spectroscopy. The grafting ratio of Fe3O4-SH and the thermal stability of the cured VER nanocomposites were studied by thermogravimetric analysis (TGA). The crystalline information was studied by X-ray diffraction (XRD). The Brunauer–Emmett–Teller (BET) was measured on the surface areas and pore-size distributions to verify further the introduction of thiol group. The mechanical properties were analyzed by unidirectional tensile testing and dynamic mechanical analyses (DMA). The morphology of the fracture surfaces was characterized with a field emission scanning electron microscope (SEM).
2. Experimental
2.1 Materials
The vinyl ester resin (VER, Derakane momentum 411-350, Dow Chemical Company) was a mixture of 55 wt% vinyl ester with an average molecule weight of 970 g mol−1 and 45 wt% styrene monomers. Styrene with only one unsaturated carbon–carbon double bond will provide linear chain extension. Vinyl ester monomers with two reactive vinyl end groups will enable the cross-linking for network formation. The liquid resin has a density of 1.045 g cm−3 and a viscosity of 350 mPa s at room temperature. Methyl ethyl ketone peroxide (MEKP) (curing catalyst or initiator, organic peroxide, liquid) was purchased from Miller-Stephenson Chemical Company. The Fe3O4 nanoparticles were obtained from Nanjing Emperor Nano Material Co., Ltd., China. The grafting agent (3-mercaptopropyl) trimethoxy-silane and 2-propanol solvent were purchased from Fisher Scientific Company LLC (all chemical structures shown in ESI S1†).
2.2 Preparation of thiol-based Fe3O4 nanoparticles
The preparation of Fe3O4 containing thiol groups (Fe3O4-SH) is briefly described as follows. First, 7 g (3-mercaptopropyl) trimethoxy-silane (thiol group), 80 mL 2-propanol and 0.7 mL deionized water were added into a three-necked flask provided with a mechanical stirrer reflux condensing tube and temperature control system. The mixture was stirred at room temperature for 20 min. Second, 10 g Fe3O4 and 120 mL 2-propanol were added into the above mixture, the temperature was increased and maintained at 60 °C for 5 h with mechanical stirring. Finally, the mixture was filtered, washed several times with 2-propanol, and dried in a vacuum oven at 70 °C overnight. (The reaction sketch is shown in ESI S2.†)
2.3 Preparation of cured pure VER and its nanocomposites
The as-received or functionalized Fe3O4 nanoparticles were dispersed in 35 mL resin on a specific weight percentage basis (3.0, 5.0 and 10.0 wt%). The mixture was mechanically stirred at room temperature for dispersion and then the dispersion was carried out in an ice-water ultrasonic bath for about 1 h. When the temperature of the above particle suspension was increased to room temperature, 2.0 wt% catalyst (MEKP) was added to the suspension and mechanically stirred for 2 min. The solution was poured into silicone rubber molds and cured isothermally at 40 °C for 4 h. Then the temperature was increased and maintained at 100 °C for 1 h to accomplish the post curing process. Finally, the mixtures were cooled down naturally to room temperature.
2.4 Characterizations
The functional groups of (3-mercaptopropyl) trimethoxy-silane, as-received and functionalized Fe3O4 nanoparticles were analyzed by Fourier transform infrared spectroscopy (FT-IR, a Bruker Inc. Vector 22 coupled with an ATR accessory) in the range of 500–4000 cm−1 with a resolution of 4 cm−1. The grafting ratio was studied in a thermogravimetric analysis (TGA, TA Instruments, Q-500) with a heating rate of 10 °C min−1 under an air and nitrogen flow rate of 60 mL min−1 from 30 to 800 °C.
The powder X-ray diffraction analysis of the samples was carried out with a Bruker AXS D8 Discover diffractometer with general area detector diffraction system operating with a Cu-Kα radiation source filtered with a graphite mono-chromator (λ = 0.1541 nm). The specific Brunauer–Emmett–Teller (BET) surface areas and pore-size distributions were measured on a Quantachrome Nova 2200 e by nitrogen adsorption at 77.4 K. Prior to each measurement, the samples were degassed at 300 °C for 24 h under high vacuum (<0.01 mbar). The mesopore-size distribution was calculated by the Barrett–Joyner–Halenda (BJH) method using desorption isotherms.52
Differential scanning calorimeter (DSC, TA Instruments Q2000) measurements were implemented under a nitrogen flow rate of approximately 20 mL min−1 at a heating rate of 5 °C min−1 from 40 to 200 °C. Dynamic rheological measurements were performed isothermally by using environmental test chamber aluminum parallel-plate geometry (25 mm in diameter). For the isothermal test, the shear storage and loss moduli were obtained by operating the measurements isothermally at 40 °C with a sweeping time range between 0 and 300 s at a low strain (1%) in a rheometer (AR 2000 ex, TA Instrumental Company). The thermal stability of the cured VER nanocomposites with different Fe3O4 loadings and functional groups was studied with thermogravimetric analysis (TGA, TA instruments TGA Q-500). TGA was conducted on the cured pure VER, VER/Fe3O4 and VER/Fe3O4-SH nanocomposites from 30 to 600 °C with an air flow rate of 60 mL min−1 and a heating rate of 10 °C min−1. Dynamic mechanical analyses (DMA) measurements were carried out in the torsion rectangular mode using an AR 2000 ex (TA Instrumental Company) with a strain of 0.05%, a constant frequency of 1 Hz and a heating rate of 2 °C min−1 in the temperature range of 30–200 °C. The sample dimensions were 12 × 3 × 40 mm3.
The tensile tests were carried out following ASTM (Standard D 412-98a, 2002) in a universal tensile testing machine (ADMET tensile strength testing system). The parameters (displacement and load) were controlled by a digital controller (MTEST Quattro) with Mtest Quattro Materials Testing Software. The samples were prepared as described for the nanocomposites fabrication in the silicone rubber molds, which were designed according to the standard ASTM requirement. A crosshead speed of 1.00 mm min−1 was used and the strain (%) was calculated by dividing the crosshead displacement by the original gauge length. After the tensile test, the broken samples were collected and the morphology of the fracture surfaces was characterized with a field emission scanning electron microscope (SEM, Hitachi S-3400 SEM). The surface topography of the as-received and functionalized Fe3O4 NPs were also tested by SEM. Before testing, the samples were first coated with a thin gold layer for better imaging. The magnetic properties were investigated in a 9 T Physical Properties Measurement System (PPMS) by Quantum Design.
3. Results and discussion
3.1 Functionalization of Fe3O4 nanoparticles
Fig. 1A shows the FT-IR spectra of (3-mercaptopropyl) trimethoxy-silane (ESI S3†), as-received Fe3O4 and Fe3O4-SH. The bands at around 1621 and 3423 cm−1 are due to the O–H stretching modes and bending vibration of the free or adsorbed water and the hydroxyl groups of the Fe3O4.53 The bands at 790 and 1190 cm−1 are related to the Si–O characteristic peak of thiol-group (ESI S3†).54 In Fig. 1A(a and b), the sharp peak at 650 cm−1 is related to the Fe–O bending vibration.55 For the Fe3O4-SH spectrum, two Si–O characteristic peaks are observed at 990 and 1240 cm−1. For the as-received Fe3O4, only Fe–O characteristic peak is observed without the Si–O characteristic peaks. These results show the success of the Fe3O4 surface grafting with thiol groups by (3-mercaptopropyl) trimethoxy-silane.
 |
| Fig. 1 (A) FT-IR spectra, (B) XRD profiles, (C) pore-size distribution, and (D) TGA profile of (a) as-received Fe3O4 and (b) Fe3O4-SH. | |
X-ray diffraction (XRD) characterization was performed on the Fe3O4 and Fe3O4-SH nanoparticles to reveal the crystalline information. Fig. 1B shows the XRD patterns of the Fe3O4 nanoparticles with and without thiol groups. The position and intensity of the signals are typical for those of magnetite.56 However, all the XRD peaks are observed to be slightly moved to the small angle after thiol functional treatment, Fig. 1B, indicating that the lattice constant becomes bigger than that of the as-received Fe3O4.57 It is due to the introduction of atoms in the silane couple agent and the total atomic radius of silane couple agent is larger than the main atoms in Fe3O4. For this work, XRD indicates the successful introduction of thiol groups.
In order to investigate the porous structure and surface area, the nitrogen adsorption–desorption isothermals of the Fe3O4 mesoporous spheres with and without thiol treatment and its corresponding pore size distribution curve are shown in ESI S4,† Fig. 1C and Table 1. The isotherm can be classified as a type IV isotherm characteristic for Fe3O4 and Fe3O4-SH.58,59 The type IV isothermal is a characteristic of mesoporous solids with pore diameters between 2 and 50 nm.60 The corresponding pore size distribution data calculated from the desorption branch of the nitrogen isotherm by the BJH (Barrett–Joyner–Halenda) method shows that the Fe3O4-SH exhibit a lower BET surfaces area and smaller pore than the as-received Fe3O4 (Table 1). For the as-received Fe3O4 nanoparticles, a pore size distribution peaking at 4.3 nm was observed, and 3.4 nm for the Fe3O4-SH was observed. It is believed that the thiol groups grafted onto the opening of pores caused the closing of some pores and resulted in a reduced surface area and smaller pore size.
Table 1 Specific surface area and pore size from BET test
Particles |
BET surface area (m2 g−1) |
Average pore size (nm) |
As-received Fe3O4 |
110.3 |
4.3 |
Fe3O4-SH |
83.0 |
3.4 |
Fig. 1D shows the TGA curves of the as-received Fe3O4, Fe3O4-SH and (3-mercaptopropyl) trimethoxy-silane (ESI S5†) in nitrogen. For the as-received Fe3O4 and Fe3O4-SH nanoparticles, a similar initial decomposition temperature around 150 °C is observed due to the loss of moisture. However, different weight loss is observed between the as-received Fe3O4 and Fe3O4-SH from 30 to 800 °C. For the as-received Fe3O4 nanoparticles, a weight loss of 6.8% is observed at 800 °C due to decomposition of the of hydroxyl groups on the as-received Fe3O4 surface. After grafted with (3-mercaptopropyl) trimethoxy-silane, Fe3O4 has many thiol groups and a weight loss of 8.9% is observed at 800 °C due to decomposition of thiol groups. The grafting ratio can be calculated through eqn (1):61
|
 | (1) |
where
G is grafting ratio,
W1 is weight percentage of Fe
3O
4-SH after TGA test and
W0 is the weight percentage of as-received Fe
3O
4 after TGA test, the
G is calculated to be around 2.25%.
3.2 Curing process
The isothermal curing behaviors of the VER with Fe3O4 and Fe3O4-SH nanoparticles were studied using DSC. The DSC thermograms of pure VER, VER with Fe3O4 and Fe3O4-SH nanoparticles are shown in Fig. 2. The curing for all the samples starts at nearly the same temperatures (∼40 °C). However, the curing peaks of VER, VER with Fe3O4 and Fe3O4-SH are different and depend on the loading and functional groups. For the as-received Fe3O4, with increasing the loading of Fe3O4, the shape of curing peak becomes broad and the curing exothermal peak shifts from 80 (VER) to 99 °C (VER with 10.0 wt% Fe3O4 nanoparticles). The crosslinking enthalpy (ΔH, J g−1) was also increased with the loading of Fe3O4. The effect of Fe3O4 may like a retardant. The as-received Fe3O4 nanoparticles have hydroxyl groups, which hardly react with double bonds of VER or styrene. If there are too many Fe3O4 nanoparticles in VER, the crosslinking of the VER monomers would be decreased. ΔH was increased further than that of Fe3O4 for the Fe3O4-SH and the curing peak becomes sharper and the heat flow is increased significantly, indicating that the curing process could be done in a shorter time and the crosslink of VER had a drastic action due to the thiol group. When the loading of Fe3O4-SH is 10.0 wt%, the curing exothermal peak of VER shifts from 80 to 75 °C due to the existence of thiol group (ESI S6†). The reaction rate of thiol group with styrene is twelve times faster than that of the double bond in VER with styrene.62,63 When the Fe3O4-SH nanoparticles were dispersed in the VER, the functional group would promote the polymerization process.
 |
| Fig. 2 DSC thermograms of (a) pure VER, liquid VER nanosuspensions with (b) 3.0, (c) 5.0, and (d) 10.0 wt% Fe3O4, (e) 3.0, (f) 5.0, and (g) 10.0 wt% Fe3O4-SH nanoparticles. | |
3.3 Gelation time for VER with Fe3O4 and Fe3O4-SH
Gelation time (gel time) is the time interval required for a colloidal solution to become a solid or semisolid jelly or gel. Fig. 3 shows the shear storage modulus (G′) and loss modulus (G′′) of VER as a function of time at different isothermal curing temperatures. At the very beginning of the curing process (t = 0 s), VER is in liquid phase and more energy is dissipated than stored with higher G′′ than G′. With proceeding the curing process, both G′ and G′′ increase and the increment of G′ is more rapid than that of G′′, attributed to the network formation of the thermosetting materials, and the sample changes from more liquid like behavior to more solid like behavior.64 With further increasing the cross-link density, the value of G′ becomes equal to that of G′′, and the corresponding time of the crossing-point of G′ and G′′ is defined as gel time. After reaching the gel point, the sample turns to more elasticity and more energy is stored than dissipated with G′ higher than G′′.65 The gel time (in molecular terms, it refers to the point, at which an infinite network is formed) at different curing temperatures is summarized in Table 2.
 |
| Fig. 3 G′ and G′′ (open and solid symbols represent G′ and G′′, respectively) vs. t of the isothermal curing reaction for (a) pure VER, liquid VER with (b) 3.0, (c) 5.0, and (d) 10.0 wt% Fe3O4, (e) 3.0, (f) 5.0 and (g) 10.0 wt% Fe3O4-SH nanoparticles. | |
Table 2 Gel time and crosslinking enthalpy of liquid VER with different Fe3O4 nanoparticle loading levels
Composition |
tg (s) |
ΔH (J g−1) |
Pure VER |
175 |
110 |
3.0 wt% Fe3O4–VER |
192 |
159 |
5.0 wt% Fe3O4–VER |
460 |
163 |
10.0 wt% Fe3O4–VER |
521 |
169 |
3.0 wt% Fe3O4-SH–VER |
182 |
166 |
5.0 wt% Fe3O4-SH–VER |
149 |
171 |
10.0 wt% Fe3O4-SH–VER |
56 |
180 |
It is worth noting that the loading of Fe3O4 has an influence on the gel time. The gel time becomes longer with increasing the load of the as-received Fe3O4. However, after thiol group grafted on the Fe3O4 surface, the gel time becomes shorter with increasing the load of Fe3O4-SH compared with that of pure Fe3O4. If there are Fe3O4 particles in VER, the curing process would be prevented. With increasing the load of Fe3O4, the gel time becomes longer. The existed Fe3O4-SH particles promoted the curing process of VER. With increasing the load of Fe3O4-SH, the gel time becomes shorter.
3.4 Thermal stability of cured VER nanocomposites
The thermal stability of the cured VER and its Fe3O4 nanocomposites with and without thiol functional nanoparticles was examined by non-isothermal thermogravimetry. The TGA and differential thermogravimetric (DTG) data obtained for pure VER and its nanocomposites with and without thiol-nanoparticles in air are presented in Fig. 4. From the TGA data, the thermal stability factors, including the initial decomposition temperature (5.0% weight loss,
), temperature of 50% weight loss
, maximum decomposition rate of the first peak
, maximum decomposition rate of the second peak
, the temperature of maximum decomposition rate of the first peak
, the temperature of maximum decomposition rate of the second peak
, and char yield (C.Y) at 600 °C are summarized in Table 3. The TGA and DTG graphs show that all the samples have two main degradation stages. Both the VER/Fe3O4 and VER/Fe3O4-SH nanocomposites have a lower decomposition temperature for the first and second stage than that of pure VER. The
,
, and
of all the VER/Fe3O4 nanocomposites are almost the same as those of the VER/Fe3O4-SH nanocomposites, but a little lower than those of pure VER. It indicates that Fe3O4 nanoparticles with and without thiol treatment can promote the degradation of VER composites. This is due to the lower decomposition temperature of hydroxyl group in Fe3O4 and Si–C bonds in Fe3O4-SH than C–O and C–C bonds.66,67 And the further decomposition of the second stage is due to the degradation of benzene rings.68 The
of Fe3O4/VER with and without thiol groups was also lower than that of pure VER. However, the
of the VER/Fe3O4-SH nanocomposites was a little higher than that of the VER/Fe3O4 nanocomposites. This is due to the fact that VER/Fe3O4-SH had a little higher crosslinking density than the VER/Fe3O4 nanocomposites. With increasing the loading of Fe3O4 nanoparticles, the char yield increased. Higher concentration of Fe3O4 increased the char yield of the nanocomposites because the Fe3O4 nanoparticles cannot be burned.
 |
| Fig. 4 TGA and DTG curves of (a) pure VER, VER nanocomposites with (b) 3.0, (c) 5.0, and (d) 10.0 wt% Fe3O4, (e) 3.0, (f) 5.0, and (g) 10.0 wt% Fe3O4-SH nanoparticles. | |
Table 3 TGA data of the VER/Fe3O4 nanocomposites
Composition |
Thermal properties |

|

|

|

|

|

|
C.Y (600 °C/%) |
Pure VER |
350 |
415 |
3.6 |
0.4 |
417 |
538 |
1.8 |
3.0 wt% VER/Fe3O4 |
334 |
399 |
1.6 |
0.6 |
396 |
487 |
4.2 |
5.0 wt% VER/Fe3O4 |
339 |
398 |
1.6 |
0.7 |
395 |
488 |
5.0 |
10.0 wt% VER/Fe3O4 |
336 |
396 |
1.8 |
0.5 |
390 |
473 |
7.7 |
3.0 wt% VER/Fe3O4-SH |
344 |
400 |
2.2 |
0.4 |
397 |
490 |
4.0 |
5.0 wt% VER/Fe3O4-SH |
336 |
396 |
1.7 |
0.5 |
395 |
492 |
4.8 |
10.0 wt% VER/Fe3O4-SH |
335 |
397 |
1.6 |
0.6 |
394 |
507 |
7.9 |
3.5 Mechanical properties
Dynamic mechanical analysis (DMA) shows specific information about the storage modulus (G′), loss modulus (G′′) and loss factor (tan
δ) within the test temperature range. The G′ reflects the elastic modulus or energy storage of the VER nanocomposites while the G′′ is related to the viscous behavior or the energy dissipation associated with the motion of polymer chains in the VER nanocomposites.68 Fig. 5 shows the G′ as a function of temperature for pure VER and its cured nanocomposites with Fe3O4 and Fe3O4-SH nanoparticles. The G′ curves show a wave-like shape for the VER/Fe3O4 nanocomposites except the nanocomposites containing 5.0 wt% Fe3O4-SH. That is, the curves have a slight slope except the curve of 5.0 wt% Fe3O4-SH nanocomposites (just one declining curve). The slight slope shown in Fig. 5 is due to the additional curing of the sample.64 During the DMA test, with increasing the temperature, the samples enter the glass transition region, and sufficient molecular mobility enables further curing process. With the network formed in the resin, the movement of polymer chains is restrained and the G′ value is increased. After the VER is well cured, the samples entering the rubbery region, the G′ decreases with increasing the temperature.69 It is worth noting that the 5.0 wt% VER nanocomposites had no additional variation of G′, indicating that the 5.0 wt% Fe3O4-SH nanocomposites were well cured. It also indicates that thiol group has an effect on the curing process of VER. The tan
δ is the ratio of the G′′ to G′ and the peak of tan
δ is often used to determine the glass transition temperature (Tg). The 5.0 wt% Fe3O4-SH nanocomposites exhibit a different curve in the range of 90 to 110 °C from other samples, Fig. 5.
 |
| Fig. 5 (A) Storage modulus (G′), (B) loss modulus (G′′) and (C) tan δ vs. temperature of (a) the cured pure VER, and VER nanocomposites with (b) 5.0 wt% Fe3O4, (c) 5.0 wt% Fe3O4-SH, (d) 10.0 wt% Fe3O4, and (e) 10.0 wt% Fe3O4-SH nanoparticles. | |
Fig. 6 shows the typical tensile strain–stress curves of the cured VER nanocomposites. The tensile strength of the VER/Fe3O4 nanocomposites is observed to depend on two factors, i.e., the functional group and the nanoparticle loading. For the cured VER nanocomposites containing Fe3O4 and Fe3O4-SH nanoparticles, the tensile strength increases with increasing the Fe3O4 loading to 5.0 wt% and the tensile strength is decreased significantly with further increasing the Fe3O4 up to 10.0 wt%. For the 5.0 wt% Fe3O4 nanocomposites with and without thiol functional treatment, the tensile strength of the nanocomposites is around 72.6 and 62.7 MPa, which is increased by 26.3 and 9.0% (crosslink density, α = 0.97, 0.91) than that of pure-VER (57.5 MPa, α = 0.87), respectively. Compared with pure VER, the tensile strength of the 10.0 wt% Fe3O4 nanocomposites is decreased by 8.3% (α = 0.79). However, the 10.0 wt% Fe3O4-SH nanocomposites are increased by 5.9% (α = 0.89). While the loading of Fe3O4 with and without the thiol treatment reached 10.0 wt%, the tensile strength of the nanocomposites was decreased compared with that of 5.0 wt% Fe3O4 nanocomposites with and without thiol functional treatment. It is due to the agglomeration of the nanoparticles.34 The agglomerated nanoparticles prevented the crosslinking formation of polymer chains. For the functionalized Fe3O4 nanoparticles, the effect of thiol groups is more beneficial to the curing process than the hydroxyl groups on the as-received Fe3O4 nanoparticles. The thiol groups involved in the curing of VER, more VER chains were combined together and thus VER became harder to be broken. However, if there were too many Fe3O4-SH, it could make the curing process faster so that the crosslink was not complete, consistent with the gelation time for the VER nanocomposites with Fe3O4 and Fe3O4-SH and the DMA results.
 |
| Fig. 6 Stress–strain curve of (a) pure VER, and VER nanocomposites with (b) 3.0, (c) 5.0, (d) 10.0 wt% Fe3O4, (e) 3.0, (f) 5.0, and (g) 10.0 wt% Fe3O4-SH nanoparticles. | |
From the SEM graph (Fig. 7) of the fracture surface, the cured pure VER shows a smooth and river-like fracture surface, indicating that pure VER is very brittle, typical of thermosetting polymers. The fracture surface becomes much rougher after filled with the as-received and Fe3O4-SH nanoparticles. However, obvious different plastic deformation is observed for the nanocomposites with different particle loadings. The fracture surface of 10.0 wt% Fe3O4-SH nanocomposites is much rougher and much wavier than that of 5.0 wt% Fe3O4-SH. A lot of voids are observed in the fracture surface of 10.0 wt% Fe3O4-SH nanocomposites. This is due to the particles dispersed unevenly in the 10.0 wt% Fe3O4-SH nanocomposites. Some particles were aggregated together and these aggregations were debonded when the nanocomposites were broken, indicating a weak crosslinking in the area of debonding that could lead to a lower tensile strength. For the 10.0 wt% Fe3O4 nanocomposites, more aggregations are observed than that of the 10.0 wt% Fe3O4-SH nanocomposites and even the 5.0 wt% as-received Fe3O4 nanocomposites were observed to have some aggregations.
 |
| Fig. 7 SEM microstructures of the fracture surface of (a) pure VER and its composites with (b) 5.0, and (c) 10.0 wt% Fe3O4, (d) 5.0, and (e) 10.0 wt% Fe3O4-SH nanoparticles. | |
3.6 Magnetic properties
Magnetization is a phenomenon that describes the response of magnetic materials to an applied external magnetic field.70 The application of a magnetic field could align the magnetic moment of domain in the field direction. The magnetization increases until the magnetic field cannot increase the magnetization of the material further and at this moment the magnetization reaches the saturation magnetization (Ms).71,72 When the diameter of magnetic nanoparticles is around 10 nm, the coercive force (Hc) is normally zero, and the nanoparticles are in the super-paramagnetic state. The magnetic properties of a super-paramagnetic system can be described following the Langevin eqn (2):73 |
 | (2) |
where M is magnetization (emu g−1) in H (Oe), kB is the Boltzmann constant, m is the magnetic moment, T is the absolute temperature, and f(m) is the distribution function of magnetic moments related to the Ms as described by eqn (3): |
 | (3) |
According to eqn (2) and (3), the relationship between M and Ms can be described by eqn (4):
|
 | (4) |
where,
x =
αH; the parameter
α is related to the electron spin magnetic moment
m of the individual molecule as described in
eqn (5):
|
 | (5) |
Fig. 8 shows the room temperature magnetic hysteresis loops of Fe3O4 nanoparticles with and without thiol group, and VER/Fe3O4 nanocomposites with different particle loadings. Pure VER is a non-magnetic material, whereas the VER/Fe3O4 nanocomposites show no hysteresis loops, Fig. 8. The magnetization of all the samples did not reach saturation even at high magnetic field. The Ms is determined by the extrapolated Ms obtained from the intercept of M–H−1 at high field.74 The calculated Ms of the as-received Fe3O4 nanoparticles is 61.9 emu g−1, smaller than that of bulk (=92–100 emu g−1).75 The calculated Ms of Fe3O4-SH is 60.3 emu g−1, a little smaller than that of the as-received Fe3O4. This is due to the introduction of non-magnetic organic functional groups to Fe3O4. This indicates that the functional group could affect the magnetization of magnetic nanoparticles. The calculated Ms values of the nanocomposites with and without thiol group nanoparticles at a particle loading of 5.0 and 10.0 wt% are observed to be saturated at a lower field, are 1.8, 3.0, 4.5 and 6.4 emu g−1, respectively. All the samples that are modified with thiol group are observed to have a smaller magnetization than that of the as-received Fe3O4 nanoparticles. This indicates that the nanoparticles maintain comparable magnetization in the VER/Fe3O4 nanocomposites to that of the nanoparticles. The nonlinear fitting of magnetization (M) and magnetic field (H) using Polymath software was applied to obtain the best fit to eqn (4). The parameter α for the as-received Fe3O4 and Fe3O4-SH nanoparticles is 3.42 × 10⁻³ and 3.40 × 10⁻³ T−1, respectively. For the nanocomposites with and without thiol groups and with a particle loading of 5.0 and 10.0 wt%, the parameter α is 3.25 × 10⁻³, 3.33 × 10⁻³, 3.25 × 10⁻³ and 3.31 × 10⁻³ T−1, respectively. The magnetic moment m calculated from eqn (5) for the as-received Fe3O4 and Fe3O4-SH is 1.48 and 1.47 μB, respectively. For the nanocomposites with and without thiol group and the particle loading of 5.0 and 10.0 wt%, m is 1.40, 1.40, 1.43 and 1.43 μB, respectively. At the same loading with different functional group, m is almost the same, indicating that polymer has negligible effect on the magnetic moment of the Fe3O4 nanoparticles.28
 |
| Fig. 8 Room temperature magnetic hysteresis loops of VER nanocomposites with (a) 5.0 wt% Fe3O4-SH, (b) 5.0 wt% as-received Fe3O4, (c) 10.0 wt% Fe3O4-SH, (d) 10.0 wt% as-received Fe3O4, (e) as-received Fe3O4 and (f) Fe3O4-SH nanoparticles, inset photo shows the 5.0 wt% VER/Fe3O4-SH nanocomposites attracted by a magnet. | |
4. Conclusion
The Fe3O4 nanoparticles have been successfully functionalized with thiol group by the coupling agent of (3-mercaptopropyl) trimethoxy-silane. The VER/Fe3O4 nanocomposites with and without thiol groups have been fabricated at different loading levels. SEM indicates that the fracture surface of the nanocomposites became much rougher after filled with Fe3O4-SH nanoparticles. Too many particles were dispersed unevenly in the nanocomposites and the agglomerated nanoparticles decreased the tensile strength. The gel time was observed to become longer with increasing the load of the as-received Fe3O4 nanoparticles and the gel time became shorter with increasing the load of Fe3O4-SH except 3.0 wt% loading. The DMA test indicates that the 5.0 wt% Fe3O4-SH nanocomposites were well cured. The tensile test shows that the 5.0 wt% Fe3O4-SH nanocomposites have the largest tensile strength. The nanocomposites with and without thiol group appear as superparamagnetic behavior, i.e. without a hysteresis loop. The polymer matrix was observed to have negligible effects on the magnetic properties.
Acknowledgements
This project is financially supported by Fundamental Research Funds for the Central Universities (No. 2572015BX04), Chemistry and Technology Key Laboratory of Northeast Forestry University, Harbin Science and Technology Innovation Talent Research Special Funds (2015RAQXJ002), and start-up funds of University of Tennessee.
Notes and references
- P. N. Dave and N. N. Patel, J. Saudi Chem. Soc., 2014, 18, 398–403 CrossRef CAS
. - E. Can, E. Kinaci and G. R. Palmese, Eur. Polym. J., 2015, 72, 129–147 CrossRef CAS
. - C. Jang, T. E. Lacy, S. R. Gwaltney, H. Toghiani and C. U. Pittman, Macromolecules, 2012, 45, 4876–4885 CrossRef CAS
. - Z. Guo, H. Lin, A. B. Karki, S. Wei, D. P. Young, S. Park, J. Willis and T. H. Hahn, Compos. Sci. Technol., 2008, 68, 2551–2556 CrossRef CAS
. - J. F. Stanzione, P. A. Giangiulio, J. M. Sadler, J. J. La Scala and R. P. Wool, ACS Sustainable Chem. Eng., 2013, 1, 419–426 CrossRef CAS
. - G. C. Jacob, J. F. Fellers, S. Simunovic and J. M. Starbuck, J. Compos. Mater., 2002, 36, 813–850 CrossRef CAS
. - O. Abuomar, S. Nouranian, R. King, T. M. Ricks and T. E. Lacy, Comput. Mater. Sci., 2015, 99, 316–325 CrossRef CAS
. - C. Jang, T. E. Lacy, S. R. Gwaltney, H. Toghiani and C. U. Pittman, Polymer, 2013, 54, 3282–3289 CrossRef CAS
. - Q. He, T. Yuan, S. Wei, N. Haldolaarachchige, Z. Luo, D. P. Young, A. Khasanov and Z. Guo, Angew. Chem., Int. Ed., 2012, 124, 8972–8975 CrossRef
. - S. Wei, Q. Wang, J. Zhu, L. Sun, H. Lin and Z. Guo, Nanoscale, 2011, 3, 4474–4502 RSC
. - J. Gao, H. Gu and B. Xu, Acc. Chem. Res., 2009, 42, 1097–1107 CrossRef CAS PubMed
. - V. Bashtovoi, B. Berkovski and V. Bashtovol, Magnetic fluids and applications handbook, Begell House, Incorporated, 1996 Search PubMed
. - T. Gelbrich, M. Feyen and A. M. Schmidt, Macromolecules, 2006, 39, 3469–3472 CrossRef CAS
. - A. H. Lu, E. L. Salabas and F. Schüth, Angew. Chem., Int. Ed., 2007, 46, 1222–1244 CrossRef CAS PubMed
. - Z. Lu, M. D. Prouty, Z. Guo, V. O. Golub, C. S. Kumar and Y. M. Lvov, Langmuir, 2005, 21, 2042–2050 CrossRef CAS PubMed
. - C. H. Cunningham, T. Arai, P. C. Yang, M. V. McConnell, J. M. Pauly and S. M. Conolly, Magn. Reson. Med., 2005, 53, 999–1005 CrossRef CAS PubMed
. - G. Reiss and A. Hütten, Nat. Mater., 2005, 4, 725–726 CrossRef CAS PubMed
. - D. Zhang, R. Chung, A. B. Karki, F. Li, D. P. Young and Z. Guo, J. Phys. Chem. C, 2009, 114, 212–219 Search PubMed
. - Z. Liu, L. Chen, L. Zhang, S. Poyraz, X. Zhang and J. Zhu, Chem. Commun., 2014, 50, 8036 RSC
. - Z. Guo, S. Park, H. T. Hahn, S. Wei, M. Moldovan, A. B. Karki and D. P. Young, Appl. Phys. Lett., 2007, 90, 053111 CrossRef
. - Z. Guo, H. T. Hahn, H. Lin, A. B. Karki and D. P. Young, J. Appl. Phys., 2008, 104, 014314 CrossRef
. - H. Gu, Y. Huang, X. Zhang, Q. Wang, J. Zhu, L. Shao, N. Haldolaarachchige, D. P. Young, S. Wei and Z. Guo, Polymer, 2012, 53, 801–809 CrossRef CAS
. - Z. Guo, S. Park, H. T. Hahn, S. Wei, M. Moldovan, A. B. Karki and D. P. Young, J. Appl. Phys., 2007, 101, 09M511 Search PubMed
. - J. Zhu, S. Wei, N. Haldolaarachchige, D. P. Young and Z. Guo, J. Phys. Chem. C, 2011, 115, 15304–15310 CAS
. - D. Xia, T. W. Ng, T. An, G. Li, Y. Li, H. Y. Yip, H. Zhao, A. Lu and P. K. Wong, Environ. Sci. Technol., 2013, 47, 11166–11173 CrossRef CAS PubMed
. - Y. Tian, B. Yu, X. Li and K. Li, J. Mater. Chem., 2011, 21, 2476–2481 RSC
. - H. Gu, J. Guo, X. Yan, H. Wei, X. Zhang, J. Liu, Y. Huang, S. Wei and Z. Guo, Polymer, 2014, 55, 4405 CrossRef CAS
. - J. Guo, H. Gu, H. Wei, Q. Zhang, N. Haldolaarachchige, Y. Li, D. P. Young, S. Wei and Z. Guo, J. Phys. Chem. C, 2013, 117, 10191–10202 CAS
. - I. Leonov and A. Yaresko, J. Phys.: Condens. Matter, 2007, 19, 021001 CrossRef
. - J. Coey and C. Chien, MRS Bull., 2003, 28, 720–724 CrossRef CAS
. - C. Wang, H. Daimon and S. Sun, Nano Lett., 2009, 9, 1493–1496 CrossRef CAS PubMed
. - C. Ban, Z. Wu, D. T. Gillaspie, L. Chen, Y. Yan, J. L. Blackburn and A. C. Dillon, Adv. Mater., 2010, 22, E145–E149 CrossRef CAS PubMed
. - H. Gu, S. B. Rapole, J. Sharma, Y. Huang, D. Cao, H. A. Colorado, Z. Luo, N. Haldolaarachchige, D. P. Young and B. Walters, RSC Adv., 2012, 2, 11007–11018 RSC
. -
(a) H. Gu, S. Tadakamalla, Y. Huang, H. A. Colorado, Z. Luo, N. Haldolaarachchige, D. P. Young, S. Wei and Z. Guo, ACS Appl. Mater. Interfaces, 2012, 4, 5613–5624 CrossRef CAS PubMed
;
(b) H. Gu, J. Guo, H. Wei, S. Guo, J. Liu, Y. Huang, M. A. Khan, X. Wang, D. P. Young, S. Wei and Z. Guo, Adv. Mater., 2015, 27, 6277–6282 CrossRef CAS PubMed
. - J. Wang, Q. Chen, C. Zeng and B. Hou, Adv. Mater., 2004, 16, 137–140 CrossRef CAS
. - M. Liu, O. Obi, J. Lou, Y. Chen, Z. Cai, S. Stoute, M. Espanol, M. Lew, X. Situ and K. S. Ziemer, Adv. Funct. Mater., 2009, 19, 1826–1831 CrossRef
. - Z. H. Guo, T. Pereira, O. Choi, Y. Wang and H. T. Hahn, J. Mater. Chem., 2006, 16, 2800–2808 RSC
. - Z. H. Guo, S. Y. Wei, B. Shedd, R. Scaffaro, T. Pereira and H. T. Hahn, J. Mater. Chem., 2007, 17, 806–813 RSC
. - H. Zhang, X. Zhong, J.-J. Xu and H.-Y. Chen, Langmuir, 2008, 24, 13748–13752 CrossRef CAS PubMed
. - H. Wei and E. Wang, Anal. Chem., 2008, 80, 2250–2254 CrossRef CAS PubMed
. - K. S. Loh, Y. H. Lee, A. Musa, A. A. Salmah and I. Zamri, Sensors, 2008, 8, 5775–5791 CrossRef CAS
. - G. Li, L. Wang, H. Toghiani, T. Daulton and J. C. Pittman, Polymer, 2002, 43, 4167–4176 CrossRef CAS
. - E. T. Thostenson, S. Ziaee and T. W. Chou, Compos. Sci. Technol., 2009, 69, 801–804 CrossRef CAS
. - Z. Guo, K. Lei, Y. Li, H. W. Ng, S. Prikhodko and H. T. Hahn, Compos. Sci. Technol., 2008, 68, 1513–1520 CrossRef CAS
. - S. Grishchuk and J. Karger-Kocsis, eXPRESS Polym. Lett., 2011, 5, 2–11 CrossRef CAS
. - S. Grishchuk, N. Castella, A. A. Apostolov and J. Karger-Kocsis, J. Compos. Mater., 2012, 46, 941–947 CrossRef CAS
. - J. Karger-Kocsis and O. Gryshchuk, J. Appl. Polym. Sci., 2006, 100, 4012–4022 CrossRef CAS
. - O. Gryshchuk, J. Karger-Kocsis, R. Thomann, Z. Konya and I. Kiricsi, Composites, Part A, 2006, 37, 1252–1259 CrossRef
. - J. Karger-Kocsis, J. Frohlich, O. Gryshchuk, H. Kautz, H. Frey and R. Mulhaupt, Polymer, 2004, 45, 1185–1195 CrossRef CAS
. - V. S. Khire, Y. Yi, N. A. Clark and C. N. Bowman, Adv. Mater., 2008, 20, 3308–3313 CrossRef CAS
. - A. S. Goldmann, A. Walther, L. Nebhani, R. Joso, D. Ernst, K. Loos, C. Barner-Kowollik, L. Barner and A. H. E. Muller, Macromolecules, 2009, 42, 3707–3714 CrossRef CAS
. - J. Zhu, H. Gu, J. Guo, M. Chen, H. Wei, Z. Luo, H. A. Colorado, N. Yerra, D. Ding and T. C. Ho, J. Mater. Chem. A, 2014, 2, 2256–2265 CAS
. - J. Sun, S. Zhou, P. Hou, Y. Yang, J. Weng, X. Li and M. Li, J. Biomed. Mater. Res., Part A, 2007, 80, 333–341 CrossRef PubMed
. - M. Cai, M. Ho and J. E. Pemberton, Langmuir, 2000, 16, 3446–3453 CrossRef CAS
. - H. Zhu, R. Jiang, L. Xiao and G. Zeng, Bioresour. Technol., 2010, 101, 5063–5069 CrossRef CAS PubMed
. - N. V. Kuchkina, E. Y. Yuzik-Klimova, S. A. Sorokina, A. S. Peregudov, D. Y. Antonov, S. H. Gage, B. S. Boris, L. Z. Nikoshvili, E. M. Sulman and D. G. Morgan, Macromolecules, 2013, 46, 5890–5898 CrossRef CAS
. - D. Lee, A. Yoon, S. Jang, J.-G. Yoon, J. S. Chung, M. Kim, J. Scott and T. Noh, Phys. Rev. Lett., 2011, 107, 057602 CrossRef CAS PubMed
. - H. He, B. Li, J. Dong, Y. Lei, T. Wang, Q. Yu, Y. Feng and Y. Sun, ACS Appl. Mater. Interfaces, 2013, 5, 8058–8066 CAS
. - Y. Zhu, Y. Fang and S. Kaskel, J. Phys. Chem. C, 2010, 114, 16382–16388 CAS
. - S. Lowell, Characterization of porous solids and powders: surface area, pore size and density, Springer, 2004 Search PubMed
. - U. S. Toti and T. M. Aminabhavi, J. Controlled Release, 2004, 95, 567–577 CrossRef CAS PubMed
. - G. G. Odian and G. Odian, Principles of polymerization, Wiley-Interscience, New York, 2004 Search PubMed
. - S. Patai, Chemistry of the Thiol Group, Part 2 (Chemistry of Functional Groups), John Wiley & Sons, 1974 Search PubMed
. - X. Zhang, V. Bitaraf, S. Wei, Z. Guo and H. A. Colorado, AIChE J., 2014, 60, 266–274 CrossRef CAS
. - K. Dean, W. D. Cook, L. Rey, J. Galy and H. Sautereau, Macromolecules, 2001, 34, 6623–6630 CrossRef CAS
. - Q. Deng, C. Wilkie, R. Moore and K. A. Mauritz, Polymer, 1998, 39, 5961–5972 CrossRef CAS
. - J. Zhu, S. Wei, J. Ryu, M. Budhathoki, G. Liang and Z. Guo, J. Mater. Chem., 2010, 20, 4937–4948 RSC
. - W. D. Cook, G. P. Simon, P. J. Burchill, M. Lau and T. J. Fitch, J. Appl. Polym. Sci., 1997, 64, 769–781 CrossRef CAS
. - A. Demirbaş, Energy Convers. Manage., 2000, 41, 633–646 CrossRef
. - Y. Yao, E. Metwalli, M. A. Niedermeier, M. Opel, C. Lin, J. Ning, J. Perlich, S. V. Roth and P. Müller-Buschbaum, ACS Appl. Mater. Interfaces, 2014, 6, 5244–5254 CAS
. - X. Yan, M. Li, J. Long, X. Zhang, H. Wei, Q. He, D. Rutman, D. Cao, S. Wei, G. Chen and Z. Guo, Macromol. Chem. Phys., 2014, 215, 1098–1106 CrossRef CAS
. - J. Zhu, S. Wei, Y. Li, L. Sun, N. Haldolaarachchige, D. P. Young, C. Southworth, A. Khasanov, Z. Luo and Z. Guo, Macromolecules, 2011, 44, 4382–4391 CrossRef CAS
. - M. Kryszewski and J. Jeszka, Synth. Met., 1998, 94, 99–104 CrossRef CAS
. - D. Zhang, A. B. Karki, D. Rutman, D. P. Young, A. Wang, D. Cocke, T. H. Ho and Z. Guo, Polymer, 2009, 50, 4189–4198 CrossRef CAS
. - R. L. Rebodos and P. J. Vikesland, Langmuir, 2010, 26, 16745–21675 CrossRef CAS PubMed
.
Footnote |
† Electronic supplementary information (ESI) available. See DOI: 10.1039/c6ra17190g |
|
This journal is © The Royal Society of Chemistry 2016 |
Click here to see how this site uses Cookies. View our privacy policy here.