Lathyrus aureus and Lathyrus pratensis: characterization of phytochemical profiles by liquid chromatography-mass spectrometry, and evaluation of their enzyme inhibitory and antioxidant activities

E. J. Llorent-Martíneza, P. Ortega-Barralesb, G. Zengin*c, S. Uysalc, R. Ceylanc, G. O. Gulerd, A. Mocane and A. Aktumsekc
aUniversity of Castilla-La Mancha, Regional Institute for Applied Chemistry Research (IRICA), Ciudad Real 13071, Spain
bDepartment of Physical and Analytical Chemistry, University of Jaén, Campus Las Lagunillas S/N, E-23071 Jaén, Spain
cSelcuk University, Science Faculty, Department of Biology, Campus, 42250, Konya, Turkey. E-mail: biyologzengin@yahoo.com; Fax: +90 332 2410106; Tel: +90 332 223 27 81
dNecmettin Erbakan University, Ahmet Kelesoglu Education Faculty, Department of Biological Education, 42075, Konya, Turkey
eDepartment of Pharmaceutical Botany, “Iuliu Hatieganu” University of Medicine and Pharmacy, 8, V. Babes Street, Cluj-Napoca, Romania

Received 4th July 2016 , Accepted 9th September 2016

First published on 12th September 2016


Abstract

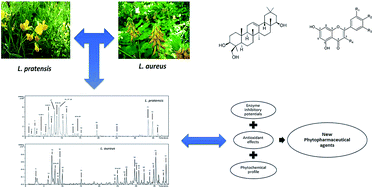
Different wild plants commonly used in folk medicine, such as different species from the genus Lathyrus, may represent new sources of biologically active compounds. Hence, a study of the composition and (bio)chemical behaviour of extracts from these plants may provide valuable information. To evaluate the phytochemical profile, and the enzyme inhibition and antioxidant activities of the aerial parts of L. pratensis and L. aureus, extracts from both plants were analyzed by high-performance liquid chromatography with electrospray ionization mass spectrometric detection (HPLC-ESI-MSn). The in vitro antioxidant activity (phosphomolybdenum, β-carotene bleaching, DPPH, ABTS, FRAP, CUPRAC and metal chelating) and enzyme inhibitory activity (acetyl cholinesterase, butyrylcholinesterase, tyrosinase, α-amylase and α-glucosidase) were also investigated for these Lathyrus species. Flavonoids and saponins were the main groups of compounds detected in the extracts from both plants. Generally, the methanol and water extracts presented remarkable antioxidant and enzyme inhibitory effects; all the observed results are critically discussed. The content of organic compounds and the antioxidant and enzyme assays suggest that these plants may be further used in phytopharmaceutical or food industry applications.
1. Introduction

For ages plants and plant products have been considered an important part of human life, as foods and therapeutic agents. Since 2000, they have become very popular as valuable sources of natural compounds, due to the fact that synthetic compounds are very expensive and have several side effects against human health.1,2 For example, plant secondary metabolites such as phenolics and flavonoids exhibit important biological activities (anti-oxidant, anti-microbial, anti-cancer and anti-mutagenic) and they have no negative effects on human health as compared to synthetics.3 In this direction, many scientists have focused their research on the characterization and biological effects of plants and plant secondary metabolites.4,5 At this point, uninvestigated wild plants from different folk medicine systems could be considered as promising sources of biologically active agents for drug and functional food development programs.

The genus Lathyrus (Fabaceae) is represented by more than 200 species worldwide. In Turkey, the genus comprises 75 taxa, 18 of which are endemic.6 Members of the genus Lathyrus contain high levels of proteins and they could be evaluated as an alternative source of protein for developing new functional foods.7 In addition, some Lathyrus species are widely used as therapeutic agents (wound healer, analgesic or anti-inflammatory, etc.) in the folk medicine of several countries.8,9 Again, previous studies on Lathyrus species have reported the presence of numerous biological active compounds such as phenolics,10 flavonoids,11 or polyunsaturated fatty acids.12 L. aureus is pubescent perennial with stems, and growing height of 80 cm. This species is mainly distributed in North Western regions of Anatolia. As for L. pratensis, it is a perennial with angled stems and its height reaching 60 cm. It is widely distributed in water meadows and stream sides of the Eastern region of Anatolia.13 To the best of our knowledge, the biological and chemical fingerprints for these Lathyrus species have not yet been reported. In this direction, the aim of this study was to explore the extracts of the two Lathyrus species (L. aureus and L. pratensis) for their antioxidant and enzyme inhibitory effects in relation with their chemical fingerprints by LC-MS/MS. The obtained results could be valuable for designing new phytopharmaceuticals and functional ingredients.

2. Experimental

2.1. Chemicals and reagents

All reagents and standards were of analytical reagent (AR) grade unless stated otherwise. Kaempferol, luteolin (≥98%), quercetin (≥95%) and rutin (≥95%) were purchased from Sigma-Aldrich (St. Louis, MO, USA) and 200 mg L−1 stock solutions were prepared in ethanol (HPLC grade; Sigma). LC-MS grade acetonitrile (CH3CN, 99%) (LabScan; Dublin, Ireland) and ultrapure water (Milli-Q Waters purification system; Millipore; Milford, MA, USA) were used for the HPLC-MS analyses. Folin–Ciocalteu's reagent and methanol were purchased from Merck (Darmstadt, Germany). 2,2-Diphenyl-1-picrylhydrazyl (DPPH), ABTS radical cation (2,2′-azino-bis(3-ethylbenzothiazoline)-6-sulphonic acid), DTNB (5,5-dithio-bis(2-nitrobenzoic)acid) and AChE (acetylcholinesterase (electric ell acetylcholinesterase, Type-VI-S, EC 3.1.1.7)), BChE (butyrylcholinesterase (horse serum butyrylcholinesterase, EC 3.1.1.8)), L-DOPA (3,4-dihydroxy-L-phenylalanine), tyrosinase, acetylthiocholine iodide (ATCI) and butyrylthiocholine chloride (BTCl) were purchased from Sigma Chemical Co. (Sigma-Aldrich GmbH, Sternheim, Germany). All other chemicals and solvents were of analytical grade.

2.2. Plant material and extraction procedure

The plant species were collected at flowering stage (June 2013) in Turkey regions, and their information and localities are explained below. Taxonomic identification of the plant materials was confirmed by the senior taxonomist Dr Murad Aydin Sanda, from the Department of Biology, Selcuk University. The voucher specimens were deposited at the KNYA Herbarium of Department of Biology, Selcuk University, Konya, Turkey.

1. Lathyrus aureus (Stev.) Brandza: Ankara, Cubuk, around Karagol, 40°24′39.37.00′′ N, 32°54′47.89.00′′ E, 1570 m.

2. Lathyrus pratensis L.: Ankara, Kizilcahamam, Soguksu National Park, 40°27′17.00′′ N, 32°37′27.00′′ E, 1124 m.

The plant materials were dried at room temperature. The dried aerial parts were ground to a fine powder using a laboratory mill. The drying procedure prevents the enzymatic degradation of flavonoids (particularly glycosides), which can take place in fresh or non-dried plant material. To obtain ethyl acetate and methanol extracts, the air-dried aerial parts (10 g) were macerated with 200 mL of these solvents at room temperature (25 °C ± 1 °C) for 24 hours. The extracts were concentrated under vacuum at 40 °C by using a rotary evaporator, and stored at 4 °C in the dark until use. Methanolic extracts were used for the characterization of the phenolic compounds. The extraction of these compounds depends on the sample matrix and the chemical properties of the phenolics (different polarity), so no perfect solvent exists. In addition, thermal extraction conditions may result in the loss of natural antioxidants and/or in their degradation.14 However, extractions using methanol or ethanol as solvents are the most common and, when performed at ambient temperatures, the degradation of phenolic compounds (glycosides are more stable) is usually avoided.14

To obtain water extracts, the powdered samples were boiled with 250 mL of distilled water for 30 min. The aqueous extracts were filtered, lyophilized (−80 °C, 48 h), and stored at +4 °C in the dark until use.

2.3. Chromatographic conditions

The HPLC system consisted of a vacuum degasser, an autosampler and a binary pump (Agilent Series 1100, Agilent Technologies, Santa Clara, CA, USA) equipped with a reversed phase Kinetex core–shell C18 analytical column of 50 × 2.1 mm and 2.6 μm particle size (Phenomenex, Torrance, CA, USA). A C18 Security Guard Ultra cartridge (Phenomenex) of 2.1 mm i.d. was placed before the analytical column. Considering the selected HPLC column and the different nature of the compounds to be separated, a mobile phase consisting of acetonitrile (A) and water–formic acid (100[thin space (1/6-em)]:[thin space (1/6-em)]0.1, v/v) (B) was used. The best separation was obtained with the following gradient program: 10% A (0 min), 25% A (10–20 min), 50% A (40 min), 100% A (42–47 min), and 10% A (49 min). The mobile phase flow rate was 0.4 mL min−1. After filtration through 0.45 μm PTFE membrane filters, 10 μL of each extract was injected.

The HPLC system was connected to an ion trap mass spectrometer (Esquire 6000, Bruker Daltonics, Billerica, MA, USA) equipped with an electrospray interface operating in negative ion mode. The scan range was set at m/z 100–1200 with a speed of 13[thin space (1/6-em)]000 Da s−1. The ESI conditions were as follows: drying gas (N2) flow rate and temperature, 10 mL min−1 and 365 °C; nebulizer gas (N2) pressure, 50 psi; capillary voltage, 4500 V; capillary exit voltage, −117.3 V. The acquisition of MSn data was made in auto MSn mode, with isolation width of 4.0 m/z, and fragmentation amplitude of 0.6 V (MSn up to MS4). Esquire control software was used for the data acquisition and Data Analysis for processing.

2.4. Total bioactive compounds

The total phenolic content was determined as previously reported by Zengin et al., (2014),4 the results being expressed as milligrams of gallic acid equivalents (mg GAE per g extract). The total flavonoid content was determined using the method described previously by Ceylan et al., (2016)15 and Lazarova et al., (2014).16 Rutin was used as reference standard and the results were expressed as milligrams of rutin equivalents (mg RE per g extract).

2.5. Antioxidant features assays

The total antioxidant activity of the samples was evaluated by the phosphomolybdenum and β-carotene bleaching methods method according to Zengin et al., (2015)17 and Sarikurkcu et al., (2015)18 with slight modifications.

The effect of the samples on 1,1-diphenyl-2-picrylhydrazyl (DPPH) radical was assessed according to Sarikurkcu, (2011),19 the results being expressed as milligrams of trolox equivalents (mg TE per g extract). The scavenging activity against ABTS radical cation (2,2′-azino-bis(3-ethylbenzothiazoline)-6-sulphonic acid) radical was measured according to the method described by Zengin et al., (2014)20 and the ABTS radical cation scavenging activity was expressed as milligrams of trolox equivalents (mg TE per g extract).

The reducing power of the samples was determined according to the methods of Zengin et al., (2015)17 and Aktumsek et al. (2013)21 with slight modifications using cupric ion reducing antioxidant power (CUPRAC) and ferric ion reducing antioxidant power, and results were expressed as trolox equivalents (TEs per g extract). Finally, metal chelating activity on ferrous ions was determined by the method described by Aktumsek et al., (2013)21 and the results were expressed as milligrams of EDTA (disodium edetate) equivalents (mg EDTAE per g extract).

2.6. Enzyme inhibition assays

The inhibitory effects of the extracts on selected key enzymes involved in public health problems (acetylcholinesterase (AChE) and butyrylcholinesterase (BChE), α-amylase, α-glucosidase, and tyrosinase inhibition) were assessed according to the methods reported previously by Ceylan et al., (2016)15 and Zengin, (2016).22 The results for these assays were expressed as standard compound equivalents (galantamine (mg GALAEs per g) extract for AChE and BChE; kojic acid (mg KAEs per g extract) for tyrosinase and acarbose (mmol ACAEs per g extract) for α-amylase and α-glucosidase, respectively).

2.7. Statistical analysis

All the assays were carried out in triplicate. The results are expressed as mean values and standard deviation (SD). The differences between the different extracts were analyzed using one-way analysis of variance (ANOVA) followed by Tukey's honestly significant difference post hoc test with α = 0.05. This treatment was carried out using SPSS v. 14.0 program.

3. Results and discussion

3.1. HPLC-ESI-MSn

HPLC has been previously described as the most useful tool for the separation of phenolic compounds. The conditions mainly include the use of reverse-phase C18 columns and a binary solvent gradient containing acidified water (usually formic acid) and a less polar organic solvent such as acetonitrile or methanol.14 The use of the gradient is needed due to the diverse polarity of the phenolic compounds. For instance, flavonoid aglycones are less polar than flavonoid glycosides; hence, the use of the gradient permits the separation of the compounds based on their different polarity (retention times are shown in ESI Tables 1 and 2). Although all the compounds cannot be separated in a single run (Fig. 1), the use of the MS detection permits the identification of co-eluting compounds.
image file: c6ra17170b-f1.tif
Fig. 1 HPLC-ESI/MSn base peak chromatograms (BPC) of the methanolic extracts from L. pratensis and L. aureus.

The complete and unequivocal identification of each phenolic compound (in the absence of analytical standards for each compound) found in a plant extract can only be achieved using NMR spectroscopy, due to the existence of a wide range of phenolic compounds positional isomers. However, the use of HPLC coupled to mass spectrometry, mostly ESI-MS, has been widely used for the identification of phenolic compounds in natural samples and allows the phytochemical screening of plant extracts.23–25

Here, the analysis of the phenolic composition in aerial parts of L. aureus and L. pratensis was performed by HPLC-ESI-MSn using the negative ionization mode. Two independent assays were carried out for each sample, obtaining similar data regarding the nature and relative intensities of the detected fragments. The base peak chromatograms of the methanolic extracts are shown in Fig. 1.

The initial step for the characterization of the different phenolic compounds in the analyzed samples consisted in the determination of the molecular weight of each compound. In the negative ionization mode (ESI) MS1 spectrum, the most intense peak usually corresponded to the deprotonated molecular ion [M − H], although several formic adducts ([M − H + HCOOH]) were also detected. For the identification of the compounds, the mass spectra of the aglycones were compared with analytical standards when available (luteolin, kaempferol, quercetin) and the chemical nature of the sugars were identified by the neutral losses observed in the glycosides. Rutin was identified by comparison of its retention time and mass spectra with those of an analytical standard. When standards were not available, the tentative characterization was carried out by a comparison of the experimental mass spectra with data from scientific literature. Compounds were numbered in both chromatograms by their order of elution. The lists of the compounds found in both plants are given in Tables 1 and 2, grouping the compounds by their chemical family. The full chromatographic and MS data are provided as ESI (Tables 1 and 2). The structures of the most relevant compounds are shown in Fig. 2.

Table 1 Characterization of the methanolic extract of aerial parts from L. pratensisa
No. Assigned identification No. Assigned identification
a HexA, uronic acid, such as glucuronic acid or galacturonic acid; Hex, hexose, such as glucose or galactose; dHex, 6-deoxyhexose, such as rhamnose or furanose; GlcA, glucuronic acid; Gal, galactose; Rha, rhamnose.
Phenolic acids Flavonoids
3 Dihydroxybenzoic acid hexoside 6 Naringenin-6,8-di-C-hexoside
4 Caffeoylquinic acid 9 Kaempferol-di-O-hexoside
12 5-Feruloylquinic acid 10 Isorhamnetin-3-O-rutinoside-7-O-hexoside
18 Methyl-caffeoyl-quinate 11 Isorhamnetin-O-hexoside-O-rhamnosylrutinoside
44 3-4-Dicaffeoylquinic acid 14 Quercetin-O-hexoside-O-rhamnoside
Saponins 15 Myricetin-O-rutinoside
57 dHex-Hex-HexA-bayogenin 17 Myricetin-O-hexoside
61 Unidentified saponin 19 Kaempferol-O-rhamnoside-O-rutinoside
69 Unidentified saponin 20 Kaempferol-O-hexoside-O-glucuronide
70 Unidentified saponin 22 Kaempferol-O-hexoside-O-rhamnoside
71 3-Rha-Gal-GlcA-soyasapogenol B 23 Quercetin-O-rhamnoside-O-rutinoside
75 dHex-Hex-HexA-soyasapogenol E 25 Kaempferol-di-O-hexoside (formate adduct)
Other compounds 27 Rutin
1 Oligosaccharide derivative 30 Quercetin-O-hexoside
55 Oxo-dihydroxy-octadecenoic acid 32 Kaempferol-O-rhamnoside-O-rutinoside
59 Trihydroxy-octadecenoic acid 34 Myricetin-O-hexoside
    35 Quercetin-O-hexoside
    37 Isorhamnetin rhamnosyl-rutinoside
    38 Luteolin-O-rutinoside
    39 Isorhamnetin-O-rutinoside (or isorhamnetin-O-neohesperidoside)
    41 Luteolin-O-hexoside
    45 Luteolin-O-hexoside
    46 Methylkaempferol-O-(deoxyhexose-hexose-deoxyhexose)
    48 Luteolin


Table 2 Characterization of the methanolic extract of aerial parts from L. aureusa
No. Assigned identification No. Assigned identification
a HexA, uronic acid, such as glucuronic acid or galacturonic acid; Hex, hexose, such as glucose or galactose; dHex, 6-deoxyhexose, such as rhamnose or furanose; GlcA, glucuronic acid; Gal, galactose; Rha, rhamnose.
Phenolic acids Flavonoids
5 Coutaric acid 13 Quercetin derivative
8 Ferulic acid-O-pentoside 16 Luteolin-6-C-hexoside
21 p-Coumaroyl malate 19 Kaempferol-O-rhamnoside-O-rutinoside
28 p-Coumaroyl malate derivative 24 Isorhamnetin rhamnosyl-rutinoside
Saponins 26 Apigenin-8-C-hexoside
47 Unidentified saponin 29 Kaempferol-O-rutinoside
50 Unidentified saponin 31 Brutieridin
53 Unidentified saponin 33 Kaempferol-O-rutinoside
56 Unidentified saponin 36 Kaempferol O-α-L-rhamnopyranosyl-(1→2)-[O-(3-hydroxy-3-methylglutaryl)-β-D-galactopyranoside]
57 dHex-Hex-HexA-bayogenin 40 Kaempferol-O-α-L-rhamnopyranosyl-(1→2)-[O-(3-hydroxy-3-methylglutaryl)-β-D-galactopyranoside]
58 Unidentified saponin 43 Kaempferol-O-hexoside derivative
62 Hex-Hex-HexA-hederagenin Other compounds
71 3-Rha-Gal-GlcA-soyasapogenol B 1 Oligosaccharide derivative
74 Hex-HexA-hederagenin 2 Citric acid
75 dHex-Hex-HexA-soyasapogenol E 55 Oxo-dihydroxy-octadecenoic acid
76 Soyasapogenol E-3-O-rhamnosyl arabinosyl glucuronide 59 Trihydroxy-octadecenoic acid


image file: c6ra17170b-f2.tif
Fig. 2 Chemical structures of the main compounds identified.

The discussion of the characterization of the detected compounds in the analyzed extracts follows, using different sub-sections depending on the chemical nature of the compounds found.

3.1.1. Phenolic acids. Compound 3, [M − H] at m/z 315, displayed the neutral loss of 162 Da (hexoside) to yield a fragment ion at m/z 153, which suffered decarboxylation (−44 Da) to produce the ion at m/z 109. Based on bibliographic data,26 it was identified as dihydroxybenzoic acid hexoside.

Three quinic acid derivatives were detected. Compound 4 was characterized as a monocaffeoylquinic acid, due to the deprotonated molecular ion at m/z 353, and MS2 base peak at m/z 191,27 although the exact isomer could not be identified. Compound 44, with [M − H] at m/z 515, displayed the MS2 base peak at m/z 353. According to the hierarchical key for the identification of di-caffeoylquinic acids,28 it was identified as 3,4-dicaffeoylquinic acid. Compound 12 exhibited an [M − H] at m/z 367 and MS2 base peak at m/z 191, so it was identified as 5-feruloylquinic acid.27

Compound 5, with [M − H] at m/z 295, suffered the neutral loss of 132 Da (tartaric acid moiety) and displayed an MS2 base peak at m/z 163, which corresponded to p-coumaric acid (confirmed by the fragment ion at m/z 119). Hence, this compound was characterized as coutaric acid.29

Compound 8 displayed the deprotonated molecular ion at m/z 325, and suffered the neutral loss of 132 Da (pentoside) to yield an MS2 base peak at m/z 193, which corresponded to ferulic acid (characteristic fragment ions at m/z 149 and 134). Hence, this compound was tentatively characterized as ferulic acid-O-pentoside.

Compounds 18 and 21 were identified as methyl-caffeoyl-quinate25 and p-coumaroyl malate30 after comparison of their MS spectra with bibliographic data. Compound 28 was tentatively characterized as a derivative of p-coumaroyl malate.

3.1.2. Flavonoids. Many flavonoids were detected in the analyzed extracts, especially in L. pratensis, being most of these flavonoids derivatives from isorhamnetin, luteolin, kaempferol, and quercetin.

Compound 6, [M − H] at m/z 595, was characterized as naringenin-6,8-di-C-hexoside considering bibliographic data.31 The most important MS2 fragment ions used for the characterization were observed at m/z 505 [M − H − 90], 475 [M − H − 120], 385 [272 + 113] and 355 [272 + 83], with 272 corresponding to the molecular weight of naringenin.

Compounds 9, 19, 20, 22, 25, 29, 32, 33, 36, 40, and 43 were kaempferol derivatives. In all cases, the mass spectra of the conjugated phenolic compounds showed the aglycone ion at m/z 285, due to the loss of moieties like glucuronide, hexoside, rhamnoside, or rutinoside (−176, −162, −146, −308 Da, respectively). Compounds 9 and 25 were identified as kaempferol-di-O-hexosides (loss of two consecutive hexosides). Compounds 19 and 32, with [M − H] at m/z 739, suffered the neutral losses of 146 and 308 Da, producing fragment ions at m/z 593 and 285, respectively, and were characterized as kaempferol-O-rhamnoside-O-rutinoside. Compound 20 suffered consecutive neutral losses of 162 and 176 Da and was identified as kaempferol-O-hexoside-O-glucuronide, whereas compound 22 was identified as kaempferol-O-hexoside-O-rhamnoside (consecutive losses of 146 and 162 Da). Compounds 29 and 33, with [M − H] at m/z 593, suffered the neutral loss of 308 Da to yield kaempferol, and were identified as kaempferol-O-rutinoside. Compounds 36 and 40 displayed a fragmentation pattern identical to the one previously described for kaempferol 3-O-α-L-rhamnopyranosyl-(1→2)-[6-O-(3-hydroxy-3-methylglutaryl)-β-D-galactopyranoside],32 so they are probably positional isomers of this compound. Compound 43 was identified as a kaempferol-O-hexoside derivative.

Compounds 10, 11, 24, 37, and 39 presented the aglycone at m/z 315, which was identified as isorhamnetin due to its characteristic fragment ion at m/z 300. Compound 10 presented [M − H] at m/z 785, and suffered consecutive neutral losses of 162 and 308 Da, yielding isorhamnetin; it was identified as isorhamnetin-3-O-rutinoside-7-O-hexoside considering bibliographic data.33,34 Compounds 24 and 37 presented [M − H] at m/z 769 and displayed fragment ions at m/z 623 (loss of 146 Da) and 315 (loss of 146 + 308 Da), so they were characterized as isorhamnetin rhamnosyl-rutinoside.24 Compound 11 had an [M − H] ion at m/z 931 and, after the loss of 162 Da to yield a fragment ion at m/z 769, suffered the loss of 454 Da yielding isorhamnetin at m/z 315. The direct loss of 454 Da might correspond to rhamnosyl-rutinoside (146 + 308), so it was tentatively characterized as isorhamnetin-O-hexoside-O-rhamnosylrutinoside. Compound 39 could correspond to isorhamnetin-O-rutinoside or isorhamnetin-O-neohesperidoside.35,36

Five quercetin derivatives were found in the analyzed extracts. Compounds 30 and 35 exhibited the deprotonated molecular ion at m/z 463 and suffered the neutral loss of 162 Da (hexoside) to yield quercetin at m/z 301 (typical fragments at m/z 179 and 151), so they were identified as quercetin-O-hexoside isomers.37 Compound 14, with [M − H] at m/z 609, suffered sequential neutral losses of 162 and 146 Da, and was characterized as quercetin-O-hexoside-O-rhamnoside. Compound 23 displayed fragment ions at m/z 609 [M − H − 146] and 301 [M − H − 146 − 308], corresponding to deoxyhexose and rutinoside losses, so it was characterized as quercetin-O-rhamnoside-O-rutinoside. A similar compound was previously reported in Zizyphus jujuba L. and Z. spina-christi L.,38 but it was not fully identified. Compound 13 displayed [M − H] at m/z 755 and suffered the direct loss of 454 Da (hexoside + deoxyhexoside + hexoside) yielding quercetin. Without further information it was characterized as a quercetin derivative.

Three myricetin compounds were identified in L. pratensis, whereas no myricetin was detected in L. aureus. Compound 15 displayed the deprotonated molecular ion at m/z 625 and yielded myricetin at m/z 317 after the loss of 308 Da (rutinoside). Compounds 17 and 34, with [M − H] at m/z 479, lost 162 Da (hexoside) to yield myricetin, and where identified as myricetin-O-hexoside isomers.39 Myricetin was identified in all cases due to its typical fragment ions at m/z 179 and 151.

Luteolin was assigned to compound 48 after comparison with an analytical standard. Four luteolin derivatives were observed in the extracts. Compound 16 was only detected in L. pratensis, whereas compounds 38, 41 and 45 were only observed in L. aureus. 16, with [M − H] at m/z 447, presented fragment ions at m/z 429, 357, 327 and 285, and was characterized as luteolin-6-C-hexoside (isoorientin), which is differentiated from the 8-C-hexoside (orientin) due to the [M − H − 18] fragment observed at m/z 429, which is absent in orientin. Compounds 38, 41 and 45 suffered neutral losses of 308, 162 and 162 Da, respectively, yielding the aglycone luteolin, and were identified as luteolin-O-rutinoside and luteolin-O-hexoside isomers. The aglycone luteolin was detected in all cases at m/z 285, and was identified due to its characteristic fragment ions at m/z 243, 241 and 151.

Compound 26, only observed in L. aureus, was identified as apigenin-8-C-hexoside, due to the typical fragment ions at m/z 341, 311 and 285.40 Compound 27 was identified as rutin after comparison with an analytical standard.

Compound 31 was characterized as brutieridin (hesperetin-7-[2′′-α-rhamnosyl-6′′-(3′′′′-hydroxy-3′′′-methylglutaryl)-β-glucoside]). The identification was carried out comparing the MS spectra with bibliographic information.41,42 Compounds 31, 36 and 40 are all flavonoids that presented an acylation with a 3-hydroxy-methylglutaryl group.

Compound 46 exhibited [M − H] at m/z 753 and suffered the direct loss of 452 Da (146 + 146 + 162), which may correspond to deoxyhexose–hexose–deoxyhexose. The aglycone was observed at m/z 299, and suffered the loss of 15 Da (methyl) to yield a fragment ion at m/z 284. This ion yields produces the base peak ion at m/z 255, which seems to correspond to kaempferol (typical 284 → 255 transition). Hence, this compound was tentatively characterized as methylkaempferol-O-(deoxyhexose-hexose-deoxyhexose).

3.1.3. Saponins. Several terpenoid saponins were detected in the methanolic extracts of L. pratensis and L. aureus. Some of them were unambiguously identified using bibliographic data, whereas others have been tentatively proposed as saponins due to their MS fragmentation pattern and similarity with other saponins already characterized in scientific bibliography. On one hand, compounds 57, 62, 71, 74, 75 and 76 corresponded to triterpene saponins previously reported in Medicago truncatula.43 On the other hand, compounds 47, 50, 53, 56, 58, 61, 69, and 70 displayed molecular weights and MS fragmentation patterns similar to other saponins,43 although they could not be fully characterized.
3.1.4. Other compounds. Compound 1 presented fragment ions at m/z 341, 179, 161, 143 and 119, which are characteristic of hexoses,44 so it was characterized as an oligosaccharide derivative.

Compound 2 was identified as citric acid due the deprotonated molecular ion at m/z 191 and its characteristic MS2 base peak at m/z 111.45

Compounds 55 and 59 were detected in both L. pratensis and L. aureus, and were identified as the oxylipins oxo-dihydroxy-octadecenoic acid and trihydroxy-octadecenoic acid, respectively, by comparison of their fragmentation pattern and bibliographic information.46

3.2. Total bioactive compounds

Phenolic compounds are highly emphasized mainly because of their association with a reduction in the incidences of some diseases, particularly their chemopreventive effects in cancer and other chronic disease.47,48 Nonetheless, the solubility of phenolics is highly influenced by the solvent's polarity or extraction technique. Solvents, such as methanol, ethanol, acetone, ethyl acetate, and their combinations have been used for the extraction of phenolics from plant materials.49,50 The highest extraction yield was obtained when water was used as solvent (15.72–22.72%), followed by methanol (14.92–16.49%) and ethyl acetate (0.31–0.86%). The fact that the extraction yield increased with the polarity of the solvent (highest extraction yield with water, the most polar solvent) indicates that a higher percentage of more polar (such as flavonoid glycosides) than nonpolar phenolic compounds were present in the extracts. Additionally, Lathyrus species are rich in proteins which are also water soluble, thus possibly generating higher extraction yield. From this point, the higher extraction yield of L. pratensis water extract might be linked also with possible higher protein content.7 The total phenolic and flavonoid contents of the two Lathyrus species are shown in Fig. 3, and fully provided in Table 3 (ESI).
image file: c6ra17170b-f3.tif
Fig. 3 Total phenolic content and total flavonoid content; GAEs, gallic acid equivalents; REs, rutin equivalents.

The highest levels of total phenolic content were observed in the methanolic extract of L. aureus and in the water extract of L. pratensis. Concerning the total flavonoid content, water extracts (solvent of highest polarity) presented the highest yields in both cases. A similar trend concerning higher yields of phenolic contents in water extracts was reported by Zengin et al., (2014, 2014).4,51 Previous data about the amounts of bioactive compounds in Lathyrus species were given by Chavan et al., (2001);7 Fratianni et al., (2014).10 However, the results are not comparable due to the different ways of considering samples or expressing results. In general, total bioactive components greatly depend on the solvent polarity. Moreover, the observed differences for the Lathyrus extracts might be explained by different pedo-climatic and geographical conditions, as well as genetic variations. In line with our results, several studies concerning members of the same genus have shown that differences in total and individual bioactive components are associated with different pedo-climatic conditions, geographical location of collection sites, as well as other ecological and genetic factors.52–54

3.3. Antioxidant activity assays

Due to the different mechanisms involved in the antioxidative processes of phenolic compounds, best conclusions could be drawn when at least two methods are used in evaluating the antioxidant capacity of different samples. Thus, the antioxidant capacities of the two Lathyrus species were evaluated by free radical scavenging assays (DPPH and ABTS), reducing power, phosphomolybdenum, β-carotene/linoleic acid bleaching and metal chelating assays. Free radical scavenging activities expressed as trolox equivalents are gathered in Table 4 (ESI) and pictorially represented in Fig. 4.
image file: c6ra17170b-f4.tif
Fig. 4 Radical scavenging activities (DPPH and ABTS cation); TEs, trolox equivalents.

In general, the activities increased when the polarity of the solvent increased (ethyl acetate < methanol < water), with water extracts showing the highest activities in both analyzed species (water extract; ABTS: 67.38 and 166.1 mg TE per g extract for L. aureus and L. pratensis, respectively). These findings can be easily attributed to the higher yields of phenolic compounds in methanolic and aqueous extracts. Moreover, the observed higher radical scavenging activities for water extracts might be also explained with the presence of other non-phenolic scavengers such as proteins.7,55

The reducing power of an extract is regarded as an important indicator of its potential antioxidant activity. Consequently, FRAP and CUPRAC assays were used for testing the reductive ability of the Lathyrus extracts. As seen in Table 5 (ESI) and Fig. 5, a trend similar to the free radical scavenging assays was registered here also. The water extracts (solvent of highest polarity) presented the highest reducing potentials (FRAP: 39.22 mg TE per g extract for L. aureus and 154.69 mg TE per g extract for L. pratensis) whereas the lowest values were registered for the ethyl acetate fraction (solvent of lowest polarity). Similar results concerning solvent polarity-related antioxidant capacity were observed also in our previous work concerning Sideritis galatica antioxidant features.20


image file: c6ra17170b-f5.tif
Fig. 5 Reducing power (FRAP and CUPRAC); TEs, trolox equivalents.

Iron is regarded as the most important pro-oxidant and increases the formation of the hydroxyl radicals via Fenton reaction. Therefore, ferrous chelating ability can be a valuable tool in characterizing the antioxidant activity of herbal extracts, L. aureus and L. pratensis in this case. Table 3 gathers the chelating effects of the studied extracts on ferrous ions. The highest metal chelating activity in the case of L. aureus was shown by the methanolic extract (9.39 mg EDTAEs per g extract), whereas the water extract presented the highest activity for L. pratensis (mg EDTAEs per g extract). These findings are in line with the results from the total phenolic content and suggest that phenolic compounds might be involved in the metal chelating activities of the two Lathyrus extracts. Moreover, the higher chelating activities for water extracts can be caused by non-phenolic chelators, including polysaccharides, peptides and proteins.20,55

Table 3 Total antioxidant and metal chelating activities of Lathyrus species (mean ± SD)a
Samples L. aureus L. pratensis
Phosphomolybdenumb (mmol TEs per g extract) β-Carotene bleachingc (%) Metal chelatingd (mg EDTAEs per g extract) Phosphomolybdenumb (mmol TEs per g extract) β-Carotene bleachingc (%) Metal chelating (mg EDTAEs per g extract)
a Data marked with different letters within the same column indicate statistically significant differences for each sample (p < 0.05).b TEs, trolox equivalents.c At 2 mg mL−1 concentration.d EDTAEs, disodium edetate equivalents.
Ethyl acetate 1.72 ± 0.01a 91.87 ± 0.08b 5.13 ± 0.74b 1.70 ± 0.06a 93.07 ± 0.34b 1.54 ± 0.06b
Methanol 1.41 ± 0.01b 91.07 ± 0.80b 9.39 ± 0.53a 1.40 ± 0.02b 91.92 ± 0.57bc 0.62 ± 0.12b
Water 0.53 ± 0.01c 82.85 ± 0.19c 1.09 ± 0.13c 1.59 ± 0.06ab 93.47 ± 0.42b 12.60 ± 0.49a
BHA 99.46 ± 0.31a 99.46 ± 0.31a
BHT 91.49 ± 0.23b 91.49 ± 0.23c
Trolox 91.15 ± 0.39b 91.15 ± 0.39c


Phosphomolybdenum and β-carotene/linoleic acid assays are considered as total antioxidant capacity assays because both phenolics and non-phenolic components (carotenoids, tocopherols, etc.) play a role in these assays. In the phosphomolybdenum assay (based on the reduction of Mo(VI) to Mo(V) by antioxidants), the results concerning the ethyl acetate and methanolic extracts were similar for both species, whereas the water extract of L. pratensis presented a higher antioxidant capacity that L. aureus, as seen in Table 3.

β-Carotene–linoleic acid bleaching inhibition assay is considered to be a good model for membrane based lipid peroxidation. An extract that inhibits β-carotene bleaching can be described as a free radical scavenger and a primary antioxidant.56 In the case of L. aureus, the ethyl acetate and methanol extracts demonstrated a similar ability to inhibit the bleaching of β-carotene by scavenging linoleate-derived free radicals as BHT and Trolox (Table 3). Moreover, a similar behavior was observed concerning the methanolic extract of L. pratensis. At this point, the results obtained by β-carotene–linoleic acid bleaching inhibition method were different from those of the radical scavenging and reducing power assays. The differences may be caused by the “polar paradox theory”, which states that polar antioxidants are more effective in less polar media (such as bulk oils), while nonpolar antioxidants are more effective in relatively more polar media (such as oil–water emulsions).48

As far as our literature survey could ascertain, information concerning the antioxidant capacity of members of Lathyrus genus is scarce. For example, Fratianni et al. (2014)10 and Sarmento et al. (2015)12 reported several antioxidant properties of L. sativus. However, these authors used IC50 (for radical scavenging capacities) or EC50 values (for reducing power assays) for expressing antioxidant results. Therefore, direct comparison between results is not possible.

3.4. Enzyme inhibition

Alzheimer's disease (AD) and diabetes mellitus (DM) are considered as global health problems due to their high prevalence in the population. For example, 285 million people were affected by DM in 2010 and there is an estimation of approximately 439 million DM patients for 2030.57 Also, AD affects more than 25 million people in the world today. The world prevalence of AD is assumed to increase to 1 in 85 people in 2050.58 In this way, scientists have focused on new treatment strategies for these diseases. Currently, key enzyme inhibition theory is accepted as one of the most effective strategies for these diseases. This strategy is known as “cholinergic hypothesis” for the treatment of AD. According to this hypothesis, cholinesterase inhibitors provide that the impairment of the memory result from the low levels of acetylcholine (Ach) in the synaptic gap.59 Ach is a very important neurotransmitter for cholinergic signal transfer in the synaptic area and is hydrolyzed by cholinesterases (acetylcholinesterase (AChE) and buytrylcholinesterase (BChE)). From this point, the inhibition of the hydrolysis of Ach by using cholinesterase inhibitors is very effective to continue memory function.60 As to DM, this disease is characterized by higher levels of postprandial glucose and α-amylase and α-glucosidase are key enzymes involved in the hydrolysis of carbohydrates. Thus, the inhibition of these enzymes is considered as a main target for the management of blood glucose level.61 Also, tyrosinase is a copper-containing enzyme that catalyzes the synthesis of melanin. As a consequence, tyrosinase inhibition is a potent tool in controlling melanogenesis and skin disorders (SD).62 Currently, many enzyme inhibitors (galantamine for AD, acarbose for DM and kojic acid for SD) are synthetically produced as drugs but they often present side effects such as gastrointestinal disturbances and hepatotoxicity.63–65 Hence, there is a need to search for natural compounds from plants without unfavorable effects to achieve effective and safe approaches for these health problems.

In order to evaluate the enzyme inhibitory activities (anti-cholinesterase, anti-tyrosinase, anti-amylase and anti-glucosidase), the three extracts of two Lathyrus species were tested using spectrophotometric methods. The results are gathered in Table 4. The ethyl acetate and methanol extracts had higher AChE inhibitory activities. The highest activity was observed for the methanol extract of L. aureus with 1.31 mg GALAEs per g extract. However, only two extracts (the ethyl acetate and methanol extracts of L. aureus) were active on BChE. The observed differences could be explained by the different active sites of these enzymes. Similar findings were obtained by several researchers.66,67 Concerning tyrosinase, L. aureus extracts presented higher inhibitory activities that L. pratensis extracts, with the inhibitory activities ranked as L. aureus-methanol > L. aureus-ethyl acetate > L. aureus-water > L. pratensis-ethyl acetate > L. pratensis-water > L. pratensis-methanol. Apparently, the inhibitory activity of the methanol extract of L. aureus (62.85 mg KAEs per g) was about 1.8 fold higher compared to the methanol extract of L. pratensis (35.08 mg KAEs per g). In contrast with tyrosinase, the ethyl acetate extracts exhibited the best amylase inhibitory activities, while the water extracts (0.13 mmol ACAEs per g for α-glucosidase and 0.17 mmol ACAEs per g for α-amylase) had the lowest activities. From these extracts, the methanol extract of L. pratensis was found to be the most potent α-glucosidase inhibitor, with 10.12 mmol ACAE per g extract, followed by the water extract of L. pratensis, which contains remarkable level of phenolics. In this context, the highest activities for these extracts could be explained by the high level of phenolic compounds. Similarly, our findings are supported by some authors, who reported a strong correlation between phenolics and glucosidase inhibitory effect.68,69 Nonetheless, the lowest α-glucosidase inhibitory activity was exhibited by the water extract of L. aureus. To the best of our knowledge, data concerning enzyme inhibitory effects of Lathyrus species are not available up-to-date. Hence comparison with other researchers' results is impossible.

Table 4 Enzyme inhibitory activities of Lathyrus species (mean ± SD)a
Assays L. aureus L. pratensis
Ethyl acetate Methanol Water Ethyl acetate Methanol Water
a Data marked with different letters within the same row indicate statistically significant differences for each sample (p < 0.05).b GALAEs, galantamine equivalents.c KAEs, kojic acid equivalents.d ACEs, acarbose equivalents.e na, not active.
Acetyl cholinesteraseb (mg GALAEs per g extract) 1.16 ± 0.01b 1.31 ± 0.01a 0.20 ± 0.02c 0.87 ± 0.02b 1.13 ± 0.01a 0.63 ± 0.03c
Butyrylcholinesteraseb (mg GALAEs per g extract) 0.42 ± 0.06a 0.14 ± 0.02b nae na na na
Tyrosinasec (mg KAEs per g extract) 55.62 ± 0.61b 62.85 ± 0.15a 40.30 ± 0.28c 39.34 ± 0.46a 35.08 ± 0.13b 38.31 ± 0.48a
α-Amylased (mmol ACEs per g extract) 0.55 ± 0.01a 0.39 ± 0.02b 0.17 ± 0.01c 0.39 ± 0.01a 0.37 ± 0.01a 0.13 ± 0.01b
α-Glucosidased (mmol ACEs per g extract) 2.83 ± 0.01b 3.18 ± 0.03a 0.85 ± 0.06c 2.08 ± 0.04c 10.12 ± 0.01a 8.30 ± 0.02b


4. Conclusion

The biological and chemical fingerprints of L. aureus and L. pratensis have been herein reported for the first time. The phenolic and saponins composition, antioxidant and enzyme inhibitory effects have been studied in detailed and the different assays have been compared to obtain reliable conclusions. The present work is the first study on enzyme inhibitory properties of species from the Lathyrus genus. Flavonoids and saponins were predominant components in the extracts from both plants. In general, water and methanol extracts presented higher antioxidant activities in the performed assays. The antioxidant activity and the enzyme inhibition effects were studied from different points of views, and they all revealed important activities, demonstrating that the extracts from these plants could be useful in the development of phyto-pharmaceuticals as natural and safe enzyme inhibitors. However, further studies are needed, including a toxicological evaluation of these Lathyrus species.

Acknowledgements

E. J. Llorent-Martínez acknowledges the financial support from the UCLM Research Plan. CICT from University of Jaén is also acknowledged. This research was also supported by The Scientific and Technological Research Council of Turkey (TUBITAK) (Project Number: 113Z892).

References

  1. J. Clardy and C. Walsh, Nature, 2004, 432, 829–837 CrossRef CAS PubMed.
  2. N. A. Şuţan, I. Fierăscu, R. C. Fierăscu, D. Ş. Manolescu and L. C. Soare, Ind. Crops Prod., 2016, 379–386 CrossRef.
  3. S. M. K. Rates, Toxicon, 2001, 39, 603–613 CrossRef CAS PubMed.
  4. G. Zengin, C. Sarikurkcu, A. Aktumsek, R. Ceylan and O. Ceylan, Ind. Crops Prod., 2014, 53, 244–251 CrossRef CAS.
  5. A. Mocan, L. Vlase, A. L. Arsene, D. Vodnar, C. Bischin, R. Silaghi-Dumitrescu and G. Crişan, Farmacia, 2015, 63, 890–896 Search PubMed.
  6. H. Genç, Nord. J. Bot., 2009, 27, 402–404 CrossRef.
  7. U. Chavan, F. Shahidi and M. Naczk, Food Chem., 2001, 75, 509–512 CrossRef CAS.
  8. F. Ertug, Econ. Bot., 2000, 54, 155–182 CrossRef.
  9. H. Sher, A. Ali, A. Aldosari and B. H. J. de, J. Ethnopharmacol., 2015, 166, 157–167 CrossRef PubMed.
  10. F. Fratianni, F. Cardinale, A. Cozzolino, T. Granese, D. Albanese, M. Di Matteo, M. Zaccardelli, R. Coppola and F. Nazzaro, J. Funct. Foods, 2014, 7, 551–557 CrossRef CAS.
  11. T. Ohtsuki, Y. Murai, T. Iwashina and H. Setoguchi, Biochem. Syst. Ecol., 2013, 51, 243–250 CrossRef CAS.
  12. A. Sarmento, L. Barros, Â. Fernandes, A. M. Carvalho and I. C. Ferreira, J. Sci. Food Agric., 2015, 95, 179–185 CrossRef CAS PubMed.
  13. P. H. Davis, in Flora of Turkey and the east Aegean Islands 3, ed. P. H. Davis, Edinburgh Univ. Press, 1970, pp. 328–369 Search PubMed.
  14. K. Pyrzynska and A. Sentkowska, Crit. Rev. Anal. Chem., 2015, 45, 41–51 CrossRef CAS.
  15. R. Ceylan, J. Katanić, G. Zengin, S. Matić, A. Aktumsek, T. Boroja, S. Stanić, V. Mihailović, G. O. Guler, M. Boga and M. A. Yılmaz, Ind. Crops Prod., 2016, 84, 254–262 CrossRef CAS.
  16. I. Lazarova, G. Zengin, A. Aktumsek, R. Gevrenova, R. Ceylan and S. Uysal, Ind. Crops Prod., 2014, 61, 438–441 CrossRef CAS.
  17. G. Zengin, S. Uysal, R. Ceylan and A. Aktumsek, Ind. Crops Prod., 2015, 70, 1–6 CrossRef CAS.
  18. C. Sarikurkcu, G. Zengin, M. Oskay, S. Uysal, R. Ceylan and A. Aktumsek, Ind. Crops Prod., 2015, 70, 178–184 CrossRef CAS.
  19. C. Sarikurkcu, Afr. J. Biotechnol., 2011, 10, 831–839 Search PubMed.
  20. G. Zengin, C. Sarikurkcu, A. Aktumsek and R. Ceylan, J. Funct. Foods, 2014, 11, 538–547 CrossRef CAS.
  21. A. Aktumsek, G. Zengin, G. O. Guler, Y. S. Cakmak and A. Duran, Food Chem. Toxicol., 2013, 55, 290–296 CrossRef CAS PubMed.
  22. G. Zengin, Ind. Crops Prod., 2016, 83, 39–43 CrossRef.
  23. E. J. Llorent-Martinez, V. Spinola, S. Gouveia and P. C. Castilho, Ind. Crops Prod., 2015, 69, 80–90 CrossRef CAS.
  24. M. J. Simirgiotis and G. Schmeda-Hirschmann, J. Chromatogr. A, 2010, 1217, 443–449 CrossRef CAS PubMed.
  25. M. J. Simirgiotis, Molecules, 2013, 18, 2061–2080 CrossRef CAS PubMed.
  26. C. Engels, D. Gräter, P. Esquivel, V. M. Jiménez, M. G. Gänzle and A. Schieber, Food Res. Int., 2012, 46, 557–562 CrossRef CAS.
  27. M. N. Clifford, K. L. Johnston, S. Knight and N. Kuhnert, J. Agric. Food Chem., 2003, 51, 2900–2911 CrossRef CAS PubMed.
  28. M. N. Clifford, S. Knight and N. Kuhnert, J. Agric. Food Chem., 2005, 53, 3821–3832 CrossRef CAS PubMed.
  29. K. Schütz, D. R. Kammerer, R. Carle and A. Schieber, Rapid Commun. Mass Spectrom., 2005, 19, 179–186 CrossRef PubMed.
  30. A. Afzan, N. R. Abdullah, S. Z. Halim, B. A. Rashid, R. H. R. Semail, N. Abdullah, I. Jantan, H. Muhammad and Z. Ismail, Molecules, 2012, 17, 4326–4342 CrossRef CAS PubMed.
  31. F. Ferreres, D. Gomes, P. Valentão, R. Gonçalves, R. Pio, E. A. Chagas, R. M. Seabra and P. B. Andrade, Food Chem., 2009, 114, 1019–1027 CrossRef CAS.
  32. E. A. Porter, A. A. van den Bos, G. C. Kite, N. C. Veitch and M. S. J. Simmonds, Phytochemistry, 2012, 81, 90–96 CrossRef CAS PubMed.
  33. M. Ye, Y. Yan and D.-A. Guo, Rapid Commun. Mass Spectrom., 2005, 19, 1469–1484 CrossRef CAS PubMed.
  34. P. Truchado, F. Ferreres and F. A. Tomas-Barberan, J. Chromatogr. A, 2009, 1216, 7241–7248 CrossRef CAS PubMed.
  35. C. Carazzone, D. Mascherpa, G. Gazzani and A. Papetti, Food Chem., 2013, 138, 1062–1071 CrossRef CAS PubMed.
  36. M. Sójka, S. Guyot, K. Kołodziejczyk, B. Król and A. Baron, J. Hortic. Sci. Biotechnol., 2015, 100–106 Search PubMed.
  37. W. Mullen, T. Yokota, M. E. J. Lean and A. Crozier, Phytochemistry, 2003, 64, 617–624 CrossRef CAS PubMed.
  38. A. M. Pawlowska, F. Camangi, A. Bader and A. Braca, Food Chem., 2009, 112, 858–862 CrossRef CAS.
  39. J. Sun, F. Liang, Y. Bin, P. Li and C. Duan, Molecules, 2007, 12, 679–693 CrossRef CAS PubMed.
  40. E. J. Llorent-Martínez, V. Spínola, S. Gouveia and P. C. Castilho, Ind. Crops Prod., 2015, 69, 80–90 CrossRef.
  41. L. Di Donna, G. De Luca, F. Mazzotti, A. Napoli, R. Salerno, D. Taverna and G. Sindona, J. Nat. Prod., 2009, 72, 1352–1354 CrossRef CAS PubMed.
  42. T. Mencherini, L. Campone, A. L. Piccinelli, M. G. Mesa, D. M. Sánchez, R. P. Aquino and L. Rastrelli, J. Agric. Food Chem., 2013, 61, 1686–1693 CrossRef CAS PubMed.
  43. J. Pollier, K. Morreel, D. Geelen and A. Goossens, J. Nat. Prod., 2011, 74, 1462–1476 CrossRef CAS PubMed.
  44. K. Brudzynski and D. Miotto, Food Chem., 2011, 127, 1023–1030 CrossRef CAS PubMed.
  45. P. Flores, P. Hellín and J. Fenoll, Food Chem., 2012, 132, 1049–1054 CrossRef CAS.
  46. L. Van Hoyweghen, K. De Bosscher, G. Haegeman, D. Deforce and A. Heyerick, Phytother. Res., 2014, 28, 224–230 CrossRef PubMed.
  47. F. Shahidi and P. K. Wanasundara, Crit. Rev. Food Sci. Nutr., 1992, 32, 67–103 CrossRef CAS PubMed.
  48. Y.-J. Surh, Nat. Rev. Cancer, 2003, 3, 768–780 CrossRef CAS PubMed.
  49. F. Shahidi and M. Naczk, Phenolics in Food and Nutraceuticals, CRC Press Taylor & Francis Group, New York, 2004, vol. 1 Search PubMed.
  50. F. Shahidi and Y. Zhong, J. Funct. Foods, 2015, 18, 757–781 CrossRef CAS.
  51. G. Zengin, A. Uysal, E. Gunes and A. Aktumsek, PLoS One, 2014, 9, 1–13 Search PubMed.
  52. R. Ferrer-Gallego, J. M. Hernández-Hierro, J. C. Rivas-Gonzalo and M. T. Escribano-Bailón, Anal. Chim. Acta, 2012, 732, 73–77 CrossRef CAS PubMed.
  53. L. Yu, G. Li, M. Li, F. Xu, T. Beta and J. Bao, Food Chem., 2016, 197, 776–782 CrossRef CAS PubMed.
  54. W. Routray and V. Orsat, Ind. Crops Prod., 2014, 62, 147–155 CrossRef CAS.
  55. R. J. Elias, S. S. Kellerby and E. A. Decker, Crit. Rev. Food Sci. Nutr., 2008, 48, 430–441 CrossRef CAS PubMed.
  56. A. Ferreira, C. Proenca, M. L. M. Serralheiro and M. E. M. Araujo, J. Ethnopharmacol., 2006, 108, 31–37 CrossRef CAS PubMed.
  57. R. K. Campbell, Clin. Ther., 2011, 33, 511–527 CrossRef CAS PubMed.
  58. W. Thies and L. Bleiler, Alzheimer's Dementia, 2013, 9, 208–245 CrossRef PubMed.
  59. R. Mayeux and M. Sano, N. Engl. J. Med., 1999, 341, 1670–1679 CrossRef CAS PubMed.
  60. G. Johnson and S. W. Moore, Neurochem. Int., 2012, 61, 783–797 CrossRef CAS PubMed.
  61. U. Etxeberria, A. L. de la Garza, J. Campión, J. A. Martínez and F. I. Milagro, Expert Opin. Ther. Targets, 2012, 16, 269–297 CrossRef CAS PubMed.
  62. Y. J. Kim and H. Uyama, Cell. Mol. Life Sci., 2005, 62, 1707–1723 CrossRef CAS PubMed.
  63. M. E. Chiari, D. M. A. Vera, S. M. Palacios and M. C. Carpinella, Bioorg. Med. Chem., 2011, 19, 3474–3482 CrossRef CAS PubMed.
  64. S. Kumar, V. Kumar, M. Rana and D. Kumar, Pharmacogn. Commun., 2012, 2, 18–33 CrossRef CAS.
  65. G. Topcu and T. Kusman, Bezmialem Science, 2014, 1, 1–25 CrossRef.
  66. F. S. Senol, I. E. Orhan and O. Ustun, Asian Pac. J. Trop. Med., 2015, 8, 269–275 CrossRef PubMed.
  67. S. P. Samaradivakara, R. Samarasekera, S. M. Handunnetti and O. V. D. S. J. Weerasena, Ind. Crops Prod., 2016, 83, 227–234 CrossRef CAS.
  68. B. Zhang, Z. Deng, D. D. Ramdath, Y. Tang, P. X. Chen, R. Liu, Q. Liu and R. Tsao, Food Chem., 2015, 172, 862–872 CrossRef CAS PubMed.
  69. P. Hemalatha, D. P. Bomzan, B. V. Sathyendra Rao and Y. N. Sreerama, Food Chem., 2016, 199, 330–338 CrossRef CAS PubMed.

Footnote

Electronic supplementary information (ESI) available. See DOI: 10.1039/c6ra17170b

This journal is © The Royal Society of Chemistry 2016