 Open Access Article
Creative Commons Attribution 3.0 Unported Licence
Ex vivo electric power generation in human blood using an enzymatic fuel cell in a vein replica†
Dmitry
Pankratov
abc,
Lars
Ohlsson
a,
Petri
Gudmundsson
a,
Sanela
Halak
d,
Lennart
Ljunggren
a,
Zoltan
Blum
a and
Sergey
Shleev
*abc
aBiomedical Science, Health & Society, Malmö University, 205 06 Malmö, Sweden. E-mail: sergey.shleev@mah.se
bEngineering Enzymology, A.N. Bach Institute of Biochemistry, 119 071 Moscow, Russia
cKurchatov NBICS Centre, National Research Centre “Kurchatov Institute”, 123182 Moscow, Russia
dMedical Imaging and Physiology, Skåne University Hospital, 205 06 Malmö, Sweden
First published on 18th July 2016
Abstract
Here we report an enzymatic fuel cell in a vein replica that generates sustained electricity, enough to power an e-ink display, in an authentic human blood stream. We also detail a simple and safe approach for fuel cell evaluation under homeostatic conditions. Our results demonstrate proof-of-principle operation of a biocompatible and safe biodevice that could be implanted in superficial human veins, which we anticipate to be a starting point for more sophisticated investigations of personal sources of electricity.
During the last decade several technological breakthroughs, such as solid-state memories, LEDs, e-ink displays, touch-screens, and communication utilities, viz. bluetooth, WiFi, NFC, have reinvented the personal electronics market. However, the development of portable electric power sources has lagged behind,1 and more often than not modern devices are limited by the energy available. This is a major concern for implanted biomedical devices,2 where biocompatible and safe energy sources are required.
Fuel cells could potentially address the need for implantable energy sources. The concept of an implanted fuel cell that continuously relies on ubiquitous bio-fuel and bio-oxidant, glucose and oxygen, respectively, was already conceived half a century ago, then confirmed experimentally by animal based in vivo studies,3,4 and soon thereafter theoretically elaborated on.5 Yet despite of the long history of fuel cell research and development, in vivo studies with human subjects have never been realised (the history and the state of the art of implanted biofuel cell research and development are described in recent reviews6–8). Moreover, only a few in vitro studies of fuel cells in human serum9,10 and blood11–14 (carried out under inherently non-homeostatic conditions) have been published to date, because of several challenges.
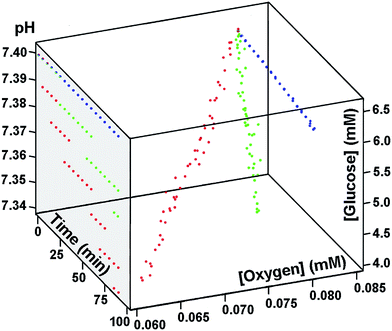
First, if a closed system is used at physiologically relevant temperatures, i.e. close to 37 °C, both glucose and oxygen concentrations, as well as blood pH, will rapidly and drastically decrease with time (Fig. 1) because of blood cell metabolism, making even a preliminary fuel cell test, requiring at least 10 min, intractable. In contrast, while investigations at room temperature, or at 0 °C, would benefit from the main blood parameters being more stable (Fig. 1), such studies are useless for practical applications. Second, if an open test system for fuel cell performance is used, the bio-oxidant concentration will rapidly and considerably increase to the air saturated state, i.e. in our studies from 0.082 mM to 0.209 mM (all errors for experimental values can be found in ESI†), whereas glucose concentration and blood pH will drop in 10 min from 6.4 mM and 7.40 down to 4.8 mM and 7.34, respectively (ESI section 1.7 (ESI 1.7)†). Third, when blood is released outside the body, and if anticoagulants, such as citrate, heparin, or ethylenediaminetetraacetate (EDTA), are not present, the blood will promptly coagulate, again, in less than 10 min, rendering fuel cell evaluations under physiological conditions (without additives) inconsequential, independent of the test bed used.‡
To address these methodological challenges in our study we investigated fuel cell performance ex vivo, i.e. we exploit an authentic human blood stream, constantly released outside the body, as the electrolyte for fuel cell operation. In addition, we also took into account the fact that any realisation and investigation of implanted devices in vivo would inevitably depend on the locus of implantation and therefore first asked where a fuel cell ideally should be implanted so that we could take this into consideration in our study design. We argue that a superficial human vein is one of the best choices for several reasons: (i) it only requires an easy and relatively safe surgery, compared to, e.g. abdominal cavity, atrium, ventricle3 and brain;15 (ii) it maintains extensive electrolyte exchange, thus enabling higher mass-transfer, and correspondingly, better fuel cell performance and higher power output, compared to subcutaneous tissue4 and the retroperitoneal space;16 (iii) it is clearly identifiable on a body for practical implantation.
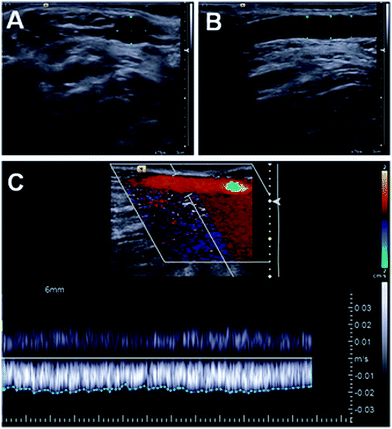
Based on these considerations, after ocular and palpative examination of percutaneously accessible human veins of a volunteer (ESI 1.2–1.3†), we selected the median cubital vein of the individual's right arm. To elucidate the parameters required for our ex vivo measurements to mimic the physiological conditions in this blood vessel we performed two-dimensional ultrasound and Doppler measurements of the vessel (Fig. 2, ESI 1.3, Movie M1†). These measurements returned a 4.9 mm mean inner diameter of the vein and 0.33 mL s−1 blood flow, respectively. Based on literature data concerning superficial vein thicknesses,17 the outer diameters of the vessel was assumed to be ca. 6 mm.
To mimic the study participant's vein we first used these parameters to fabricate tubular graphite electrodes with inner and outer diameters equal to 1.00 mm and 3.01 mm, respectively (ESI 1.4†). Graphite is generally accepted to be a biocompatible material,18 even though there are on-going discussions concerning the physiological effects of debris from graphitic wear.19 The outer diameter of the graphite electrodes was chosen to fit a plastic tube, hosting the final device, with an outer diameter of 6 mm. This diameter was chosen because it is identical to that of the participant's vein. Moreover, according to literature data17,20 as well as our own results (Fig. 2, Movie S1†), inner diameters of major superficial veins of human arms vary from 0.6 up to 4.9 mm. Thus, the outer diameter of the graphite electrodes is suitable for real immediate implantation (slit of the vein and insertion of the electrode followed by sewing) into major vessels (with inner diameters larger than 3 mm) to obtain high power outputs, since the current output strictly depends on the blood flow (ESI 2.3.2†), which is faster in larger veins.21
The inner diameter of the electrodes, on the one hand, was chosen to be small enough compared to the outer diameter to ensure electrode strength and thus safety during implantation (because of graphite's brittleness). On the other hand, the inner diameter of the electrodes was chosen to be large enough to sustain perfect laminar flow of the blood in the tube – the values of blood velocity in the artificial and natural vessels, as well as the Reynolds numbers, were 42 cm s−1 and 2 cm s−1, and 104 and 21, respectively (ESI 2.3.1†). This is because turbulent blood flow causes significantly more blood clots than laminar flow22 and should thus be avoided. In spite of deviations in dimensions between artificial tubes used in our studies and the natural vessel of the individual, viz. inner diameters of graphite electrode, plastic tube, and superficial vein are 1.0, 3.0, and 4.9 mm, respectively (ESI 1.3–1.5†), these discrepancies will not affect the fuel cell performance in vivo because current/power outputs from tubular electrodes/fuel cells are independent on blood velocity, given that the blood flow remains unchanged (ESI 2.3.2†).
To design a low-cost, mediator-free and membrane-less (i.e. innocuous and technically undemanding), glucose/oxygen fuel cell, we modified the graphite electrodes with suitable anodic and cathodic catalysts, viz. redox enzymes. Redox enzymes in general are exceptional biocatalysts,23 and at least in theory, they could be used to create fuel cells with properties that are unrivalled compared to all other devices based on both non-biogenic and biogenic compounds24 (ESI 2.1†). Thus, building on our previous report of the very first direct electron transfer glucose/oxygen enzymatic fuel cell25 and its successful operation in human serum,9 we modified the inner surface of the tubular graphite anode and cathode with cellobiose dehydrogenase and bilirubin oxidase, respectively. When operated in a flowing electrolyte, a complete, biocompatible materials based, low-cost mediator-free and membrane-less, potentially implantable glucose/oxygen fuel cell was realised (Movie M2).
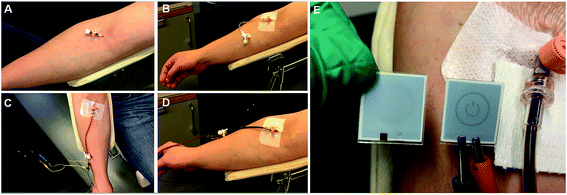
We next present unequivocal experimental proof that this membrane-less, direct electron transfer based enzymatic fuel cell generates electrical power in a human blood stream under homeostatic conditions (Fig. 3E, Movie M3†). To that end, we connected the tubular graphite device, with a biofuel cell incorporated, to the median cubital vein of the right arm of the volunteer (Fig. 3). The tubular device thereby not only mimics the human vein of interest – we measured the blood volume velocity during the ex vivo studies to be 0.33 mL s−1, i.e. identical to the natural blood flow in the vein – but also enables direct anaerobic blood sampling for simultaneous biomedical and clinical analyses during electrochemical measurements.
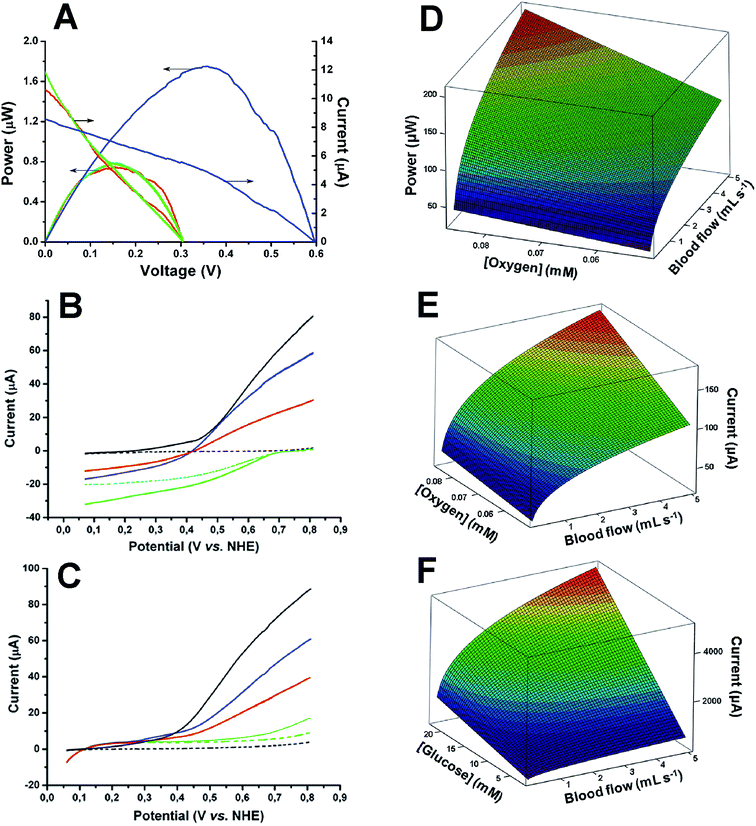
Ex vivo measurements of the electric power generation of our tubular enzymatic fuel cell revealed the following average characteristics: 0.31 V open-circuit voltage and 0.74 μW maximal electric power at a cell voltage of 0.16 V (Fig. 4A, red curve).
 | ||
| Fig. 4 Experimental results (left) and theoretical predictions (right) of electrical power and current outputs. (A) Typical electric outputs from a glucose/oxygen enzymatic tubular fuel cell operating ex vivo in streaming human blood (red curves) and in vitro in an artificial circulatory system (blue and green curves) at 37 °C. Blue and green curves – initial (6.4 mM glucose and 0.082 mM oxygen in PBS, pH 7.4) and complete blood mimicking buffers, respectively, pumped through the system with a flow rate of 0.33 mL s−1. (B and C) Typical linear sweep voltammograms of biomodified (coloured curves) and bare tubular graphite electrodes (black curves) during in vitro studies in the human blood mimicking circulatory system. Conditions: 6.4 mM glucose and 0.082 mM oxygen in PBS, pH 7.4, 37 °C, scan rate 1 mV s−1. (B) – cathodes (voltammograms were recorded from 0.80 V to 0.05 V), (C) – anodes (voltammograms were recorded from 0.05 V to 0.80 V). Dashed and solid black curves – PBS and complete blood mimicking buffer, respectively, both pumped trough the system with a flow rate of 0.33 mL s−1. Dashed and solid green curves – stagnant and pumped PBS with a flow rate of 0.33 mL s−1, respectively. Blue curve – PBS with redox active compounds, 0.045 mM ascorbate, 0.425 mM urate, and 1.92 mM lactate, pumped through the system with a flow rate of 0.33 mL s−1. Red curve – complete blood mimicking buffer pumped through the system with a flow rate of 0.33 mL s−1. (D–F) Calculated limiting current and electric power outputs as a function of reported bio-fuel/bio-oxidant concentrations and a broad physiological range of blood flow in the human superficial venous circulatory system (ESI 2.3.2†). Power output from a tubular biodevice (D), as well as current outputs from a cathode (E) and an anode (F), implanted in a subcutaneous vein. | ||
This was enough to power an e-ink based macro-scale display, similar to those widely used in current personal electronics applications (Fig. 3E, Movie M3†). Furthermore, the electricity was continuously generated for at least 10 min using three fuel cell replicas, during three different days, without significant drops or fluctuations (the maximal experimental time was 20 min, limited by the total volume of blood, which can be harmlessly donated, ESI 1.5†).
While the generated electric power is remarkable in its own right, we expect much higher values to be possible. According to our calculations, about three orders of magnitude higher (0.21 mW) maximal (theoretical) electric power from a 1 cm tubular device implanted in the study participant's vessel is expected (Fig. 4D), also taking into account augmentation of solute transportation due to formation of a cell-free skimming layer at the tube wall.26
To understand the factors that determine the performance of the demonstrated enzymatic fuel cell under homeostatic conditions we also carried out step-by-step control investigations of the biodevice in an in vitro setting, specifically investigating the role of the discrete bioanodes and biocathodes, and compared this to the ex vivo results. To that end, we performed blood clinical analysis during electrochemical ex vivo investigations to determine, in addition to glucose and oxygen concentrations, as well as pH (vide supra), main plasma electrolytes, i.e. 4.05 mM K+, 141.4 mM Na+, and 105.4 mM Cl− (ESI 1.7†). Using this information, we prepared an initial blood mimicking buffer and pumped this through an artificial closed circulatory device with the flow rate identical to the blood flow in vivo/ex vivo (ESI 1.6†). These initial tests of the fuel cell performance in an in vitro setting revealed high values as regards the open-circuit voltage (0.60 V) and maximum electric power (1.8 μW) at a cell voltage of 0.36 V (cf. blue and red curves in Fig. 4A). Thus, we also added low potential redox active components, viz. ascorbate, urate, and lactate (average concentrations in venous blood plasma of the volunteer were measured at 0.045 mM, 0.425 mM, and 1.92 mM, respectively, ESI 1.7†) to the initial buffer at appropriate concentrations, and adjusted the electrolyte viscosity to a physiologically relevant value (measured at 4.28 mPa s, ESI 1.7†). The resulting buffer was indeed found to fully mimic the blood – the in vitro performance of the biofuel cell was almost identical to the performance ex vivo (cf. red and green curves in Fig. 4A).
Based on detailed studies of separate bioelectrodes we concluded that the attenuated ex vivo performance compared to initial in vitro tests (cf. blue and red curves in Fig. 4A) exclusively could be attributed to the biocathode (ESI 2.2†); even a low performance cellobiose dehydrogenase based anode does not become the limiting electrode during ex vivo operation (cf.Fig. 4B and C). Our calculations on maximal theoretical currents also conclusively show that glucose electrooxidation never limits the fuel cell performance (cf.Fig. 4E and F), whereas implanted fuel cell modelling in the literature exclusively focuses on the anode, including the very first theoretical elaboration.5
Conclusions
This is, to the best of our knowledge, the first study and proof-of-principle demonstration of a fuel cell operating under homeostatic conditions in human blood. The device is inexpensive, simple to realise, and safe – thus it is suitable for implantation. The performance of the device ex vivo is limited by a combination of factors, such as low concentration of the available bio-oxidant, high concentrations of energetically inadequate bio-fuels, high blood viscosity, and low blood flow rates; many of these factors have been underestimated or even unaccounted for in previous in vitro studies of enzymatic fuel cells in human blood.11–14 However, the performance can be improved further by selecting a more efficient bio-modification procedure, e.g. chemisorption instead of physisorption, along with the employment of highly active biocatalysts, e.g. a specifically engineered redox enzyme instead of the wild type. In spite of the limited performance, practical tests with commercially available electronics, as well as theoretical predictions regarding the maximum recoverable electrical energy from venous blood, fully support the idea that biofuel cells can be used as electrical power sources for personal electronics/electromechanical appliances, including implantable devices, such as pacemakers and urinary sphincters, with power consumption below 0.1 mW. Being a state-of-the-art demonstration, ex vivo measurements from a single individual, as reported herein, are fully sufficient to illustrate the feasibility of the fuel cell approach. Including additional subjects would only influence the power generated in the frame of physiological variations of main factors affecting biodevice performance, i.e. concentrations of biofuels and bio-oxidant, pH, etc.We expect this work to be a starting point for the development and design of long-lasting, high-performance, inexpensive, biocompatible, and safe sources of electricity that can power miniature electronics using nothing but the bio-fuel provided by the human body. In addition, the simple and safe biomedical test bed described herein may also be useful for accurate ex vivo studies of other types of implantable devices, e.g. sensors and chips, in human blood.
Acknowledgements
The work has been financially supported by the Swedish Research Council (621-2013-6006) and by the Russian Science Foundation (14-14-00530). The authors thank Dr Roland Ludwig (BOKU University, Austria) and Dr Miguel Duarte Toscano (Novozymes A/S, Denmark) for preparations of cellobiose dehydrogenase and bilirubin oxidase, respectively. The authors also thank Dr Dan Csontos (Elevate Scientific AB, Sweden) for critical reading of the manuscript and helpful suggestions, Dr Peter Falkman (Malmö University, Sweden) for fabrication of the electrodes, as well as Nikita Chebrushkov (“DvaStvola”, Russia) for the creation of the animation clip.Notes and references
- N.-S. Choi, Z. Chen, S. A. Freunberger, X. Ji, Y.-K. Sun, K. Amine, G. Yushin, L. F. Nazar, J. Cho and P. G. Bruce, Angew. Chem., Int. Ed., 2012, 51, 9994–10024 CrossRef CAS PubMed.
- E. Meng and R. Sheybani, Lab Chip, 2014, 14, 3233–3240 RSC.
- M. E. Talaat, J. H. Kraft, R. A. Cowley and A. H. Khazei, IEEE Trans. Biomed. Eng., 1967, 14, 263–265 CrossRef CAS PubMed.
- R. F. Drake, B. K. Kusserow, S. Messinger and S. Matsuda, Trans. - Am. Soc. Artif. Intern. Organs, 1970, 16, 199–205 CAS.
- A. J. Appleby, D. Y. C. Ng and H. Weinstein, J. Appl. Electrochem., 1971, 1, 79–90 CrossRef CAS.
- S. Cosnier, A. Le Goff and M. Holzinger, Electrochem. Commun., 2014, 38, 19–23 CrossRef CAS.
- M. Falk, C. W. Narvaez Villarrubia, S. Babanova, P. Atanassov and S. Shleev, ChemPhysChem, 2013, 14, 2045–2058 CrossRef CAS PubMed.
- E. Katz and K. MacVittie, Energy Environ. Sci., 2013, 6, 2791–2803 CAS.
- V. Coman, R. Ludwig, W. Harreither, D. Haltrich, L. Gorton, T. Ruzgas and S. Shleev, Fuel Cells, 2010, 10, 9–16 CAS.
- M. Southcott, K. MacVittie, J. Halamek, L. Halamkova, W. D. Jemison, R. Lobel and E. Katz, Phys. Chem. Chem. Phys., 2013, 15, 6278–6283 RSC.
- A. Dector, R. A. Escalona-Villalpando, D. Dector, V. Vallejo-Becerra, A. U. Chavez-Ramirez, L. G. Arriaga and J. Ledesma-Garcia, J. Power Sources, 2015, 288, 70–75 CrossRef CAS.
- C. Pan, Y. Fang, H. Wu, M. Ahmad, Z. Luo, Q. Li, J. Xie, X. Yan, L. Wu, Z. L. Wang and J. Zhu, Adv. Mater., 2010, 22, 5388–5392 CrossRef CAS PubMed.
- M. Falk, Z. Blum and S. Shleev, Electrochim. Acta, 2012, 82, 191–202 CrossRef CAS.
- M. Cadet, S. Gounel, C. Stines-Chaumeil, X. Brilland, J. Rouhana, F. Louerat and N. Mano, Biosens. Bioelectron., 2016, 83, 60–67 CrossRef CAS PubMed.
- V. Andoralov, M. Falk, B. Suyatin Dmitry, M. Granmo, J. Sotres, R. Ludwig, O. Popov Vladimir, J. Schouenborg, Z. Blum and S. Shleev, Sci. Rep., 2013, 3, 3270 Search PubMed.
- P. Cinquin, C. Gondran, F. Giroud, S. Mazabrard, A. Pellissier, F. Boucher, J.-P. Alcaraz, K. Gorgy, F. Lenouvel, S. Mathe, P. Porcu and S. Cosnier, PLoS One, 2010, 5, e10476 Search PubMed.
- A. Kiray, I. Ergur, H. Tayefi, H. A. Bagriyanik and A. K. Bacakoglu, Acta. Orthop. Traumatol. Turc., 2013, 47, 405–410 CrossRef PubMed.
- C. Eriksson and H. Nygren, J. Biomed. Mater. Res., 1997, 37, 130–136 CrossRef CAS PubMed.
- Y. Liao, R. Pourzal, M. A. Wimmer, J. J. Jacobs, A. Fischer and L. D. Marks, Science, 2011, 334, 1687–1690 CrossRef CAS PubMed.
- A. Ooue, T. Ichinose-Kuwahara, A. K. M. Shamsuddin, Y. Inoue, T. Nishiyasu, S. Koga and N. Kondo, Eur. J. Appl. Physiol., 2007, 101, 97–103 CrossRef PubMed.
- A. Ooue, K. Ichinose Tomoko, Y. Inoue, T. Nishiyasu, S. Koga and N. Kondo, Eur. J. Appl. Physiol., 2008, 103, 367–373 CrossRef PubMed.
- P. D. Stein and H. N. Sabbah, Circ. Res., 1974, 35, 608–614 CrossRef CAS PubMed.
- X. Zhang and K. N. Houk, Acc. Chem. Res., 2005, 38, 379–385 CrossRef CAS PubMed.
- H. Oman, MRS Bull., 1999, 24, 33–39 CrossRef CAS.
- V. Coman, C. Vaz-Dominguez, R. Ludwig, W. Harreither, D. Haltrich, A. L. De Lacey, T. Ruzgas, L. Gorton and S. Shleev, Phys. Chem. Chem. Phys., 2008, 10, 6093–6096 RSC.
- A. J. Schwartz, Ann. Biomed. Eng., 1980, 8, 197–207 CrossRef CAS PubMed.
Footnotes |
| † Electronic supplementary information (ESI) available: Detailed experimental procedures and supplementary text including information about catalyst selection, analysis of biodevice performance and calculations; video files M1–M3. See DOI: 10.1039/c6ra17122b |
| ‡ An average of five measurements for the two-dimensional measurements, and for calculation of the blood-flow velocity, 24 s Doppler recordings during normal breathing at rest, were used. Averaged physico-chemical blood parameters are based on five measurements during different days, each done in triplicate. Data from ex vivo studies are based on three measurements in three different days. Proof-of-principle demonstration was done just in one day, but it was repeated three times using three different tubular biofuel cells and three different displays from one batch. About 100 bioelectrodes in total were shaped during our studies. Averaged open-circuit voltage and power density values are based on at least three measurements in vitro, and typical plots were obtained averaging the results from at least three different measurements with different electrodes. Less than 10% difference was observed, when actual steady-state measurements were used to evaluate the performance of enzymatic fuel cells in vitro, compared to linear sweep voltammetry measurements at the low scan rate of 1 mV s−1. |
| This journal is © The Royal Society of Chemistry 2016 |


