A comparative study of doping effects of V and Cr on a SrAlSi superconductor

Zhiping Lin, Shijie Shen, Kunkun Li, Han Zhang, Duanduan Yuan, Shifeng Jin* and Liwei Guo*
Research and Development Center for Functional Crystals, Beijing National Laboratory for Condensed Matter Physics, Institute, of Physics, Chinese Academy of Sciences, Beijing 100190, China

Received 4th July 2016 , Accepted 5th September 2016

First published on 5th September 2016


Abstract

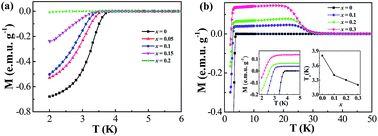
It is well known that the superconducting transition temperature (Tc) is very sensitive to the electronic density of states at the Fermi energy (N(EF)) and the Debye frequency (ΘD) for a BCS superconductor. However, which one plays a leading role in the ternary silicides AeMSi (Ae = Ca/Sr/Ba and M = Al/Ga) system is still unclear. Here, we report a comparative study of doping effects by V and Cr at Al sites in SrAlSi, which has a relatively high Tc among AeMSi systems. It is found that V and Cr atoms can be successfully introduced into SrAlSi with the actual solid solution limit up to 16 at% and 13 at%, respectively. In this case, the incorporation of V and Cr will have nearly identical effects in decreasing ΘD. Hall effect measurements demonstrate that V and Cr have dramatically different effects on the carrier concentration upon doping. In SrAl1−xVxSi, the carrier concentration is decreased by about three orders of magnitude and V dopants lead to the quenching of superconductivity at the highest doping level. In contrast, Cr almost does not change the carrier concentration, leading to a minor change in Tonsetc of 0.6 K. Our results provide solid evidence that the N(EF) should be responsible for the Tc in the transition metal doped AeMSi system.


Introduction

Since the discovery of superconductivity in MgB2 with a Tc of 39 K,1 widespread interests have been aroused to explore its isostructural intermetallic compounds with novel physical properties.1–9 MgB2 crystallizes in the P6/mmm space group and belongs to the AlB2 structural type, which is a common porotype for some transition metals and most lanthanide diborides. The AlB2-type crystal structure consists of alternate stacking of Al layers with triangular lattices and B layers with hexagonal rings. Besides borides, some silicides also possess the AlB2-type structure. For instance, CaSi2 has the AlB2-type structure under pressures over 16 GPa and becomes a superconductor with Tc = 14 K.3 Ternary silicides AeMSi with Ae = Ca/Sr/Ba and M = Al/Ga1,10,11 are also isostructural to AlB2, where M and Si commonly take the B sites while Ae occupies the Al sites. Among these ternary silicides, CaAlSi and SrAlSi show the relatively high Tc at 7.8 K4 and 4.2 K,5 respectively. Several interesting and important characteristics6 are revealed by close examination of these two superconductors. For example, opposite responses of Tc upon the application of pressures have been observed in these two compounds7 although their electronic structures6b,8 are similar. Thermodynamic measurements suggest a strong-coupling limit in CaAlSi while the weak coupling strength in SrAlSi.7,9 The Seebeck coefficient measurements10 of CaAlSi and SrAlSi indicate that the majority carriers in both are electron-like in contrast to the hole-like carriers in MgB2.11

For a BCS superconductor, chemical doping is an effective way to tune its superconducting properties. While the intrinsic characters of AeMSi materials are intensively investigated, the effects of transition metal dopants on their superconducting properties are far less understood. Lorenz et al. found the Tc reaches the maximum in CaAl2−xSix (0.6 < x < 1.2) compounds when x = 1, and a possible doping-induced electronic transition at x = 0.75.10 Recently, Li et al. studied the doping effect by Cu at the Al sites in CaAlSi12 with the maximum doping concentration of Cu reaching 6 at%. It was found that Cu doping slightly decreases Tc. However, it is unclear whether the N(EF) or the ΘD should play a decisive role without further quantitative results. To further explore the doping effects of the transition metal elements, we choose V and Cr to partially substitute Al in SrAlSi. The evolution of crystal structures, magnetic and transport properties of V-substituted and Cr-substituted SrAlSi compounds were carefully studied. We found that the actual solid solution limits of V and Cr in SrAlSi are 16 at% and 13 at%, respectively. V dopants ranging from 0 to 16 at% reduce the carrier concentration from 2.7 × 10²¹ electrons per cm3 to 5.5 × 10¹⁸ electrons per cm3. Correspondingly, Tonsetc decreases rapidly and superconductivity is quenched at the highest doping level. In comparison, Cr dopants ranging from 0 to 13 at% show almost no change in the carrier concentration and the maximum decrease in Tonsetc, 0.6 K, is attained at a Cr nominal dopant amount of ∼13 at%.

Experimental

Synthesis of SrAl1−xVxSi and SrAl1−xCrxSi compounds

SrAl1−xVxSi (x = 0, 0.05, 0.1, 0.15, 0.2 and 0.25) and SrAl1−xCrxSi (x = 0, 0.1, 0.2, 0.3 and 0.4) compounds were prepared by high temperature solid-state reactions. The reaction is detailed as follows: predetermined amounts of raw materials including strontium block (99%), aluminum powder (99.9%), vanadium powder (99.99%)/chromium powder (99.99%) and silicon powder (99.999%) were firstly mixed uniformly, then the mixture was pressed into a small thin disk with a diameter of about 1 cm. The disk was sealed into a silica tube under argon atmosphere ambient, and then it was put into a heater. The heater was raised to 950 °C and kept at this temperature for 2 days. The obtained samples were usually inhomogeneous after the first heating. So the samples were reground carefully in argon atmosphere ambient, pressed into pellets again and reheated at 950 °C for 7 days. The metal Sr is easy to volatilize at high temperatures, therefore extra 3% wt of Sr was added to complement the loss.

Powder X-ray crystallography

Room temperature powder X-ray diffraction (PXRD) data for samples SrAl1−xVxSi (x = 0, 0.05, 0.1, 0.15, 0.2 and 0.25) and SrAl1−xCrxSi (x = 0, 0.1, 0.2, 0.3 and 0.4) were collected on a PANalytical X'pert Pro diffractometer with Cu Kα radiation (40 kV, 40 mA) and a graphite monochromator. Rietveld refinements of data were performed with the FULLPROF package.

Characterization

Actual chemical compositions were determined by energy-dispersive X-ray analysis (EDX) and the morphologies were characterized by a scanning electron microscope (SEM).

Physical properties measurements

Electrical resistivity measurements were performed through the physical property measurement system (PPMS, Quantum Design) and magnetic susceptibilities were measured by a vibrating sample magnetometer (VSM, Quantum Design). The carrier concentration was measured by Hall effect measurement system at room temperature. Density of states (DOS) were calculated using CASTEP program code with plane-wave pseudopotential method13 and a generalized gradient approximation with Perdew–Burke–Ernzerhof formula (PBE) for the exchange–correlation potentials14 was adopted, where self-consistent field strength as 5 × 10⁻⁷ eV per atom was set.

Results and discussion

Fig. 1(a) displays PXRD patterns for a series of nominal SrAl1−xVxSi (x = 0, 0.05, 0.1, 0.15, 0.2 and 0.25) samples collected at room temperature. The analysis of PXRD patterns reveals that SrAlSi is the major phase in all samples, where most of diffraction peaks can be well indexed on AlB2 structure (space group: P6/mmm). Extremely weak peaks (marked by (*)) due to the second phase SrAl2O4 are present, which is hard to be eliminated. The relative intensity ratio between the strongest peak of SrAl2O4 and SrAlSi is less than 3%. When x = 0.25, however, massive impurities SrSi (marked by (×)) and Al45V7 (marked by (#)) appear. Emergence of massive impurity phases indicates the solid solution limit of V in SrAl1−xVxSi compounds is about x = 0.2. The inset of Fig. 1(a) is the magnified (100) diffractions of the samples, we found that the peak shifts gradually to the higher angle with increasing x till x = 0.2, suggesting the solid solution limit indeed exists and the lattice constant a shrinks with doping. Fig. S1 shows the Rietveld refinements for PXRD data of nominal SrAl1−xVxSi (x = 0, 0.05, 0.1, 0.15 and 0.2). All the crystallographic data are summarized in Table S2. In Fig. 1(b), we plotted the lattice constants a and c as a function of x, which are derived from structural refinements. It is observed that the lattice constant a decreases monotonically from 4.2415(4) Å to 4.2253(3) Å as x gradually varies from 0 to 0.2. We noted that the lattice constant c remains almost the same around 4.750 Å.
image file: c6ra17081a-f1.tif
Fig. 1 (a) PXRD patterns of nominal SrAl1−xVxSi (x = 0, 0.05, 0.1, 0.15, 0.2 and 0.25) compounds. The reflection peaks marked by (*), (×) and (#) are assigned to impurities SrAl2O4, SrSi and Al45V7, respectively. The inset is the magnified (100) reflections of SrAl1−xVxSi compounds. (b) The lattice constants a and c as a function of x in SrAl1−xVxSi compounds.

Fig. 2(a) shows PXRD patterns for a series of nominal SrAl1−xCrxSi (x = 0, 0.1, 0.2, 0.3 and 0.4) samples collected at room temperature. All strong peaks can be indexed with the same hexagonal AlB2 structure. The remaining weak peaks are attributed to side phases SrAl2O4 (marked by (*)) and SrCrO3 (marked by (o)). It is also noticed that a mass of impurity phases CrAl0.42Si1.58 and Cr5Si3 arise with x = 0.4. To reveal the evolution of the crystal structure with the increasing content of Cr, we selected the (100) diffraction peak from SrAl1−xCrxSi crystals to analyze the peak shift, as shown in the inset of Fig. 2(a). Similar to the case of V-doped samples, the (100) peak shifts to higher diffraction angle with increasing x. Fig. S2 shows the Rietveld refinements for PXRD data of nominal SrAl1−xCrxSi (x = 0, 0.1, 0.2, 0.3 and 0.4). All the crystallographic data are summarized in Table S3. The refined lattice parameters a and c of SrAl1−xCrxSi samples are shown in Fig. 2(b). The results showed that the lattice parameter a decreases from 4.2415(4) Å to 4.223(1) Å with increasing x till x = 0.3 and c keeps nearly a constant of 4.750 Å. We attributed the change in lattice parameters to the smaller radius of V and Cr atoms than Al atoms upon doping. The more Al atoms are replaced, the smaller the lattice constant a is. The interlayer spacing of SrAlSi is larger than the distance of intra layer atoms, indicating weaker interactions between interlayers. Accordingly the substitution for Al atoms by V/Cr atoms will bring negligible influence on the interlayer spacing. So the lattice constant c does not show prominent change. The SEM images of the SrAl1−xVxSi samples (Fig. S1) and the SrAl1−xCrxSi samples (Fig. S2) show that the morphology of the particles is the average size of the particles is around 3 μm. To further examine the exact contents of V and Cr in the samples, EDX (Table S1) and Rietveld refinements (Tables S2 and S3) were performed to evaluate the values of x in prepared SrAl1−xVxSi and SrAl1−xCrxSi compounds. As shown in Table S1, the actual solid solution limits of V and Cr in SrAlSi reach 16 at% and 13 at%, respectively. In SrAl1−xVxSi, the results of EDX analysis agree with the nominal contents within the experimental error. The refinement results are also in good accordance with the EDX results (Tables 1 and 2). Meanwhile, larger discrepancy appeared between the measured compositions and the nominal compositions of SrAl1−xCrxSi, which could be raised from the appearance of extra impurity SrCrO3 in the Cr doped system. The trend in variation of Cr measured contents is consistent with that in nominal contents.


image file: c6ra17081a-f2.tif
Fig. 2 (a) PXRD patterns of nominal SrAl1−xCrxSi (x = 0, 0.1, 0.2 0.3 and 0.4) compounds. The diffraction peaks marked by (*), (o), (∀) and (Δ) are assigned to impurities SrAl2O4, SrCrO3, CrAl0.42Si1.58 and Cr5Si3, respectively. The inset is the (100) reflections of SrAl1−xCrxSi compounds. (b) The lattice constants a and c as a function of x for SrAl1−xVxSi compounds.
Table 1 Comparison of nominal, refined and EDX characterized compositions for SrAl1−xVxSi (x = 0, 0.05, 0.1, 0.15 and 0.2) samples
V content (x)
Nominal EDX results Refined results
0 0 0
0.05 0.05 0.05(2)
0.10 0.11 0.11(2)
0.15 0.14 0.14(1)
0.20 0.16 0.16(1)


Table 2 Comparison of nominal, refined and EDX characterized compositions for SrAl1−xCrxSi (x = 0, 0.1, 0.2 and 0.3) samples
V content (x)
Nominal EDX results Refined results
0 0 0
0.10 0.09 0.09(2)
0.20 0.11 0.11(1)
0.30 0.13 0.13(1)


Fig. 3(a) shows the temperature dependence of susceptibility for zero-field-cooled (ZFC) V-doped samples at 40 Oe. In the high temperature range, the magnetic susceptibility is essentially flat and temperature independent, which is a Pauli paramagnet.5 Large diamagnetism due to superconductivity was observed and the temperature where the susceptibility starts to drop and deviate the temperature independent behaviour is defined as the Tonsetc. When x = 0, as is the case for SrAlSi, its Tonsetc is 3.8 K, which is close to the previously reported results.5 Furthermore, Tonsetc decreases monotonically as x increases. And when x reaches 0.2, the superconductivity almost disappears. In SrAl1−xVxSi, there only exists minor impurity SrAl2O4, which is a paramagnet15 and less than 3%. So we think that impurity SrAl2O4 will not affect the superconductivity. In addition, the measurements of magnetic susceptibility in SrAl1−xVxSi indicate a superconducting dome which is commonly observed in many superconductors. For example, BaAgxSi2−x2e which is a derivant of the AeMSi (Ae = Ca/Sr/Ba and M = Al/Ga) superconductors manifests a superconducting dome. When x changes from 0.2 to 0.4, the onset of superconducting transition varys from 3.19 K to 2.78 K, variation is about 0.4 K. When x increases to 0.5, the onset of superconducting transition drops to 1.22 K. The temperature dependence of ZFC magnetization for samples of SrAl1−xCrxSi, measured under the identical conditions as for V-doped samples, as shown in Fig. 3(b), where a magnetic transition signal at about 25 K is attributed to impurity SrCrO3.16 To see the variation of Tonsetc with Cr doping, a magnified magnetization curve around the Tonsetc is given in the inset of Fig. 3(b). It is noted that the Tonsetc just slightly decreases as x increases. When x increases to 0.3, Tonsetc reduces from 3.8 K to 3.2 K.


image file: c6ra17081a-f3.tif
Fig. 3 Temperature dependence of susceptibilities for the samples measured at 40 Oe. (a) SrAl1−xVxSi (x = 0, 0.05, 0.1, 0.15, and 0.2), (b) SrAl1−xCrxSi (x = 0, 0.1, 0.2 and 0.3). The inset of (a) displays x-depended Tonsetc. Insets of (b) display the enlarged magnetization at a narrow temperature range and x-depended Tonsetc.

Fig. 4(a) displays the temperature dependence of electrical resistivity (ρ) for SrAl1−xVxSi compounds. At the same temperature, the electrical resistivity of SrAl1−xVxSi compounds with bigger x is larger than that with lower x. The increasing electrical resistivity might be attributed to the decreased carrier concentration which will be mentioned in the latter and the incensement of crystal defects induced by the more substitutions of V for Al sites. In the high temperature range, the resistivity of SrAl1−xVxSi varies smoothly. Sharp drops of resistivity due to superconductivity were observed with lowered temperature and the temperature where the resistivity start to drop and deviate the normal state behaviours is defined as the Tonsetc. Tonsetc decreases rapidly with the increasing content of V, which is consistent with the results in Fig. 3(a). When x = 0.2, superconductivity almost disappears although a weak superconducting phase remains which probably results from the inhomogeneous compositions in the sample. Fig. 4(b) displays the temperature dependence of electrical resistivity for SrAl1−xCrxSi samples with various Cr concentrations. The increasing electrical resistivity with higher Cr content might be attributed to the impurities and the incensement of crystal defects. It was observed that the transition temperature shifts to lower temperature with the increasing content of Cr. When x = 0.3, the transition temperature reaches 3.4 K, which is in good agreement with the results of the magnetism measurements.


image file: c6ra17081a-f4.tif
Fig. 4 Temperature-dependent resistivity (ρ) of samples. (a) SrAl1−xVxSi (x = 0, 0.05, 0.1, 0.15 and 0.2) compounds, (b) SrAl1−xCrxSi (x = 0, 0.1, 0.2 and 0.3) compounds. Insets display the normalized resistivity (ρ/ρ5K). The inset of (a) displays x-depended Tonsetc.

In order to get insight into the doping effects, we investigate the carrier concentration of V-doped and Cr-doped samples by Hall effect measurements at room temperature, as shown in Table 3. For SrAl1−xVxSi, the carrier concentration is 2.7 × 10²¹ electrons per cm3 when x = 0, which is close to the concentration of CaAlSi.17 It decreases to 3.1 × 10²⁰ electrons per cm3 when x = 0.1 and continuously drops to 5.5 × 10¹⁸ electrons per cm3 when x = 0.2. In contrast, Cr dopant almost maintains the carrier concentration at the order of 1021 electrons per cm3 when x changes from 0 to 0.3 (shown in Table 4). These results are well explained by that the V atom has one less valence electron than the Cr atom.

Table 3 Carrier concentration at room temperature for a series of SrAl1−xVxSi (x = 0, 0.05, 0.1, 0.15 and 0.2) compounds
SrAl1−xVxSi
Nominal V content (x) Measured V content (x) Carrier concentration (electrons per cm3)
0 0 2.7 × 10²¹
0.05 0.05 5.6 × 10²⁰
0.10 0.11 3.1 × 10²⁰
0.15 0.14 8.8 × 10¹⁸
0.20 0.16 5.5 × 10¹⁸


Table 4 Carrier concentration at room temperature for a series of SrAl1−xCrxSi (x = 0, 0.1, 0.2 and 0.3) compounds
SrAl1−xCrxSi
Nominal Cr content (x) Measured Cr content (x) Carrier concentration (electrons per cm3)
0 0 2.7 × 10²¹
0.1 0.09 5.5 × 10²⁰
0.2 0.11 6.1 × 10²⁰
0.3 0.13 3.7 × 10²¹


In order to further explore the doping effects, the total and partial density of states of SrAlSi are calculated and plotted in Fig. 5. Prior to DOS calculation, we first made geometric relaxation by calculation based on density function theory. The lattice constants of SrAlSi are extracted to be a = b = 4.250 Å, c = 4.778 Å, which are slightly larger than the experimental data (aexp = bexp = 4.2415(4) Å, cexp = 4.750 Å). The errors are less than 1%, confirming the validity of our calculation. Partial density of states of SrAlSi indicates that all states included are strongly hybridized. Our calculated results for SrAlSi agree well with the previous ones.8a N(EF) would be affected by the doping of V/Cr inducing the shift of the Fermi energy of SrAlSi. We found a small peak in DOS above the Fermi level in SrAlSi, and the DOS at the Fermi level, N(EF), is 3.66 st. per eV per cell in SrAlSi. The decreasing carrier concentration through doping with V means that the Fermi surface is pushed to lower energy and results in the lower N(EF). Meanwhile, the N(EF) of SrAl1−xCrxSi is approximately the same to SrAlSi since the carrier concentration is almost unchanged through doping with Cr.


image file: c6ra17081a-f5.tif
Fig. 5 Total and partial density of states of SrAlSi.

SrAlSi, which has a relatively high Tc among AeMSi (Ae = Ca/Sr/Ba and M = Al/Ga) system, is a typical BCS superconductor. To explain the effects of V and Cr doping on SrAlSi, the BCS theory is applied to show the variation trend of Tc. According to the BCS theory, Tc = 1.13 ΘD[thin space (1/6-em)]exp (−1/N(EF)V), where ΘD is the Debye frequency, N(EF) is the electronic density of states at the Fermi level and V is the electron–phonon coupling potential. For SrAl1−xTmxSi (Tm = V/Cr), V are assumed to be constant since the actual doping content of Tm is less than 16%. In the case of SrAl1−xTmxSi (Tm = V/Cr), the incorporation of V and Cr will have nearly identical effect in decreasing ΘD, because the ΘD is proportional to M−1/2 (M is the atomic mass) and the atomic mass of V and Cr are nearly equal. In SrAl1−xCrxSi system, both the N(EF) and the Tonsetc are almost unchanged along with increased Cr dopants, indicating the ΘD has little influence on Tonsetc. Meanwhile, the carrier concentration in SrAl1−xVxSi is decreased about three orders of magnitude with doping and V dopants lead to the quenching of superconductivity. In contrast, Cr almost does not change the carrier concentration, leading to a minor change in Tonsetc of 0.6 K. With the comparison of SrAl1−xVxSi and SrAl1−xCrxSi, we can conclude that the N(EF) is the leading role of changing Tc in the AeMSi (Ae = Ca/Sr/Ba and M = Al/Ga) system. This result is consistent with the case of MgB2 superconductor. Slusky et al.18 found that introducing electrons into MgB2 through partial substitution of Al for Mg can rapidly destroyed superconductivity in MgB2. Our results provide solid evidences that the N(EF) should be responsible for the Tc in the transition metal doped AeMSi system.

Conclusions

In summary, SrAl1−xVxSi (x = 0, 0.05, 0.1, 0.15, 0.2 and 0.25) and SrAl1−xCrxSi (x = 0, 0.1, 0.2, 0.3 and 0.4) compounds were successfully synthesized by high temperature solid-state reactions to investigate the doping effects of V and Cr at Al sites on SrAlSi. The actual solid solution limits of V and Cr in SrAlSi are 16 at% and 13 at%, respectively. Particular attention was paid to the carrier concentration and the trend of Tc variation of SrAl1−xMxSi. In SrAl1−xVxSi, V decreases the carrier concentration by about three orders of magnitude and leads to the quenching of superconductivity at a V dopant level of x = 0.2. The lower N(EF) is responsible for the decreasing Tonsetc and the quenching superconductivity in SrAl1−xVxSi. In contrast, Cr does not significantly change the carrier concentration with increasing x till x = 0.3, which results in almost the same value of N(EF) of SrAlSi and makes the Tonsetc decrease only by 0.6 K. With the comparison of SrAl1−xVxSi and SrAl1−xCrxSi, we can conclude that the N(EF) is the leading role of changing Tc in the AeMSi (Ae = Ca/Sr/Ba and M = Al/Ga) system. These results reported here indicate the valence electrons of transition metal dopants have a profound effect on superconductivity and will offer clues to better understand the doping effect on superconductors and other related functional materials.

Acknowledgements

This work is financially supported by the National Natural Science Foundation of China (Grant No. 91422303, 51532010 and 51472266), the Strategic Priority Research Program (B) of the Chinese Academy of Sciences (Grant No. XDB07020100).

Notes and references

  1. J. Nagamatsu, N. Nakagawa, T. Muranaka, Y. Zenitani and J. Akimitsu, Nature, 2001, 410, 63–64 CrossRef CAS PubMed.
  2. (a) M. Imai, E. Abe, J. Ye, K. Nishida, T. Kimura, K. Honma, H. Abe and H. Kitazawa, Phys. Rev. Lett., 2001, 87, 077003 CrossRef CAS PubMed; (b) R. L. Meng, B. Lorenz, Y. S. Wang, J. Cmaidalka, Y. Y. Sun, Y. Y. Xue, J. K. Meen and C. W. Chu, Phys. C, 2002, 382, 113–116 CrossRef CAS; (c) R. L. Meng, B. Lorenz, J. Cmaidalka, Y. S. Wang, Y. Y. Sun, J. Lenzi, J. K. Meen, Y. Y. Xue and C. W. Chu, IEEE Trans. Appl. Supercond., 2003, 13, 3042–3046 CrossRef CAS; (d) M. J. Evans, Y. Wu, V. F. Kranak, N. Newman, A. Reller, F. J. Garcia-Garcia and U. Häussermann, Phys. Rev. B: Condens. Matter Mater. Phys., 2009, 80, 064514 CrossRef; (e) K. Kawashima, K. Inoue, T. Ishikawa, M. Fukuma, M. Yoshikawa and J. Akimitsu, J. Phys. Soc. Jpn., 2012, 81, 114717 CrossRef; (f) N. Tsujii, M. Imai, H. Yamaoka, I. Jarrige, H. Oohashi, T. Tochio, K. Handa, J. Ide, H. Atsuta, Y. Ito, H. Yoshikawa and H. Kitazawa, Chem. Mater., 2010, 22, 4690–4699 CrossRef CAS; (g) A. Ohmura, K. Fujimaki, F. Ishikawa, Y. Yamada, N. Tsujii and M. Imai, Phys. Rev. B: Condens. Matter Mater. Phys., 2011, 84, 104520 CrossRef; (h) X. L. Chen, Q. Y. Tu, M. He, L. Dai and L. Wu, J. Phys.: Condens. Matter, 2001, 13, L723 CrossRef CAS; (i) X. L. Chen, Q. Y. Tu, L. Dai and Y. P. Xu, Mod. Phys. Lett. B, 2002, 16, 73–77 CrossRef CAS.
  3. S. Sanfilippo, H. Elsinger, M. Núñez-Regueiro, O. Laborde, S. LeFloch, M. Affronte, G. L. Olcese and A. Palenzona, Phys. Rev. B: Condens. Matter Mater. Phys., 2000, 61, R3800–R3803 CrossRef CAS.
  4. M. Imai, K. Nishida, T. Kimura and H. Abe, Appl. Phys. Lett., 2002, 80, 1019–1021 CrossRef CAS.
  5. M. Imai, K. Nishida, T. Kimura, H. Kitazawa, H. Abe, H. Kitô and K. Yoshii, Phys. C, 2002, 382, 361–366 CrossRef CAS.
  6. (a) S. Kuroiwa, T. Hasegawa, T. Kondo, N. Ogita, M. Udagawa and J. Akimitsu, Phys. Rev. B: Condens. Matter Mater. Phys., 2008, 78, 184303 CrossRef; (b) G. Q. Huang, L. F. Chen, M. Liu and D. Y. Xing, Phys. Rev. B: Condens. Matter Mater. Phys., 2004, 69, 064509 CrossRef; (c) S. Kuroiwa, H. Sagayama, T. Kakiuchi, H. Sawa, Y. Noda and J. Akimitsu, Phys. Rev. B: Condens. Matter Mater. Phys., 2006, 74, 014517 CrossRef; (d) R. Heid, K. P. Bohnen, B. Renker, P. Adelmann, T. Wolf, D. Ernst and H. Schober, J. Low Temp. Phys., 2007, 147, 375–386 CrossRef CAS.
  7. B. Lorenz, J. Cmaidalka, R. L. Meng and C. W. Chu, Phys. Rev. B: Condens. Matter Mater. Phys., 2003, 68, 014512 CrossRef.
  8. (a) I. I. Mazin and D. A. Papaconstantopoulos, Phys. Rev. B: Condens. Matter Mater. Phys., 2004, 69, 180512 CrossRef; (b) G. Q. Huang, L. F. Chen, M. Liu and D. Y. Xing, Phys. Rev. B: Condens. Matter Mater. Phys., 2005, 71, 172506 CrossRef.
  9. (a) A. K. Ghosh, Y. Hiraoka, M. Tokunaga and T. Tamegai, Phys. Rev. B: Condens. Matter Mater. Phys., 2003, 68, 134503 CrossRef; (b) S. Tsuda, T. Yokoya, S. Shin, M. Imai and I. Hase, Phys. Rev. B: Condens. Matter Mater. Phys., 2004, 69, 100506 CrossRef.
  10. B. Lorenz, J. Lenzi, J. Cmaidalka, R. L. Meng, Y. Y. Sun, Y. Y. Xue and C. W. Chu, Phys. C, 2002, 383, 191–196 CrossRef CAS.
  11. B. Lorenz, R. L. Meng, Y. Y. Xue and C. W. Chu, Phys. Rev. B: Condens. Matter Mater. Phys., 2001, 64, 052513 CrossRef.
  12. Y. Lihong, D. Cheng, L. Hongrui, H. Bing and C. Hong, Supercond. Sci. Technol., 2008, 21, 015010 CrossRef.
  13. J. Clark Stewart, D. Segall Matthew, J. Pickard Chris, J. Hasnip Phil, I. J. Probert Matt, K. Refson and C. Payne Mike, Journal, 2005, 220, 567 Search PubMed.
  14. J. P. Perdew, K. Burke and M. Ernzerhof, Phys. Rev. Lett., 1996, 77, 3865–3868 CrossRef CAS PubMed.
  15. (a) A. R. Schulze and H. M. Buschbaum, Z. Anorg. Allg. Chem., 1981, 475, 205–210 CrossRef CAS; (b) V. Zhurov, A. Bush, S. Ivanov, S. STEFANOVICH and B. Romanov, Phys. Solid State, 1991, 33, 960–963 Search PubMed.
  16. B. L. Chamberland, Solid State Commun., 1967, 5, 663–666 CrossRef CAS.
  17. M. Imai, E.-H. S. Sadki, H. Abe, K. Nishida, T. Kimura, T. Sato, K. Hirata and H. Kitazawa, Phys. Rev. B: Condens. Matter Mater. Phys., 2003, 68, 064512 CrossRef.
  18. J. S. Slusky, N. Rogado, K. A. Regan, M. A. Hayward, P. Khalifah, T. He, K. Inumaru, S. M. Loureiro, M. K. Haas, H. W. Zandbergen and R. J. Cava, Nature, 2001, 410, 343–345 CrossRef CAS PubMed.

Footnote

Electronic supplementary information (ESI) available. See DOI: 10.1039/c6ra17081a

This journal is © The Royal Society of Chemistry 2016
Click here to see how this site uses Cookies. View our privacy policy here.