Pre-coating with protein fractions inhibits nano-carrier aggregation in human blood plasma

L. K. Müllera, J. Simona, S. Schöttlerab, K. Landfestera, V. Mailänder *ab and K. Mohr*a
aMax Planck Institute for Polymer Research, Ackermannweg 10, 55128 Mainz, Germany. E-mail: volker.mailaender@unimedizin-mainz.de; mohr@mpip-mainz.mpg.de
bDermatology Clinic, University Medical Center Mainz, Langenbeckstraße 1, 55131 Mainz, Germany

Received 2nd July 2016 , Accepted 27th September 2016

First published on 30th September 2016


Abstract

The success of a nanomaterial designed for biomedical applications depends strongly on its “biological identity” meaning the physicochemical properties the material adopts after contact with a physiological medium e.g. blood. Critical issues are here the size stability of the nanomaterial against aggregation in blood induced by blood proteins and the composition of the protein corona. These factors further determine the particles' fate in vivo and in vitro. While this has been seen to occur inevitably we demonstrate here that a preformed and hereby predetermined protein corona steers the nanomaterials behavior concerning aggregation in human blood plasma and uptake behavior in macrophages. Fractionation of human blood plasma was applied to enrich human serum albumin (HSA), immunoglobulin G (IgG) as well as various low abundant protein mixtures. The exact composition of these protein fractions was analyzed via quantitative, label-free liquid-chromatography mass-spectrometry (LC-MS). The protein fractions were further applied to form a predetermined protein corona on differently functionalized polystyrene nanoparticles. The change of the nanoparticles' physicochemical properties after incubation with the defined protein fractions or whole human plasma was studied by dynamic light scattering (DLS) to determine size changes. DLS was also used to investigate the stability of the protein-coated nanoparticles when reintroduced in human plasma. In addition, we found that cellular uptake of nanomaterials was strongly influenced by the artificially created protein corona.

Introduction

While it has been shown that many factors of the “synthetic identity” of nanoparticles like size,1 shape,2 hardness3 and surface charge4 influence the cellular uptake of nanoparticles, it became more and more clear that this is largely mediated by a protein coat that defines the “biological identity” within an applied system.5–9 When nanomaterials enter the blood stream they are immediately covered by a layer of proteins which is commonly referred to as the protein corona and this protein layer contributes to the biological identity of the nanomaterial within the applied system.5–7,10

The protein corona principally consists of two parts: the so called “hard” and “soft” corona which differ in the binding strength of the corona proteins to the nanomaterial.11–13 Complementary, physicochemical characterization techniques are required to gain a full picture of the protein corona which will then in turn lead to a better understanding of the effective biological identity. The “hard” corona can be analyzed with methods like SDS-PAGE or quantitative, label-free liquid-chromatography mass spectrometry (LC-MS) where the nanomaterial is extracted from the interaction medium by e.g. centrifugation. Sakulkhu et al. also reported on using a magnetic separator for the separation of coated superparamagnetic iron oxide nanoparticles (SPIONs).14 The “soft” corona can only be investigated with non-invasive techniques like dynamic light scattering which can directly be performed within a biological media.15–17

While there is a lot of research done regarding a better understanding of the protein corona, the biological relevant single proteins of corona remains still under investigation. Only recently the impact of specific corona components on the nanomaterial's interaction with cellular surfaces is being elucidated.17 Likely, specific proteins or protein groups interfere with cellular uptake and modify the interaction between particles themselves which in turn also influence their intracellular and in vivo biodistribution.18–20 The relation between corona composition and in vitro as well as in vivo behavior has been recently discussed.16,19,21,22 Exemplarily, for surfactant-coated poly(methyl[2-14C]methacrylate) nanoparticles it was shown that the immune cell response could be enhanced or reduced, depending on the composition of the formed protein corona after blood plasma exposure.23 It could also be shown that the adsorption of apolipoproteins on poly(alkyl cyanoacrylate) nanoparticles leads to an interaction with LDL receptors resulting in enhanced transport across the blood brain barrier.24 Other groups have also reported that the same nanoparticles can induce a different biological outcome regarding cytotoxicity and immunotoxicity in dependence of the presence or absence of a protein corona.25 In addition, body distribution and clearance rate of nanomaterial-derived drug carriers are significantly influenced by the protein corona formed.19,26,27 In this connection Laganà and coworkers pointed out, that the predominant presence of apolipoproteins in the corona of lipid nanoparticles can direct a receptor-mediated uptake into prostate carcinoma cells exhibiting high levels of HDL receptors.28 Kelly et al. developed a complex mapping procedure for the investigation of epitope availability of adsorbed proteins.29 On the other hand, Salvati et al. called attention to the loss of targeting functionality of transferrin-conjugated nanoparticles when exposed to biological media containing proteins, which might shield the targeting molecules.7 Similar results were found for dextran coated SPIONs.30 Extra complexity retrieves from the fact that proteins present in biological fluids are glycosylated in high amounts due to enzymatic or chemical reactions. Very recently, Wan et al. analyzed the role of glycans present in the protein corona of SiO2 nanoparticles on their cell interactions.31

Adsorption of proteins to surfaces can induce conformal changes meaning that denaturation of the proteins will occur.32,33 The consequence of the denaturation will be that proteins will alter the way they work, e.g. loose enzymatic activity,34 changing specificity of the binding for other proteins and even exposing cryptantigens for immunological attack.35

It is known that macrophages – which are present in tissue and which are derived from monocytes in blood – play a critical role regarding blood circulation time by having the ability to take up nanoparticles by several mechanisms,36,37 one of the most interesting uptake mechanisms is called phagocytosis. This process removes foreign materials from the bloodstream and is triggered by size as well as by the adsorption of a specific class of proteins called “opsonins” on the nanomaterials' surface (e.g. IgG).38,39 To overcome the issue of opsonization and to prevent unwanted uptake by macrophages, the composition and impact of the protein corona formed on a nanomaterial's surface has to be understood. Lunov et al. showed that the adsorption of IgG on polystyrene nanoparticles leads to an interaction with the Fc surface receptor (CD64) and initiates phagocytosis by human macrophages.40 In another study, the plasma protein fetuin is found to be involved in cellular uptake of polystyrene nanospheres in liver macrophages (Kupffer cells).41 Bertoli et al. suggested, that the majority of the original protein corona formed on silica coated magnetite nanoparticles upon serum exposition remains constant during the intracellular trafficking in human lung carcinoma epithelial A549 cells.42

These studies demonstrate the importance of the protein corona and how the protein corona can vary for different materials. However, there is still much about the protein corona which we do not know including the highly dynamic process of corona-transformation during exposure to different body tissues with different protein compositions,43–45 the connection between corona composition and individual plasma46,47 and if a protein corona can be “artificially” created in a stable manner. Creating a stable “artificial” protein corona could be of special interest for nanomaterials that are designed to treat certain diseases, as the blood proteome composition of patients differs from the one of healthy individuals.47,48

Herein, we provide the first known report of creating a tailor-made artificial protein corona. This could have the potential advantage that a preformed corona could be established on nanocarriers on an individual basis for patients ex vivo and no foreign proteins would be used. Fractionation of proteins from the patient's own plasma could be a readily available method and avoid all the immunological and legal implementations that are associated with bringing foreign proteins into a medical application. In this study we fractionated human blood plasma into multiple components in order to enrich single proteins as well as defined protein fractions. Two well-known chromatography techniques were used, that are both based on affinity chromatography. Already in 1972, protein A chromatography was introduced for IgG purification49 and since then became a standard procedure for antibody purification.50 The second technique uses a sepharose–blue dextran conjugate for the removal of human serum albumin from human blood plasma. The method was introduced by Travis et al. in 1973, who highlighted the importance of quantitative HSA removal from human blood plasma or serum as it can interfere the detection of lower abundant proteins.51

The protein corona consisting of soft and hard corona formed after exposure to various protein mixtures and human plasma was investigated by dynamic light scattering (DLS). Clearly all manipulations like washing or even centrifugation may alter the soft corona or even remove it completely. Therefore other results like protein detection by SDS-PAGE can only give the picture of the hard protein corona. The obtained protein fractions were subsequently incubated with several polystyrene nanoparticles with different surface functionalities. Incubating the nanomaterial with a specific protein or protein fraction effectively created a hard protein corona on the material. Specifically, we designed various predetermined protein coronas to alter cellular uptake by macrophages and to study the influence of a preformed protein corona on particle stability in human plasma using DLS.

Results and discussion

Fractionation of human blood plasma: creating a set of well-defined protein fractions

Plasma fractionation is a widely used process to enrich specific components from human plasma like immunoglobulins used in medicine for treating hypoimmunoglobulinemia or coagulation factors to treat bleeding disorders. The proteome of these fractions is significantly altered with a wide variety in purity depending on the methodology used and the target protein.52

Here, human blood plasma was fractionated by applying affinity chromatography. The two most abundant proteins, human serum albumin (HSA) (60% of plasma proteome) and immunoglobulin G (IgG) (16% of plasma proteome) were isolated and highly complex protein mixtures with various low abundant proteins were created. For the further discussion the enriched fractions of isolated proteins/protein mixtures are named as FProtein, whereas the plasma fractions depleted from certain proteins are denominated as FPlasma-w/o-Protein. Immunoglobulin G (IgG) was separated from the complex plasma mixture with a protein A affinity chromatography column (Fig. 1 top).50,53 We obtained a protein fraction (FIgG) consisting of more than 94% IgG and another remaining plasma protein mixture (FPlasma-w/o-IgG) with an IgG amount of just 5%. A comprehensive list of the LC-MS data is presented in the ESI. By applying an AffiBlue column (Fig. 1 bottom) HSA could be isolated.54 LC-MS analysis as well as characterization of the different protein fractions via gel-electrophoresis (ESI Fig. S1) showed that the AffiBlue column also has an affinity to bind IgG. Therefore, we isolated a protein mixture consisting of 35% immunoglobulins, 47% HSA and 18% other proteins (FHSA/IgG). Via a series connection of the protein A and the AffiBlue column the remaining IgG content could be reduced from 35% to 4% in the isolated HSA fraction (FHSA) (Fig. 1). In relation to the total plasma protein concentration both proteins could be isolated with a purity of over 84% (Table 1). A full list of the LC-MS data is presented in the ESI. Table 1 presents the fractions obtained, their hydrodynamic radius determined by DLS as well as their composition obtained by LC-MS.


image file: c6ra17028e-f1.tif
Fig. 1 Fractionation of human blood plasma. Human blood plasma was applied to a protein A column (top) or to AffiGel Blue (bottom) to obtain immunoglobulin or albumin depleted plasma. Protein fractions were analysed by SDS-PAGE and LC-MS.
Table 1 Obtained protein fractions with their hydrodynamic radius (Rh) and composition according to LC-MS
Fraction Protein Hydrodynamic radius
FIgG 94.2% Ig 〈1/Rhz−1 = 6.8 nm
0.56% HSA
5.24% others
FHSA 84.14% HSA 〈1/Rhz−1 = 3.1 nm
3.58% Ig
12.28% others
FHSA/IgG 47.39% HSA 〈1/Rhz−1 = 3.7 nm
34.6% Ig
18.01% others
FPlasma-IgG 56.92% HSA 〈1/Rhz−1 = 7.6 nm
5.87% Ig
1.85% fibrinogen
35.36% others
FPlasma-HSA 4.08% HSA 〈1/Rhz−1 = 7.6 nm
27.7% Ig
4.51% serotransferrin
13.38% alpha-1-antitrypsin
0.33% others


Synthesis of different functionalized polystyrene nanoparticles and pre-coating with distinct protein fractions

Three different functionalized polystyrene particles were synthesized via direct miniemulsion copolymerization, namely without surface modification (PS) and with amino (PS–NH2) or carboxy-functionalization (PS–COOH). For stabilization of the different particle dispersions Lutensol AT50 was used as a non-ionic surfactant. Fig. 2 shows the physicochemical parameters of the different particles regarding hydrodynamic radius (Rh) determined by dynamic light scattering, charge obtained by ζ potential measurements and amount of surface groups per nm2 quantified by titration. 1 mM KCl solution has an approximately neutral pH. Under these conditions, the carboxy-groups of PS–COOH are deprotonated resulting in the detected negative charge, while the amine groups in PS–NH2 are extensively protonated and thus positively charged.
image file: c6ra17028e-f2.tif
Fig. 2 TEM images and physicochemical characterization of polystyrene nanoparticles with different surface functionalization.

Furthermore, we modified polystyrene particles by coating the surface of nanoparticles with the obtained protein fractions to create the so called “artificial protein corona”. Nanoparticles were incubated with different protein fractions or individual proteins for 1 h at 37 °C (5 × 10⁻³ m2 overall surface area per mg protein). Afterwards, unbound and weakly bound proteins were removed via centrifugation and the particle pellet was resuspended in buffer. The resulting pre-coated nanoparticles were characterized regarding their ζ potential as well as their size (Fig. 3).


image file: c6ra17028e-f3.tif
Fig. 3 Physicochemical parameters of nanoparticles pre-coated with different protein fractions or individual proteins.

Evaluating the aggregation behavior of nanoparticles in the presence of human plasma or different protein fractions

All polystyrene particles were investigated pertaining to the formation of a protein corona in human plasma as well as in various protein fractions. With dynamic light scattering it was possible to directly monitor size increase of nanoparticles in the respective protein fractions or full human plasma. Data were evaluated by applying the method according to Rausch et al.55 who already demonstrated in cooperation amongst others with our group, that the aggregation behavior detected by DLS can be correlated to the in vivo body distribution of polystyrene particles in mice.16

Briefly, the autocorrelation function of the polystyrene particles under investigation can be described by a sum of two exponentials whereas the autocorrelation function (ACF) in the case of human plasma can be perfectly fitted by a sum of three exponentials.

If the ACF of human plasma or the protein mixture and the one of the respective polystyrene particle are known, the mixture of both can be studied. If no aggregation occurs, both components in the resulting mixture co-exist and the corresponding ACF can be described as the sum of the two individual ACFs with known parameters for the two mixture-components named as force fit.

If the interactions of plasma proteins with polystyrene particles result in larger sizes, the resulting mixture can no longer be described as a co-existence of the individual compounds and an additional term to describe the ACF is needed.

It has to be noted that the additional size formed in the respective mixture can be either caused by nanoparticle bridging or the adsorption of proteins or protein–protein aggregates onto the nanomaterial surface.56 In Fig. 4 the autocorrelation functions of a mixture of the respective polystyrene nanoparticle and FPlasma-w/o-IgG-HSA (A) or human plasma (B) are shown exemplary. Measurements were performed at 37 °C for better in vivo mimicking. The force fit (indicated by the red line, Fig. 4A) could perfectly describe the ACF of the mixture of nanoparticles and FPlasma-w/o-IgG-HSA. In contrast, an additional aggregate fraction (indicated by the blue line, Fig. 4B) was observed for the mixture of particles and plasma.


image file: c6ra17028e-f4.tif
Fig. 4 (A) Upper graphs: ACFs of the different particles in isolated FPlasma-w/o-IgG-HSA at Θ = 60° including data points (●) and the forced fit as the sum of the individual components (red). Lower graphs: corresponding residuals resulting from the difference between data and fit. (B) Upper graphs: ACFs of the different particles in human plasma at Θ = 60° including data points (●), forced fit (red) and fit with additional aggregate function (blue). Lower graphs: corresponding residuals resulting from the difference between data and the two fits.

Fig. 5 sums up the DLS results of all uncoated particles after direct exposure to the different protein fractions. In addition, measurements were also performed in human plasma and commercially (com.) available proteins in buffer. It has to be noted that the ratio of protein amount per surface area of the nanoparticles was kept constant for all measurements (5 × 10⁻⁴ m2 overall surface area of the different nanoparticles per mg protein). Human plasma was the sole exception as it was used undiluted in order to monitor in vivo conditions.


image file: c6ra17028e-f5.tif
Fig. 5 Size changes of the uncoated nanoparticles after direct exposure to human plasma or the obtained protein fractions was measured by DLS. Size increase of nanoparticles incubated in the respective protein fraction is calculated based on the size value for the uncoated nanoparticles measured in PBS (reference value Fig. 2). ‘Com.’ refers to commercially available proteins (IgG and HSA). * Concentrated human plasma for in vivo mimicking.

First of all, it was noted that all uncoated particles aggregated in human plasma. A size increase with values between Rh(Agg) = 174 nm and Rh(Agg) = 292 nm was measured. From literature it is already known, that many factors influence the interactions between proteins and nanoparticles. These factors include the size of the nanomaterial representing different surface curvatures12 or surface charge.57 But more and more it became clear, that the main driving forces for protein adsorption are hydrophobic interactions. In general, hydrophobic particles show increased protein coverage compared to hydrophilic particles.58 This could be an explanation for the similar aggregation behavior of the three different polystyrene particles in concentrated human plasma despite their different surface charges.

Next, it was found that the un-functionalized polystyrene particle changes its size in nearly every protein fraction. In contrast, the amino functionalized particle remained stable except in the presence of IgG. Mahmoudi et al. summarized, that some positive NPs are recognized by opsonins very rapidly,59 which might explain the influence of IgG on PS–NH2 stability. But also other groups reported on the strong interactions of NH2-functionalized latex with IgG even though proteins with isoelectric points <5.5 like ApoA-I preferentially adsorb on positively charged particles.19,60

Also noticeable in Fig. 5 there is a very slight size increase for some samples that is less than 100%. As an example, PS–COOH increases its size about 45% in FPlasma-w/o-IgG. As already pointed out, the additional size formed in the respective mixture can be either caused by nanoparticle bridging or the adsorption of proteins or protein–protein aggregates onto the nanomaterial surface. In order to better understand the ongoing process of particle size increase, PS–COOH in FPlasma-w/o-IgG was examined in more detail exemplarily. The question was addressed, whether the small size increase is caused by protein adsorption only or by the formation of some bridged nanoparticles due to an incomplete surface coverage of PS–COOH. The amount of proteins per given surface area of 5 × 10⁻⁴ m2 was varied from 0.25 mg to 4 mg. The size increases obtained from DLS measurements are shown in Fig. 6. The corresponding autocorrelation functions are found in the ESI (see Fig. S8).


image file: c6ra17028e-f6.tif
Fig. 6 Influence of size increase of nanoparticles in relation to the protein amount present in solution.

As a general trend it was observed, that the size increase of PS–COOH in FPlasma-w/o-IgG was more pronounced with increasing amount of present proteins during incubation. For very low protein concentrations (see sample A and B) a size increase of 24–27% was observed. This corresponds to 12–17 nm. The newly formed species contributed 99% to the overall scattered light at Θ = 30°, leading to the assumption that the size increase during incubation with very low protein concentrations is caused by the formation of a protein layer. When the amount of proteins was increased to 1 mg (sample C, marked with star as it represents also the conditions used in Fig. 3) or 2 mg (sample D) per given surface area, the PS–COOH particles increased ∼60% in radius. For 1 mg, the particles predominated the scattered light at Θ = 30° with a contribution of I% = 75%, while for 2 mg the aggregates predominated with I% = 62%. This indicates that with increasing amount of proteins, the degree of aggregation increases. In addition, the overall size increase contradicts the assumption of incomplete surface coverage leading to bridged nanoparticles for the determined size increase of PS–COOH in FPlasma-w/o-IgG. The presumption that bridged nanoparticles by single proteins are not the origin for the observed small size increases becomes even more likely when looking at sample E and F in Fig. 6. These samples represent the highest amount of proteins during incubation of PS–COOH particles in FPlasma-w/o-IgG. The observed size-increase amounts 127–194% and again, the aggregates predominated the scattered light for very high protein concentrations (sample F). All in all, the DLS results suggest that with very low concentration the proteins adsorb onto the nanomaterials' surface and tend to induce protein–protein aggregation on the nanoparticles that also involves the accumulation of particles when the protein amount is increased. The absence of a detected size increase does not mean that there is no corona present. It cannot be detected due to the sensitivity of the methods. It is only possible to detect additional sizes in the plasma/particle mixture if the intensity fractions (i.e. amplitudes) of the newly formed complexes surpass the detection limit for DLS. In detail, intensity fractions between 3% (for sizes outside the size range of the original components) and 20% (for sizes in the size range of the original components) of newly formed particles are necessary to be detected by the described fitting procedure.

In order to investigate the stability of the artificially preformed protein corona under physiological conditions, pre-coated nanoparticles (characterized in Fig. 3) were exposed to human plasma and the size increase was measured by DLS.

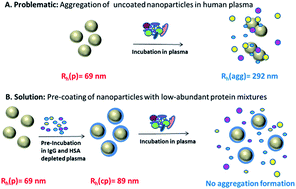
We found that the amino-functionalized as well as the un-functionalized particle could be stabilized against aggregation via a pre-coating with FPlasma-w/o-IgG-HSA (Fig. 7). This is of great interest as the original particles formed aggregates in human plasma in the size range of Rh(Agg)PS = 292 nm and Rh(Agg)PS–NH2 = 195 nm. In contrast, we were not able to stabilize the carboxy-functionalized particle against aggregation in human plasma via pre-coating with FPlasma-IgG-HAS as there were aggregates formed in a size range of Rh(Agg)PS–COOH = 168 nm.


image file: c6ra17028e-f7.tif
Fig. 7 Size changes of pre-coated particles after direct exposure to plasma. Intensity fractions of the aggregate I(30°) are exemplified for a scattering angle of 30°. Size increase is calculated based on the values for uncoated nanoparticles (see Fig. 2) or pre-coated nanoparticles in PBS (see Fig. 3).

Most intriguingly PS–COOH and PS–NH2 pre-coated with IgG also remained stable after exposure to human plasma. However, those particles showed a size increase after pre-coating in contrast to PS and PS–NH2 particles pre-coated with FPlasma-w/o-IgG-HSA (Fig. 3). In addition, the example of PS–COOH coated with FPlasma-w/o-IgG shows that increasing amounts of proteins used for pre-coating do not alter the stability of nanoparticles in human plasma (see Fig. S9).

The principal method to stabilize nanoparticles against aggregation in human plasma via pre-coating with an artificial protein corona is illustrated in Fig. 8. Furthermore, the autocorrelation functions of the uncoated as well as the pre-coated PS particles in human plasma are shown exemplary.


image file: c6ra17028e-f8.tif
Fig. 8 Pre-coating of nanoparticles with distinct low abundant protein fractions stabilizes nanoparticles against aggregation in human plasma. (A) DLS analysis demonstrates aggregation formation of PS particles in human plasma. ACF of PS particles in human plasma at Θ = 30° is shown. (B) Pre-coating of PS particles with FPlasma-w/o-IgG-HSA prevents the formation of aggregates. ACFs of the PS particles in isolated FPlasma-w/o-IgG-HSA at Θ = 30° is illustrated.

Tailoring the properties of the hard protein corona

To study the hard protein corona, nanoparticles were incubated with human plasma or the respective protein fractions. Particles bound with proteins were separated from free protein via centrifugation and redispersed in PBS. Zeta potentials, amount of adsorbed protein and the hard protein corona pattern were analyzed. In agreement with results found in literature17 the surface charge indicated by the zeta-potential after the incubation in human plasma is the same whereas prior to incubation differences related to the surface functionalization were measured. Detailed information about the zeta potentials for all nanoparticles incubated with different protein fractions are summarized in Fig. S5–S7. The change in the detected zeta-potentials makes clear, why the different PS-particles show similar aggregation behavior in concentrated human plasma independent of their surface functionalization. When the nanomaterial is introduced into plasma (or a respective protein fraction), the surface is covered with proteins and the initial surface charge hidden by the protein corona.

It turned out, that the hard corona formed in FPlasma-w/o-IgG-HSA has a zeta potential that is in the range of the ones formed in whole human plasma, providing an indication that those low abundant proteins besides HSA and IgG probably make up the particles' protein corona.

The amount of bound proteins after incubation in human plasma was quantified via Pierce 660 nm assay. Interestingly, the hard corona of all particles formed after exposure to human plasma contains nearly the same amount of proteins for all particles (Table 2). This is in agreement with current studies from Huang et al., who reported on similar total protein amounts adsorbed on polystyrene nanoparticles bearing carboxyl or rather amine groups on their surface.61

Table 2 Hard protein corona analysis after incubation of nanoparticles in human plasma. Determination of the zeta potential and amount of adsorbed protein on nanoparticles using Pierce 660 nm assay
  PS–Lut PS–COOH PS–NH2
ξ potential/mV −38 ± 2 −32 ± 3 −35 ± 4
Amount of adsorbed proteins (μg) per particles surface area (0.05 m2) 275 ± 1 μg/0.05 m2 299 ± 16 μg/0.05 m2 326 ± 24 μg/0.05 m2


When analyzing the formed hard protein corona on our polystyrene particles via LC-MS, the differences between the particles becomes apparent (Fig. 9). While the protein pattern of PS and PS–NH2 are very similar, the one of PS–COOH differs a lot. The exact composition can be found in the ESI. The LC-MS data showed almost no IgG and HSA enrichment on the three PS particles after incubation in full plasma (see also ESI), which supports the assumption of mostly low abundant proteins tending to adsorb.


image file: c6ra17028e-f9.tif
Fig. 9 Plasma composition in comparison to the hard corona composition of each particle analyzed via LC-MS.

As previously reported by our group16 but also by Dawson and coworkers,26 amine-modified PS particles tend to adsorb mostly lipoproteins on their surface. Similar results were found for our particles in citrate stabilized human plasma as well. Carboxy-modified particles are reported to also have high enrichment of coagulation proteins.16 Despite being also valid for our results, we found an even more pronounced relative amount of coagulation factors (e.g. fibrinogen). This can be related to the use of plasma in our study instead of serum.16,62

Further, we investigated the hard protein corona profile after incubation in human plasma (Fig. 10A) as well as in the different protein fractions (Fig. 10B) by applying gel electrophoresis.


image file: c6ra17028e-f10.tif
Fig. 10 Protein corona profile of nanoparticles incubated with human plasma (A) or different protein fractions (B). L1 = PS; L2 = PS–COOH; L3 = PS–NH2 nanoparticles incubated with human blood plasma; L4 = PS–NH2 incubated with FPlasma-IgG or L5 = PS–NH2 incubated with FPlasma-HSA. SeeBlue Plus2 Pre-Stained Standard was used as protein marker (MW = molecular weight in kDa).

As seen in Fig. 10 for the carboxy-functionalized particle a high diversity of proteins in the hard corona (molecular weight ratio of 6–188 kDa) was obtained. In contrast, the protein corona pattern of un-functionalized as well as amino-functionalized polystyrene particles looks similar in agreement with the LC-MS data. Here, the protein corona pattern is dominated by distinct proteins with a molecular weight ratio of 25–60 kDa. In addition, Fig. 10 shows the protein pattern of the hard corona formed in FPlasma-IgG and FPlasma-HSA exemplarily for the amino-functionalized particle. The results show, that the protein corona pattern varies with the pool of proteins present in the pre-incubation medium.

Investigating the influence of pre-coating on cellular uptake

A murine macrophage-like cell line (RAW 264.7) was used to study whether it is possible to specifically trigger cellular uptake by pre-coating of nanoparticles with different protein fractions obtained after plasma fractionation. We chose deliberately a phagocytotic active cell line with RAW 264.7 cells. We had chosen this cell line as we had seen that results concerning uptake with different protein sources were comparable with primary cells, in these cases dendritic cells. Clearly one would need to check a larger array of cell types or use a complex cell mixture like peripheral blood or spleen cells from mice in order to get closer to an in vivo setting. Flow cytometry analysis gave quantitative information about uptake behavior (Fig. 11) and confocal laser scanning microcopy (Fig. 12) was used to visualize the uptake process.
image file: c6ra17028e-f11.tif
Fig. 11 Flow cytometry analysis of RAW 264.7 cells incubated with uncoated or pre-coated nanoparticles for 2 h in DMEM without additional proteins. Nanoparticles were pre-incubated with individual proteins (A) or protein fractions (B) separated from unbound proteins via centrifugation and added to the cells with a nanoparticle concentration of 75 μg mL−1. Relative median fluorescence intensity (rMFI) values are shown as mean ± SD of three independent experiments. The red line serves as a reference for cellular uptake of uncoated nanoparticles (rMFI = 1). Statistical analysis is described in detail in the Material/Methods section.

image file: c6ra17028e-f12.tif
Fig. 12 cLSM images of RAW264.7 cells after incubation with pre-coated nanoparticles for 2 h in DMEM without additional proteins. Exemplary shown for PS pre-coated with IgG (A); PS–COOH pre-coated with IgG (B); PS–NH2 pre-coated with HSA (C). Scale bars = 10 μm.

All particles were pre-incubated with individual proteins (Fig. 11A) or different protein fractions (Fig. 11B) prior to macrophage uptake studies. To ensure the absence of any additional proteins cellular uptake studies were carried out in medium without plasma or serum proteins. To demonstrate the effect of pre-coating, cellular uptake behavior of the uncoated (“naked”) particles is represented by the red line in Fig. 11.

In general, un-functionalized and amino-functionalized particles (Fig. 11) showed similar uptake trends after pre-incubation. Especially, pre-incubation with FHSA (6) and FIgG/HSA (7) caused strongly enhanced cellular uptake (p < 0.001***) in comparison to uncoated (“naked”) particles. There was no significant size increase observed for PS and PS–NH2 particles (Fig. 3) pre-coated with FHSA. As cellular uptake was strongly altered due to pre-incubation with FHSA, we are able to illustrate that cellular uptake is triggered by protein adsorption. Confocal laser scanning microscopy (Fig. 12) confirmed the intracellular localization of the pre-coated nanoparticles. Analog results were obtained for PS–COOH particles pre-coated with FHSA (6) and FIgG/HSA (7); although this effect was not as significant (p < 0.05*) as for PS and PS–NH2. In addition, pre-coating with FIgG (7) caused increasing cellular uptake for PS and PS–NH2 compared to uncoated particles. Hence, there was a size increase measured after particles were pre-incubated with FIgG (Rh values, Fig. 3). Therefore, we are not able to clearly demonstrate that cellular uptake is triggered by the adsorption of IgG or if uptake behavior is altered due to the size increase. Going further, we studied the influence of pre-coating with various low-abundant protein fractions (Fig. 11B). Here, we found that pre-coating with some protein fractions resulted in significant decreased cellular uptake (p < 0.001**) compared to uncoated nanoparticles. This effect was caused by the low abundant protein fraction FPlasma-w/o-HSA-IgG for PS and PS–NH2 particles. In contrast, pre-coating of PS–COOH with FPlasma-w/o-HSA-IgG revealed no significant influence on uptake behavior. Interestingly, pre-coating of PS–COOH with FPlasma-w/o-IgG caused strongly reduced uptake compared to uncoated particles. Importantly, there was no size change (Fig. 3) observed of PS/PS–NH2 pre-coated with FPlasma-w/o-HSA-IgG and PS–COOH pre-incubated with FPlasma-w/o-IgG. This highlights that cellular uptake is strongly influenced by adsorption of the less abundant plasma proteins on the nanoparticles' surface.17,63

In addition, we analyzed whether the pre-coating ratio between nanoparticles and proteins had an effect on cellular uptake behavior. Exemplary shown in Fig. 13, PS–COOH nanoparticles were pre-coated with varying amounts of Ig depleted plasma. A strong correlation between the amount of proteins used for pre-coating and cellular uptake was found (Fig. 13). Going down to a pre-coating ratio of 150 μg proteins per of 5 × 10⁻³ NP surface area (1), we even did not see a significant difference between the uptake behavior of coated and uncoated NP. Clearly, the strongest influence on uptake behavior was found for nanoparticles pre-coated with the chosen ratio of 5 × 10⁻³ m2 overall surface area per mg protein (described in Material/Methods).


image file: c6ra17028e-f13.tif
Fig. 13 Flow cytometry analysis of RAW 264.7 cells incubated with nanoparticles pre-coated with varying amounts of Ig depleted plasma for 2 h in DMEM without additional proteins. Different pre-coating ratios1 between the amount of proteins (in mg) and the defined surface of nanoparticles (5 × 10⁻³ m2) were chosen. The pre-coated nanoparticles were isolated via centrifugation and added to the cells with a nanoparticle concentration of 20 μg mL−1. Relative median fluorescence intensity (rMFI) values are shown as mean ± SD of three independent experiments. The red line serves as a reference for cellular uptake of uncoated nanoparticles (rMFI = 1). Statistical analysis is described in detail in the Material/Methods section.

Experimental

Materials

Dulbecco's phosphate buffered saline (DPBS) without calcium and magnesium was purchased from Gibco/Life Technologies, Germany. The human blood plasma, prepared according to standard guidelines, was obtained from the blood transfusion service at the University Clinic of Mainz/Germany and aliquots stored at −80 °C before used. A total protein concentration of 66 g L−1 was determined by using a BCA Protein Macro Assay Kit (SERVA Electrophoresis, Germany). Human Serum Albumin (HSA) as well as Trizma® hydrochloride solution was purchased from Sigma Aldrich, USA. Protein solution of fibrinogen (Aventis Behring) and immunoglobulin G (Privigen®, 10% solution, CSL Behring, USA) were prepared with DPBS or running buffer at concentrations of 1 g L−1.

Fractionation of human blood plasma

For separation of IgG a ToyoScreen AF-rProtein A HC-650F column (1 mL; Tosoh Bioscoience, Germany) was used with 0.01 M Tris·HCl (pH = 7.4) as running buffer (RB). The column was run as recommended by the manufacturer at 3 bar which was achieved with a flow rate of 0.5 mL min−1. Before loading a sample, the HPLC system was purged with running buffer for 30 min until the baseline was constant over time.

Human blood plasma was diluted 1[thin space (1/6-em)]:[thin space (1/6-em)]3 and filtered with LCR 450 nm filters to remove possible protein-aggregates. To avoid overload, only 0.5 mL of sample were loaded on the column. The maximum load was determined prior to use at 0.7 mL 1[thin space (1/6-em)]:[thin space (1/6-em)]3 diluted plasma which corresponds to 2.3 mg IgG. The flow through was collected between 60 s and 270 s. After waiting for several minutes, 2 mL of 0.2 M citric acid were injected. One minute after injection IgG was collected for 2 min and the fraction neutralized with 330 μL 1 M tris base solution.

For separation of albumin a ToyoScreen AF-Blue HC-650M column (5 mL; Tosoh Bioscience, Germany) was used with the similar running buffer as described earlier. Prior to use, the column was washed with 20 mL deuterium oxide as well as 20 mL 2 M guanidine. After running the system for 30 min with running buffer (3 bar, 0.5 mL min−1) until the baseline was constant over time, 0.5 mL of 1[thin space (1/6-em)]:[thin space (1/6-em)]2 diluted plasma was injected in order to achieve a concentrated flow through. The flow through was collected between 4:00 and 12:00 min. 4.5 min after the injection of 7 mL 2 M NaCl albumin was collected for 6 min.

Protein quantification

Protein concentrations in human plasma as well as in different fractions were determined with a BCA Protein Macro Assay Kit from SERVA electrophoresis, Germany, according to manufacturer. Absorption at 562 nm was measured with a Tecan infinite M1000. The protein amount in the particles' hard corona was quantified via Pierce® 660 nm Protein Assay from Thermo SCIENTIFIC according to manufacturer. Absorption at 660 nm was measured with a Tecan infinite M1000.

Liquid-chromatography mass-spectrometry (LC-MS)

Proteins were digested following the protocol of Tenzer et al.64 with following modifications: 25 μg of each protein sample was precipitated and trypsin was used with a 1[thin space (1/6-em)]:[thin space (1/6-em)]50 ratio (enzyme[thin space (1/6-em)]:[thin space (1/6-em)]protein). For LC-MS analysis the samples were diluted 10-fold with aqueous 0.1% formic acid and spiked with 50 fmol μL−1 Hi3 EColi Standard (Waters Corporation, Germany) for absolute quantification. Quantitative analysis of protein samples was performed using a nanoACQUITY UPLC system coupled with a Synapt G2-Si mass spectrometer (Waters Corporation). Tryptic peptides were separated on the nanoACQUITY system equipped with a C18 analytical reversed-phase column (1.7 μm, 75 μm × 150 mm, Waters Corporation) and a C18 nanoACQUITY Trap Column (5 μm, 180 μm × 20 mm, Waters Corporation). Samples were processed with mobile phase A consisting of 0.1% (v/v) formic acid in water and mobile phase B consisting of acetonitrile with 0.1% (v/v) formic acid. The separation was performed at a sample flow rate of 0.3 μL min−1, using a gradient of 2–37% mobile phase B over 70 min. As a reference compound 150 fmol μL−1 Glu-Fibrinopeptide was infused at a flow rate of 0.5 μL min−1.

Data-independent acquisition (MSE) experiments were performed on the Synapt G2-Si operated in resolution mode. Electrospray ionization was performed in positive ion mode using a NanoLockSpray source. Data was acquired over a range of m/z 50–2000 Da with a scan time of 1 s, ramped trap collision energy from 20 to 40 V with a total acquisition time of 90 min. All samples were analyzed in two technical replicates. Data acquisition and processing was carried out using MassLynx 4.1 and TansOmics Informatics software was used to process data and identify peptides. Data were post acquisition lock mass corrected. Noise reduction thresholds for low energy, high energy and peptide intensity were fixed at 120, 25, and 750 counts, respectively. During database searches, the protein false discovery rate was set at 4%. The generated peptide masses were searched against a reviewed human protein sequence database downloaded from Uniprot. The following criteria were used for the search: one missed cleavage, maximum protein mass 600 kDa, fixed carbamidomethyl modification for cysteine and variable oxidation for methionine. For identification a peptide was required to have at least three assigned fragments and a protein was required to have at least two assigned peptides and five assigned fragments. Quantitative data were generated based on the TOP3/Hi3 approach.65 Quantitative data were generated based on the TOP3/Hi3 approach,65 providing the amount of each protein in fmol.

Synthesis of PS particles

A direct miniemulsion co-polymerization method according to previously published work was used to synthesize functionalized as well as non-functionalized polystyrene nanoparticles (NP). Briefly, a total monomer amount of 6 g was used for each particle. In case of the non-functionalized NP this means 6 g styrene (Merck, Germany). For the functionalized particles, 5.88 g styrene and 0.12 g functionalized co-monomer were used. For the preparation of negatively charged polystyrene nanoparticles, acrylic acid (Aldrich, USA), 252 mg hexadecane (Aldrich), 5 mg arcBODIPY (for measurements that didn't need a fluorescent dye it was omitted) and 100 mg V59 (Wako chemicals, Japan) as initiator were added to a solution of 0.6 g Lutensol AT50 (BASF, Germany) in 24 mL water under vigorous stirring to prepare PS–COOH NPs. For the synthesis of positively charged polystyrene nanoparticles, 2-aminoethyl methacrylate hydrochloride (AEMH; Aldrich, Germany) was added to the water phase and combined with the disperse phase as described above to prepare PS–NH2. After combining water and disperse phase, each preparation was stirred for one hour and the emulsions afterwards ultrasonificated for two minutes at 90% intensity (Branson Sonifier, 1/2′′ tip, 450 W). After polymerization at 72 °C for 12 h, the NPs were purified by centrifugation and redispersion in water three times (13[thin space (1/6-em)]000 rpm, 3–4 h).

Transmission electron microscopy (TEM)

Transmission electron microscopy was carried out with a JEOL JEM-1400 electron microscope operating at an acceleration voltage of 120 kV. The samples were prepared by diluting the 1 wt% dispersion 1[thin space (1/6-em)]:[thin space (1/6-em)]50 with water. One droplet was placed on a 300 mesh carbon-coated copper grid and dried overnight.

Dynamic light scattering (DLS)

All light scattering experiments were done with an instrument consisting of HeNe laser (632.8 nm), an electronically controlled goniometer and an ALV-5000 multiple tau full-digital correlator with 320 channels (ALV-GmbH, Langen, Germany). The solutions for the light scattering experiments were prepared in a dust free flowbox. Protein solutions as well as human plasma were filtered through Millex GS 220 nm filters into cylindrical quartz cuvettes (20 mm diameter, Hellma, Müllheim). Particle dispersion were diluted 1[thin space (1/6-em)]:[thin space (1/6-em)]1000 in the respective protein mixture or running buffer/PBS and measured without filtering to avoid changes within the system under investigation.

Particle charge detection (PCD)

The amount of amine or carboxyl groups on the particle surface was calculated from titration performed on a particle charge detector PCD 02 (Mütek GmbH Germany) combined with a Titrino Automatic Titrator 702 SM (Metrohm AG Switzerland). Carboxyl groups were titrated against positively charged poly(diallyl dimethyl ammonium chloride) (PDADAMC) while amino groups were titrated against negatively charged polyelectrolyte standard sodium poly(ethylene sulfonate) (Pes-Na). 10 mL of the dispersion under investigation with a solid content of 1 g L−1 were titrated.

Zeta potential

For determination of the zeta (ζ) potential of the different polystyrene nanoparticles a Malvern zetasizer nano series instrument was used. 20 μL of the respective dispersion was diluted in 2 mL 1 mM KCl and filled into appropriate disposable folded capillary cells.

Protein corona preparation

Each nanoparticle was diluted with water to a constant particle surface concentration (0.05 m2 in 200 μL). The dispersion was incubated with human plasma or the obtained protein fractions at constant ratio of particle surface area to protein amount (5 × 10⁻³ m2 particle surface area per mg protein) for 1 h at 37 °C with constant agitation. Unbound proteins in the supernatant were separated from particles by centrifugation at 20[thin space (1/6-em)]000g for 30 min. The protein coated nanoparticle pellet was resuspended in running buffer for further DLS measurements and cellular uptake experiments. To identify the hard corona proteins by SDS-PAGE and LC-MS, the pellet was resuspended with PBS and washed by three centrifugation steps at 20[thin space (1/6-em)]000g for 30 min. Extensive washing is required to ensure all unbound or loosely bound proteins are removed. After the third centrifugation step there was no detectable amount of protein determined in the supernatant indicating that only nanoparticles bound with the hard corona proteins were isolated. Proteins were eluted from the nanoparticles by dissolving the pellet in 300 μL of buffer (7 M urea, 2 M thiourea, 4% CHAPS). The amount of proteins was quantified using Pierce 660 nm Protein Assay (Thermo Scientific; Germany) according to manufacturer's instructions and proteins were identified by SDS-PAGE and LC-MS.

SDS polyacrylamide gel electrophoresis (SDS-PAGE)

For SDS PAGE 6.5 μL of the protein sample was mixed with 2.5 μL NuPAGE LDS Sample Buffer and 1 μL NuPAGE Sample Reducing Agent and applied onto a NuPAGE 10% Bis Tris Protein Gel (all Novex, Thermo Fisher Scientific, USA). The electrophoresis was carried out in NuPAGE MES SDS Running Buffer at 100 V for 2 h with SeeBlue Plus2 Pre-Stained Standard (Invitrogen, USA) as a molecular marker. The gel was stained using SimplyBlue SafeStain (Novex, Thermo Fisher Scientific).

Macrophages

Murine macrophage-like cells (RAW 264.7) were kept in Dulbecco's modified eagle medium (DMEM, Invitrogen, USA) supplement with 10% fetal bovine serum (FBS, Sigma Aldrich, USA) and 1% penicillin/streptomycin (Invitrogen, USA). Cells were grown in humidified incubator at 37 °C and 5% CO2.

Flow cytometry

1 × 10⁵ cells per mL (RAW 264.7) were allowed to attach in six-well plates (2 mL per well). After 12 h the cells were washed with DPBS to remove all proteins from FBS and kept in DMEM without additional proteins. Pre-coated nanoparticles (75 μg mL−1) were added to cells and incubated for 2 h. For further flow cytometry analysis, cells were washed with DPBS, detached with trypsin (Invitrogen, USA), centrifuged (4 min, 266g) and resuspended in DPBS. Flow cytometry measurements were performed on a CyFlow ML cytometer (Partec, Germany) with a 488 nm laser to excite the fluorescent labelled nanoparticles and a 527 nm pass filter for emission detection (fluorescence channel 1 FL1). With FCS Express V4 (DeNovo Software, USA) cells were selected on a forward scatter/sideward scatter plot, thereby excluding cell debris. The gated events were further analyzed in the FL1 channels. The median in the FL1 channel (MFI) was determined from a 1D histogram as a relative figure for the amount of nanoparticles taken up or associated with cells.

As different nanoparticles contained different amounts of dye, the fluorescence intensity for each particle was measured with a Tecan Infinite R M1000 PRO microplate reader with standard settings of the software iControl® at an excitation and emission wavelengths of 523 nm and 536 nm. The fluorescence intensity values of each nanoparticle (FINP) were further normalized (nFINP) to the fluorescence intensity value for PS particles (FIPS) to further normalize the median fluorescence intensity (MFI) obtained from flow cytometry measurements. The following eqn (1) and (2) were used:

 
image file: c6ra17028e-t1.tif(1)
 
image file: c6ra17028e-t2.tif(2)

For each cell uptake experiment the normalized median fluorescence intensity values nMFI of uncoated nanoparticles (nMFI) was determined to compare nMFI values of pre-coated particles from different cell experiments. According to this, relative fluorescence intensity values rMFI were calculated with the eqn (3):

 
image file: c6ra17028e-t3.tif(3)

Confocal laser scanning microscopy (cLSM)

1 × 10⁵ cells per mL (RAW 264.7) were seeded in Ibidi iTreat μ-dishes (IBIDI, Germany) for 24 h, washed with PBS and kept in DMEM without additional proteins 75 μg mL−1 pre-incubated nanoparticles were added to cells for 2 h. Afterwards cells were washed with PBS three times and stained with CellMask Orange (CMO, stock solution: 5 mg mL−1 in DMSO, Invitrogen, USA) which labeled the cell membrane red. CMO (0.2 μL) was diluted with one mL of Hanks' Balanced Salt solution (HBSS, Life Technologies, USA). After adding the diluted staining solution (400 μL) to cells, live cell images were taken on a Leica TCS SP5 II microscope with an HC PL APO CS 63×/1.4 oil objective using the software LAS AF 3000 software. The fluorescence signals of nanoparticles (excitation: 488 nm, pseudo colored green) and CMO (excitation: 561 nm, pseudo colored red) were detected in a serial scan mode at 502–534 nm and 579–642 nm.

Statistical analysis

Data is shown as the mean of three biological independent experiments ± SD. GraphPad Prism 5 software was used for statistical analysis performing a one-way ANOVA followed by Tukey's post hoc multiple comparisons test. A p-value of <0.05 was considered as significant*.

Conclusions

In the first part of our study, a concise method was described to fractionate human blood plasma into several plasma fractions using only two columns. We were able to obtain protein mixtures where the highest abundant proteins were removed. In the second part we studied the interaction of three different nanoparticles with the obtained protein fractions. With DLS we were able to monitor size changes of nanoparticles in the presence of human plasma or different protein fractions. We discovered aggregation formation for all nanoparticles if they were exposed to human plasma. Hence, we identified certain low abundant protein fractions which did not cause a size increase if particles were incubated with these protein mixtures. Next, we found that pre-coating of nanoparticles with those identified protein fractions enabled a stabilization against aggregation in human plasma for PS and PS–NH2 particles. With this, we present a method to overcome the issue of nanoparticle aggregation under physiological conditions. It was demonstrated that the stability of a respective nanoparticle can be tailored via an artificially created protein corona, enabling a successful biomedical applications of nanoparticles.

In the last part, we showed that uptake behavior is critically altered due to pre-coating of nanoparticles with distinct protein fractions. We identified proteins (e.g. HSA) which caused a significant increase in uptake. More interestingly, on the other side we were able to demonstrate that uptake is significantly decreased if particles are pre-coated with certain low abundant protein fractions.

Taken together, we were able to show that an artificially created protein corona can enable the stabilization of nanoparticles against aggregation in human plasma and moreover, offers the possibility to specifically trigger cellular uptake behavior.

Acknowledgements

We acknowledge the Deutsche Forschungsgemeinschaft (DFG) SFB 1066 as funding agency for funding the project Q1 and Q2. The authors thank Christine Rosenauer, Dr Karl Fischer and Prof. Dr M. Schmidt for continuous support and fruitful scientific discussions. Thanks to Katja Klein for particle synthesis and Christoph Siebert for TEM measurements.

Notes and references

  1. S. Lerch, M. Dass, A. Musyanovych, K. Landfester and V. Mailander, Polymeric nanoparticles of different sizes overcome the cell membrane barrier, Eur. J. Pharm. Biopharm., 2013, 84, 265–274 CrossRef CAS PubMed.
  2. L. Florez, C. Herrmann, J. M. Cramer, C. P. Hauser, K. Koynov, K. Landfester, D. Crespy and V. Mailander, How Shape Influences Uptake: Interactions of Anisotropic Polymer Nanoparticles and Human Mesenchymal Stem Cells, Small, 2012, 8, 2222–2230 CrossRef CAS PubMed.
  3. S. Lorenz, C. P. Hauser, B. Autenrieth, C. K. Weiss, K. Landfester and V. Mailander, The softer and more hydrophobic the better: influence of the side chain of polymethacrylate nanoparticles for cellular uptake, Macromol. Biosci., 2010, 10, 1034–1042 CrossRef CAS PubMed.
  4. A. Schrade, V. Mailander, S. Ritz, K. Landfester and U. Ziener, Surface roughness and charge influence the uptake of nanoparticles: fluorescently labeled Pickering-type versus surfactant-stabilized nanoparticles, Macromol. Biosci., 2012, 12, 1459–1471 CrossRef CAS PubMed.
  5. M. P. Monopoli, C. Aberg, A. Salvati and K. A. Dawson, Biomolecular coronas provide the biological identity of nanosized materials, Nat. Nanotechnol., 2012, 7, 779–786 CrossRef CAS PubMed.
  6. Z. H. Liu, Y. P. Jiao, T. Wang, Y. M. Zhang and W. Xue, Interactions between solubilized polymer molecules and blood components, J. Controlled Release, 2012, 160, 14–24 CrossRef CAS PubMed.
  7. A. Salvati, A. S. Pitek, M. P. Monopoli, K. Prapainop, F. B. Bombelli, D. R. Hristov, P. M. Kelly, C. Aberg, E. Mahon and K. A. Dawson, Transferrin-functionalized nanoparticles lose their targeting capabilities when a biomolecule corona adsorbs on the surface, Nat. Nanotechnol., 2013, 8, 137–143 CrossRef CAS PubMed.
  8. A. Musyanovych, J. Dausend, M. Dass, P. Walther, V. Mailander and K. Landfester, Criteria impacting the cellular uptake of nanoparticles: a study emphasizing polymer type and surfactant effects, Acta Biomater., 2011, 7, 4160–4168 CrossRef CAS PubMed.
  9. G. Baier, D. Baumann, J. M. Siebert, A. Musyanovych, V. Mailander and K. Landfester, Suppressing Unspecific Cell Uptake for Targeted Delivery Using Hydroxyethyl Starch Nanocapsules, Biomacromolecules, 2012, 13, 2704–2715 CrossRef CAS PubMed.
  10. M. Hadjidemetriou, Z. Al-Ahmady, M. Mazza, R. F. Collins, K. Dawson and K. Kostarelos, In Vivo Biomolecule Corona around Blood-Circulating, Clinically Used and Antibody-Targeted Lipid Bilayer Nanoscale Vesicles, ACS Nano, 2015, 9, 8142–8156 CrossRef CAS PubMed.
  11. S. Milani, F. B. Bombelli, A. S. Pitek, K. A. Dawson and J. Radler, Reversible versus irreversible binding of transferrin to polystyrene nanoparticles: soft and hard corona, ACS Nano, 2012, 6, 2532–2541 CrossRef CAS PubMed.
  12. T. Cedervall, I. Lynch, S. Lindman, T. Berggård, E. Thulin, H. Nilsson, K. A. Dawson and S. Linse, Understanding the nanoparticle–protein corona using methods to quantify exchange rates and affinities of proteins for nanoparticles, Proc. Natl. Acad. Sci. U. S. A., 2007, 104, 2050–2055 CrossRef CAS PubMed.
  13. M. Lundqvist, J. Stigler, G. Elia, I. Lynch, T. Cedervall and K. A. Dawson, Nanoparticle size and surface properties determine the protein corona with possible implications for biological impacts, Proc. Natl. Acad. Sci. U. S. A., 2008, 105, 14265–14270 CrossRef CAS PubMed.
  14. U. Sakulkhu, M. Mahmoudi, L. Maurizi, J. Salaklang and H. Hofmann, Protein corona composition of superparamagnetic iron oxide nanoparticles with various physico-chemical properties and coatings, Sci. Rep., 2014, 4, 5020 CAS.
  15. S. Winzen, S. Schoettler, G. Baier, C. Rosenauer, V. Mailaender, K. Landfester and K. Mohr, Complementary analysis of the hard and soft protein corona: sample preparation critically effects corona composition, Nanoscale, 2015, 7, 2992–3001 RSC.
  16. K. Mohr, M. Sommer, G. Baier, S. Schöttler, P. Okwieka, S. Tenzer, K. Landfester, V. Mailänder, M. Schmidt and R. Meyer, Aggregation behavior of polystyrene-nanoparticles in human blood serum and its impact on the in vivo distribution in mice, J. Nanomed. Nanotechnol., 2014, 5, 192–203 Search PubMed.
  17. S. Ritz, S. Schottler, N. Kotman, G. Baier, A. Musyanovych, J. Kuharev, K. Landfester, H. Schild, O. Jahn, S. Tenzer and V. Mailander, Protein corona of nanoparticles: distinct proteins regulate the cellular uptake, Biomacromolecules, 2015, 16, 1311–1321 CrossRef CAS PubMed.
  18. D. Walczyk, F. B. Bombelli, M. P. Monopoli, I. Lynch and K. A. Dawson, What the Cell “Sees” in Bionanoscience, J. Am. Chem. Soc., 2010, 132, 5761–5768 CrossRef CAS PubMed.
  19. P. Aggarwal, J. B. Hall, C. B. McLeland, M. A. Dobrovolskaia and S. E. McNeil, Nanoparticle interaction with plasma proteins as it relates to particle biodistribution, biocompatibility and therapeutic efficacy, Adv. Drug Delivery Rev., 2009, 61, 428–437 CrossRef CAS PubMed.
  20. E. Markovsky, H. Baabur-Cohen, A. Eldar-Boock, L. Omer, G. Tiram, S. Ferber, P. Ofek, D. Polyak, A. Scomparin and R. Satchi-Fainaro, Administration, distribution, metabolism and elimination of polymer therapeutics, J. Controlled Release, 2012, 161, 446–460 CrossRef CAS PubMed.
  21. E. Mahon, A. Salvati, F. B. Bombelli, I. Lynch and K. A. Dawson, Designing the nanoparticle–biomolecule interface for “targeting and therapeutic delivery”, J. Controlled Release, 2012, 161, 164–174 CrossRef CAS PubMed.
  22. A. S. Pitek, D. O'Connell, E. Mahon, M. P. Monopoli, F. Baldelli Bombelli and K. A. Dawson, Transferrin coated nanoparticles: study of the bionano interface in human plasma, PLoS One, 2012, 7, e40685 CAS.
  23. D. Leu, B. Manthey, J. Kreuter, P. Speiser and P. P. DeLuca, Distribution and elimination of coated polymethyl[2-14C]methacrylate nanoparticles after intravenous injection in rats, J. Pharm. Sci., 1984, 73, 1433–1437 CrossRef CAS PubMed.
  24. J. Kreuter, Influence of the surface properties on nanoparticle-mediated transport of drugs to the brain, J. Nanosci. Nanotechnol., 2004, 4, 484–488 CrossRef CAS PubMed.
  25. Y. K. Lee, E. J. Choi, T. J. Webster, S. H. Kim and D. Khang, Effect of the protein corona on nanoparticles for modulating cytotoxicity and immunotoxicity, Int. J. Nanomed., 2015, 10, 97–113 Search PubMed.
  26. M. Lundqvist, J. Stigler, G. Elia, I. Lynch, T. Cedervall and K. A. Dawson, Nanoparticle size and surface properties determine the protein corona with possible implications for biological impacts, Proc. Natl. Acad. Sci. U. S. A., 2008, 105, 14265–14270 CrossRef CAS PubMed.
  27. C. D. Walkey and W. C. Chan, Understanding and controlling the interaction of nanomaterials with proteins in a physiological environment, Chem. Soc. Rev., 2012, 41, 2780–2799 RSC.
  28. A. L. Barrán-Berdón, D. Pozzi, G. Caracciolo, A. L. Capriotti, G. Caruso, C. Cavaliere, A. Riccioli, S. Palchetti and A. Laganá, Time evolution of nanoparticle–protein corona in human plasma: relevance for targeted drug delivery, Langmuir, 2013, 29, 6485–6494 CrossRef PubMed.
  29. P. M. Kelly, C. Åberg, E. Polo, A. O'Connell, J. Cookman, J. Fallon, Ž. Krpetić and K. A. Dawson, Mapping protein binding sites on the biomolecular corona of nanoparticles, Nat. Nanotechnol., 2015, 10, 472–479 CrossRef CAS PubMed.
  30. M. Mahmoudi, S. Sheibani, A. S. Milani, F. Rezaee, M. Gauberti, R. Dinarvand and H. Vali, Crucial role of the protein corona for the specific targeting of nanoparticles, Nanomedicine, 2015, 10, 215–226 CrossRef CAS PubMed.
  31. S. Wan, P. M. Kelly, E. Mahon, H. Stöckmann, P. M. Rudd, F. Caruso, K. A. Dawson, Y. Yan and M. P. Monopoli, The “Sweet” Side of the Protein Corona: Effects of Glycosylation on Nanoparticle–Cell Interactions, ACS Nano, 2015, 9, 2157–2166 CrossRef CAS PubMed.
  32. N. Brandes, P. B. Welzel, C. Werner and L. W. Kroh, Adsorption-induced conformational changes of proteins onto ceramic particles: differential scanning calorimetry and FTIR analysis, J. Colloid Interface Sci., 2006, 299, 56–69 CrossRef CAS PubMed.
  33. L. Treuel and G. U. Nienhaus, Toward a molecular understanding of nanoparticle–protein interactions, Biophys. Rev., 2012, 4, 137–147 CrossRef CAS.
  34. A. A. Vertegel, R. W. Siegel and J. S. Dordick, Silica nanoparticle size influences the structure and enzymatic activity of adsorbed lysozyme, Langmuir, 2004, 20, 6800–6807 CrossRef CAS PubMed.
  35. Z. J. Deng, M. Liang, M. Monteiro, I. Toth and R. F. Minchin, Nanoparticle-induced unfolding of fibrinogen promotes Mac-1 receptor activation and inflammation, Nat. Nanotechnol., 2011, 6, 39–44 CrossRef CAS PubMed.
  36. M. S. Ehrenberg, A. E. Friedman, J. N. Finkelstein, G. Oberdörster and J. L. McGrath, The influence of protein adsorption on nanoparticle association with cultured endothelial cells, Biomaterials, 2009, 30, 603–610 CrossRef CAS PubMed.
  37. D. Dutta, S. K. Sundaram, J. G. Teeguarden, B. J. Riley, L. S. Fifield, J. M. Jacobs, S. R. Addleman, G. A. Kaysen, B. M. Moudgil and T. J. Weber, Adsorbed proteins influence the biological activity and molecular targeting of nanomaterials, Toxicol. Sci., 2007, 100, 303–315 CrossRef CAS PubMed.
  38. H. Patel, Serum opsonins and liposomes: their interaction and opsonophagocytosis, Crit. Rev. Ther. Drug Carrier Syst., 1991, 9, 39–90 Search PubMed.
  39. G. Sahay, D. Y. Alakhova and A. V. Kabanov, Endocytosis of nanomedicines, J. Controlled Release, 2010, 145, 182–195 CrossRef CAS PubMed.
  40. O. Lunov, T. Syrovets, C. Loos, J. Beil, M. Delacher, K. Tron, G. U. Nienhaus, A. Musyanovych, V. Mailander, K. Landfester and T. Simmet, Differential uptake of functionalized polystyrene nanoparticles by human macrophages and a monocytic cell line, ACS Nano, 2011, 5, 1657–1669 CrossRef CAS PubMed.
  41. S. Nagayama, K. Ogawara, K. Minato, Y. Fukuoka, Y. Takakura, M. Hashida, K. Higaki and T. Kimura, Fetuin mediates hepatic uptake of negatively charged nanoparticles via scavenger receptor, Int. J. Pharm., 2007, 329, 192–198 CrossRef CAS PubMed.
  42. F. Bertoli, G. L. Davies, M. P. Monopoli, M. Moloney, Y. K. Gun'ko, A. Salvati and K. A. Dawson, Magnetic Nanoparticles to Recover Cellular Organelles and Study the Time Resolved Nanoparticle–Cell Interactome throughout Uptake, Small, 2014, 10, 3307–3315 CrossRef CAS PubMed.
  43. C. Ge, J. Tian, Y. Zhao, C. Chen, R. Zhou and Z. Chai, Towards understanding of nanoparticle–protein corona, Arch. Toxicol., 2015, 89, 519–539 CrossRef CAS PubMed.
  44. M. Lundqvist, J. Stigler, T. Cedervall, T. Berggård, M. B. Flanagan, I. Lynch, G. Elia and K. Dawson, The evolution of the protein corona around nanoparticles: a test study, ACS Nano, 2011, 5, 7503–7509 CrossRef CAS PubMed.
  45. D. Hofmann, S. Tenzer, M. B. Bannwarth, C. Messerschmidt, S.-F. Glaser, H. R. Schild, K. Landfester and V. Mailänder, Mass spectrometry and imaging analysis of nanoparticle-containing vesicles provide a mechanistic insight into cellular trafficking, ACS Nano, 2014, 8, 10077–10088 CrossRef CAS PubMed.
  46. D. Pozzi, G. Caracciolo, A. L. Capriotti, C. Cavaliere, G. La Barbera, T. J. Anchordoquy and A. Lagana, Surface chemistry and serum type both determine the nanoparticle–protein corona, J. Proteomics, 2015, 119, 209–217 CrossRef CAS PubMed.
  47. M. J. Hajipour, S. Laurent, A. Aghaie, F. Rezaee and M. Mahmoudi, Personalized protein coronas: a “key” factor at the nanobiointerface, Biomater. Sci., 2014, 2, 1210–1221 RSC.
  48. G. Caracciolo, D. Caputo, D. Pozzi, V. Colapicchioni and R. Coppola, Size and charge of nanoparticles following incubation with human plasma of healthy and pancreatic cancer patients, Colloids Surf., B, 2014, 123, 673–678 CrossRef CAS PubMed.
  49. R. C. Duhamel, P. H. Schur, K. Brendel and E. Meezan, pH gradient elution of human IgG1, IgG2 and IgG4 from protein A-sepharose, J. Immunol. Methods, 1979, 31, 211–217 CrossRef CAS PubMed.
  50. S. Hober, K. Nord and M. Linhult, Protein A chromatography for antibody purification, J. Chromatogr. B: Anal. Technol. Biomed. Life Sci., 2007, 848, 40–47 CrossRef CAS PubMed.
  51. J. Travis and R. Pannell, Selective removal of albumin from plasma by affinity chromatography, Clin. Chim. Acta, 1973, 49, 49–52 CrossRef CAS.
  52. A. Kovacs and A. Guttman, Medicinal chemistry meets proteomics: fractionation of the human plasma proteome, Curr. Med. Chem., 2013, 20, 483–490 CAS.
  53. A. C. Grodzki and E. Berenstein, Antibody purification: affinity chromatography – protein A and protein G, Sepharose, Immunocytochemical Methods and Protocols, Springer, 2010, pp. 33–41 Search PubMed.
  54. R. J. Leatherbarrow and P. D. Dean, Studies on the mechanism of binding of serum albumins to immobilized Cibacron blue F3G A, Biochem. J., 1980, 189, 27–34 CrossRef CAS PubMed.
  55. K. Rausch, A. Reuter, K. Fischer and M. Schmidt, Evaluation of nanoparticle aggregation in human blood serum, Biomacromolecules, 2010, 11, 2836–2839 CrossRef CAS PubMed.
  56. C. Rocker, M. Potzl, F. Zhang, W. J. Parak and G. U. Nienhaus, A quantitative fluorescence study of protein monolayer formation on colloidal nanoparticles, Nat. Nanotechnol., 2009, 4, 577–580 CrossRef PubMed.
  57. M. Roser, D. Fischer and T. Kissel, Surface-modified biodegradable albumin nano- and microspheres. II: Effect of surface charges on in vitro phagocytosis and biodistribution in rats, Eur. J. Pharm. Biopharm., 1998, 46, 255–263 CrossRef CAS PubMed.
  58. H. Carrstensen, R. H. Müller and B. W. Müller, Particle size, surface hydrophobicity and interaction with serum of parenteral fat emulsions and model drug carriers as parameters related to RES uptake, Clin. Nutr., 1992, 11, 289–297 CrossRef CAS PubMed.
  59. M. Mahmoudi, I. Lynch, M. R. Ejtehadi, M. P. Monopoli, F. B. Bombelli and S. Laurent, Protein–Nanoparticle Interactions: Opportunities and Challenges, Chem. Rev., 2011, 111, 5610–5637 CrossRef CAS PubMed.
  60. A. Gessner, A. Lieske, B. R. Paulke and R. H. Müller, Functional groups on polystyrene model nanoparticles: influence on protein adsorption, J. Biomed. Mater. Res., Part A, 2003, 65, 319–326 CrossRef PubMed.
  61. K. Huang, Y. Hu, C. Yu, R. Boerhan and G. Jiang, Charged surface groups of NPs and the adsorbed proteins codetermine the fate of NPs upon interacting with cells, RSC Adv., 2016, 6, 58315–58324 RSC.
  62. S. Schottler, K. Klein, K. Landfester and V. Mailander, Protein source and choice of anticoagulant decisively affect nanoparticle protein corona and cellular uptake, Nanoscale, 2016, 8, 5526–5536 RSC.
  63. S. Schöttler, G. Becker, S. Winzen, T. Steinbach, K. Mohr, K. Landfester, V. Mailänder and F. R. Wurm, Protein adsorption is required for stealth effect of poly(ethylene glycol)- and poly(phosphoester)-coated nanocarriers, Nat. Nanotechnol., 2016, 11, 372–377 CrossRef PubMed.
  64. S. Tenzer, D. Docter, J. Kuharev, A. Musyanovych, V. Fetz, R. Hecht, F. Schlenk, D. Fischer, K. Kiouptsi, C. Reinhardt, K. Landfester, H. Schild, M. Maskos, S. K. Knauer and R. H. Stauber, Rapid formation of plasma protein corona critically affects nanoparticle pathophysiology, Nat. Nanotechnol., 2013, 8, 772–781 CrossRef CAS PubMed.
  65. J. C. Silva, M. V. Gorenstein, G. Z. Li, J. P. Vissers and S. J. Geromanos, Absolute quantification of proteins by LCMSE: a virtue of parallel MS acquisition, Mol. Cell. Proteomics, 2006, 5, 144–156 CAS.

Footnotes

Electronic supplementary information (ESI) available: LC-MS analysis of different protein fractions, series-connection of protein A and AffiGel Blue columns, detailed overview of DLS data, zetapotential of particles in the different protein fractions. See DOI: 10.1039/c6ra17028e
Co-senior authors and co-corresponding authors, these authors contributed equally.

This journal is © The Royal Society of Chemistry 2016
Click here to see how this site uses Cookies. View our privacy policy here.