
Direct determination of total mercury in urine samples using flow injection catalytic cold vapor atomic absorption spectrometry (FI-CCV-AAS)
A. Sabouri and
S. Nouroozi*
Department of Chemistry, University of Zanjan, 38791-45371, Zanjan, Iran. E-mail: s.nouroozi@znu.ac.ir; Fax: +98 24 3305 2477; Tel: +98 24 3305 2590
First published on 19th August 2016
Abstract
A rapid flow injection catalytic cold vapor atomic absorption spectrometric (FI-CCV-AAS) method is described for determination of total mercury in urine samples. In this work, instead of preliminary oxidation or digestion steps, efficiency of vaporization of organic mercury was increased using Fe3+ as the catalyst directly in line in the flow injection protocol, therefore sample pretreatment was eliminated. Several physical and chemical variables in the flow injection system were studied and optimized in order to generate identical analytical signals for both inorganic and organic mercury. Due to the similarity of the resulting sensitivity, Hg2+ was used successfully as a primary standard for calibration. Limit of detection, coefficient of regression and linear dynamic range were obtained as 0.14 μg L−1, 0.9997 and 0.50–35.0 μg L−1, respectively. The use of flow injection system enabled fast analysis with a sample throughput of 108 h−1. The application of the method to the quantification of total mercury in the two levels of urine reference material (SRM 3668) gave 107.7% and 97.3% recoveries for lower and elevated levels, respectively. The method successfully recovered spiked Hg2+ and methylmercury in 101 urine samples in the range of 93.4–104.5%.
1. Introduction
It is well known that mercury is one of the most toxic heavy metals in the environment. Different forms of mercury can be accumulated in animals and plants and can damage centralnervous system by entering from the environment into the human body.1 In general, the human population's exposure to mercury is mainly through the diet and dental amalgam.2 Mercury content in foodstuffs is usually in its inorganic form and of very low concentration. In contrast, seafood like tuna fishes and lobsters are the main sources of methylmercury, as representative of organic mercury in diet. Several authors reported the mercury content in different sea creatures in the range of several micrograms per gram which could be considered as a high potential pollutant source in human food diet.3–6 Another proven source of entrance of mercury into human body is dental amalgam. Aronsson et al. showed that mercury is released from amalgam restoration in the mouth as vapor.7 Their studies revealed that the release rate of mercury in the mouth can be accelerated by certain foods or by the action of chewing. Regardless of the source of mercury, this toxic element can enter into the different biological cycles which can lead to the accumulation in some body organs and also excretion through urine. Due to the latter, for a long time, the concentration of total mercury in urine has been used as a guide to excessive exposure.8,9In general, cold vapor atomic absorption spectrometry (CV-AAS) is the most reliable and widely used technique for the determination of mercury contents in samples due to its excellent sensitivity, simplicity and availability of its instrumentations.10 Although this technique inherently is relatively free from interferences, but analysis of mercury in biological samples require sample pretreatment due to some problems: (i) different chelates can complex mercury ions in media which decreases the efficiency of vaporization reaction and (ii) organic derivations of mercury could not be reduced to elemental mercury with equal efficiency of inorganic mercury.11 As a result, without digestion and/or oxidation, direct determination of total mercury based on vapor generation techniques in the most biological samples is difficult or in many cases impossible. In order to overcome the first problem, sample clean up based on separation techniques12 or using stronger reducing agents13 have been suggested by several researchers. The second problem is more sophisticated and traditionally requires robust techniques such as different types of digestions. International analytical guidelines recommend sample preparation techniques like digestion and oxidation before the determination of total mercury contents in water, wastewater, fish, urine and other biological samples.14–16 The aim of such harsh sample pretreatments prior to mercury analysis clearly is to convert all organic and complex forms of mercury into Hg2+ to ensure the optimal vaporization efficiency.17 In spite of that, their major drawback, analyte dilution, could not be ignored particularly when the concentration of mercury in original samples is slightly more than the instrument limit of detection which imposes an enrichment step before analysis.18–20 In addition, applying sample digestion before determination will increase the analysis steps and consequently raises the potential of operational errors. This case is especially important in clinical and environmental laboratories with a lot of samples a day. Online21 and manual22 oxidation of organic mercury compounds with the aid of oxidizing agents, online microwave sample digestion23 and using reagents capable of reducing organic mercury compounds24,25 are some efforts carried out by researchers in order to solve the aforementioned problems. According to Monteiro report, Fe3+ ions have catalytic effect on the redox reaction between NaBH4 and methylmercury.26 In 2012, Adeloju et al. showed that Fe3+ ions can catalyze the reaction between several organomercuric compounds and NaBH4.
Flow injection analysis (FIA) is a well-known sample introduction technique when the highest level of repeatability is required or only a small amount of sample is available.27 Several researchers have suggested methods based on this technique for laboratories in such conditions.28–31
In this paper we offer an efficient, fast, inexpensive and environmentally friendly method for a direct determination of total mercury in urine samples which can meet all the analytical requirements in clinical and toxicological laboratories. The method is based on flow injection sample introduction technique and catalytic effect of Fe3+ ions on the vaporization reaction of organic mercury in cold vapor generation technique. We have investigated all chemical and physical parameters of the FIA manifold and the potential of interfering substances in urine matrix. The efficiency and the reliability of the proposed method were also proved by analysis of the certified reference urine material and the 101 urine samples from a random human population.
2. Experimental
2.1. Reagents and materials
All chemicals were of analytical reagent grade unless otherwise stated. For all made solutions, double distilled water with electrical conductivity lower than 2.0 μS cm−1 was used. Standard solutions of 1000 μg mL−1 methylmercury (VHG, USA) and mercury (Merck, Germany) were used as stock solutions and were stored in the refrigerator at 4 °C. Working solutions were prepared daily using serial dilution of the stock solution just few hours before the use. As methylmercury stock solution is sensitive to light irradiation, it should be stored in dark bottle or wrapped with aluminum foil in case of degradation. NaBH4 solution was prepared freshly by dissolving appropriate amounts of NaBH4 salt (CHEMLAB, Belgium) in 0.1% NaOH (Merck, Germany) solution. Standard solutions containing 1000 μg mL−1 of Mg2+, Fe2+, Ni2+, Cd2+, SO42−, NO3− and NO2− (CHEMLAB, Belgium) were used for interference study and different concentrations were prepared freshly just few hours before the related step. Creatinine, urea and Na2S (Sigma-Aldrich, USA), NaCl and CaCl2 (CHEMLAB, Belgium) were also used for interference study and their working solutions were prepared by dissolving appropriate amounts in double distilled water freshly. A 1% Fe3+ solution was prepared by dissolving 2.9 g of FeCl3 in 100 mL of 0.5 M HCl (LOBACHEMI, India). This solution was diluted during the optimization steps for preparing different concentrations of Fe3+. Butane-1-ol (Merck, Germany) was used as anti-foaming agent.2.2. Apparatus
A Varian AA220 atomic absorption spectrometer (Australia) equipped with a Varian mercury hallow cathode lamp was used for all signal measurements. Operational conditions of the AAS were as follows: monochromator wavelength of 253.7 nm, lamp current of 6 mA, slit width of 0.5 nm and signal integration time of 30 seconds. In order to compensate for the non-specific absorption during cold vapor generation atomization, deuterium lamp of the instrument was used under the manufacturer recommended conditions. Fig. 1 show the set-up for the homemade flow injection system which was used for sample introduction and reagent delivery. A Gilson mini pulse eight-channel peristaltic pump (France), a VICI CHEMINERT injection valve (USA), VICI different sizes of tubes and fittings, an Abzar Control Arshia ACA04 argon gas flow meter (Iran), a gas–liquid separator and a quartz cell, both made by Analytik Jena (Germany), were used to set up the apparatus. | ||
| Fig. 1 Flow injection cold vapor generation AAS system for direct determination of total mercury in urine samples. P.P: Peristaltic Pump, S.C: Sample Carrier, S.I.V: Sample Injection Valve, R.C: Reaction Coil, G.L.S: Gas Liquid Separator, PMT: Photo Multiplier Tube. | ||
3. Results and discussions
Total mercury analysis in urine samples is based on the below reactions:| Hg2+ + BH4− → Hg0(g) + byproducts |

First reaction is a well-known reaction which occurs at high performance when adequate concentration of NaBH4 is used as reducing agent. Successful analysis of total mercury in real samples critically relate to the efficiency of the second reaction. In other words, the total mercury determinations in a real sample with no sample preparation step would be successful if the analytical signals for both reactions are the same. The aim of optimizing for FIA system in this work was to equalize vapor generation efficiencies for both inorganic and organic mercury. Methylmercury (MeHg) was used as a representative of organomercuric compounds in optimization steps, calibration and analysis of real samples. In order to reach the optimal condition, several physico-chemical variables were investigated using one at a time strategy. For convenience of observed results comparison, vertical axis of all figures are shown as normalized signals and marked as relative signal intensity which were calculated as follows:

In this approach, relative signal intensity of 100 is the maximum signal obtained from Hg2+ solution in the related experiment.
3.1. The effects of reagents and carrier gas flow rates
In general, the more reagent volume the more sample dilution and consequently the decrease in signal intensity. In order to minimize this effect, flow rates of reducing agent and catalyst streams were adjusted as low as possible to keep the dilution of sample down. Different pump speed and variant tube sizes were tested while analytical signals for Hg2+ were being recorded. Reducing agent and catalyst flow rates of 1.6 mL min−1 were selected considering the lowest dilution and analytical noise. The effects of different carrier flow rates on the signals of Hg2+ and MeHg are shown in Fig. 2. The vapor generation efficiency for both inorganic and organic mercury were increased as carrier flow rate was raised and reached the maximum of 7.5 mL min−1. However, inorganic mercury signals were deteriorated in the flow rates higher than 7.5 mL min−1 because of the decrease in the reaction time by increasing the sample carrier flow rate, higher speed of catalytic reaction for the organic mercury atomization is not affected and therefore, signals of MeHg remained constant in the higher carrier flow rates. For further studies, sample carrier flow rate was selected in the range of 7.2 to 7.5 mL min−1 as the optimum flow rate.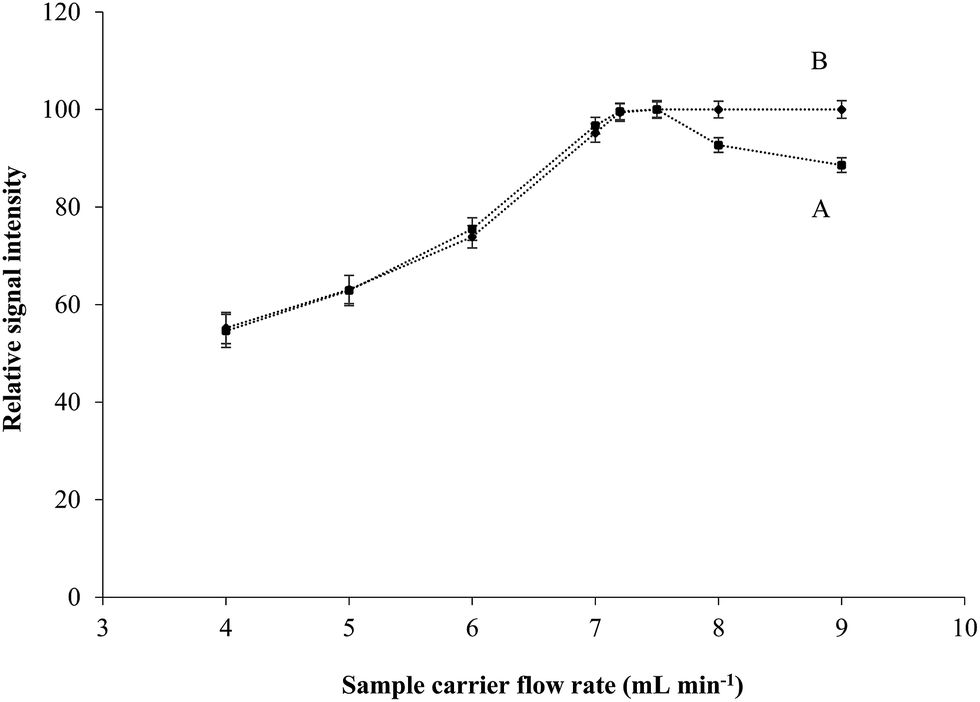 | ||
| Fig. 2 The effect of sample flow rates on the signal intensities of Hg2+ (A) and MeHg (B). | ||
In order to achieve the highest signal values for both mercury compounds, argon flow rates from 50 to 300 mL min−1 were studied and similar sensitivities for both mercury species were observed. Analytical signals increased as the gas flow rates were raised up to 150 mL min−1 and then decreased smoothly. So, 150 mL min−1 was chosen as the optimum argon flow rate for further studies. It is necessary to mention that using different kinds of gas–liquid separators resulted in different optimum argon flow rates.
3.2. The effects of reagents concentrations
Preliminary studies revealed that using HCl as carrier solution with concentrations in the range of 0.1 to 0.8 mol L−1 produced the optimal mercury signals. HCl solutions lower than 0.1 mol L−1 produce lower analytical signals for inorganic Hg which is due to lower reduction reaction efficiency. HCl solutions greater than 0.8 mol L−1 not only led to the higher atomization efficiencies for both species, but also led to higher background signals and S/N remained nearly constant. In this work, in order to lower acid usages, HCl solution with concentration of 0.2 mol L−1 was used as carrier solution in all cases.The effects of reducing agent concentrations were studied in the range of 10−5 to 2% of NaBH4. Inorganic Hg can be completely vaporized in this concentration range. In spite of using high concentrations of NaBH4, vaporization efficiency of methylmercury could only reach up to around 85% (Fig. 3).
 | ||
| Fig. 3 The effect of NaBH4 concentration on the vaporization efficiency of methylmercury in the absence of a catalyst. | ||
Because of vigorous and uncontrollable reaction conditions, it was impossible to use concentrations greater than 2% of reducing agent. The result of this experiment is in compliance with the Adeloju findings and confirms that no successful total mercury analysis is possible without using a catalyst, even in pure water matrix. Fig. 4 shows the effects Fe3+ and NaBH4 concentrations on the vaporization efficiency of methylmercury. The results revealed that for a complete vaporization of MeHg with the aid of Fe3+ catalyst, concentration of NaBH4 and Fe3+ solutions should be kept at least 0.1% and 200 mg L−1, respectively.
 | ||
| Fig. 4 The influence of Fe3+ concentration on the vaporization efficiency of methylmercury using different levels of NaBH4 reducing agent: A: 0.0001%; B: 0.001%; C: 0.01%; D: 0.1%. | ||
3.3. The effects of sample injection volume and reaction coil length
In all analytical methods based on flow injection technique, sample volume plays an important role on the quality of analytical signals. As a general rule, injection of a sample less than optimum amount leads to lower analytical signals and also, more sample volume injections result in broad or doublet peaks. The latter causes inability in determination of peak areas or heights and consequently error in calculating analyte concentrations. According to the results, for both mercury species the increase in sample volume up to 820 μL led to higher signal intensities meanwhile a level-up condition was observed using greater volumes. A coiled Teflon tube with internal diameter of 0.03 inch was used to deliver 820 μL of sample into the carrier stream.Data from the effect of the reaction coil length showed that the increase in the reaction coil length up to 25 cm produced more intense analytical signals for both mercury species. On the other hand, reaction coils longer than 25 cm led to lower analytical signals because of sample dilution by the carrier solution. A coiled 25 cm Teflon tube (0.03 inch I.D.) was used as a reaction coil for the FIA manifold.
4. Analytical performance
4.1. Calibration and figures of merit
In order to calculate figures of merit for the presented method, several experiments were conducted and analytical signals were recorded under the optimal conditions. By injecting 820 μL of mercury standard solutions, the response of the method was linear up to 40 and 35 μg L−1 for the determination of Hg2+ and methylmercury, respectively. Linear dynamic range (LDR) for total mercury analysis was obtained in the range of 0.42 to 35.00 μg L−1. Authors highly recommend using Hg2+ solution for the calibration due to longer stability of its stock solutions, lower toxicity and operational costs. After the essential linearity inspection, standard series of Hg2+ including 0.00, 5.00, 10.00, 15.00, 20.00, 25.00 30.00 and 35.00 μg L−1 were prepared precisely and 0.50 mL butan-1-ol was added to 10 mL of each solution. Calibration graph was completed by injecting 820 μL of each standard solution and just after the end of calibration; several standard solutions of each mercury species were examined. In order to calculate the uncertainty of the obtained results, the whole of process was repeated 5 times and analytical signals were recorded. Table 1 summarizes analytical figures of merit which shows a precise flow injection cold vapor generation technique with a high capability. Limits of detection and quantification were calculated according to IUPAC definition and are based on 3 and 10 times the standard deviation of the blank signals, respectively. The reported sensitivity shown in this table, is the concentration of mercury which can reduce the transmittance of mercury hollow cathode lamp from 100% to 99%.32| Parameter | Resulta |
|---|---|
| a Values in the parentheses are confidence intervals based on 95% confidence level and 4 degrees of freedom. | |
| Calibration equation | Abs = 0.0065 (±0.0001)C + 0.0027 (±0.0005) |
| Regression coefficient | 0.9997 (±0.0002) |
| Sensitivity | 0.67 μg L−1 |
| Limit of detection | 0.14 (±0.05) μg L−1 |
| Limit of quantification | 0.42 (±0.09) μg L−1 |
| Linear dynamic range | 0.42–35.00 μg L−1 |
| Hg2+ 5.00 μg L−1 | 5.03 (±0.09) μg L−1 |
| MeHg+ 5.00 μg L−1 | 4.92 (±0.09) μg L−1 |
| Hg2+ 15.00 μg L−1 | 14.91 (±0.25) μg L−1 |
| MeHg+ 15.00 μg L−1 | 15.07 (±0.27) μg L−1 |
| Hg2+ 30.00 μg L−1 | 30.22 (±0.56) μg L−1 |
| MeHg+ 30.00 μg L−1 | 30.09 (±0.64) μg L−1 |
| Sample consumption per assay | 820 μL |
| Sample throughput | 108 h−1 |
4.2. The effects of diverse species
In order to investigate the effects of the other species on the vaporization efficiency of Hg2+ and MeHg, several species in different concentration levels were added to the solutions of 10 μgL−1 of Hg2+ and MeHg and analysis was followed under the optimal conditions. Table 2 shows recovery and % RSD of the obtained results for each mercury solution. Except sulfide ion, other species caused no deviation greater than ±5% in the analytical signals. Usually the concentrations of sulfide ion in urine samples is low enough and so, a successful analysis of total mercury would be predictable in wide variety of urine samples in a normal human population. Interference of sulfide ion is due to formation of stable HgS precipitate which brings out the Hg2+ from the reaction media and prevents borohydride ions from an effectively reducing of Hg2+ into the elemental mercury.| Species | Concentration (mg L−1) | Obtained results for Hg2+ solutions | Obtained results for MeHg solutions | ||
|---|---|---|---|---|---|
| Recovery (%) | % RSD (n = 3) | Recovery (%) | % RSD (n = 3) | ||
| Na+ | 200 | 99.1 | 1.4 | 98.5 | 1.8 |
| 2000 | 99.5 | 1.5 | 102.4 | 1.6 | |
| Ca2+ | 100 | 98.9 | 1.1 | 98.9 | 2.1 |
| 1000 | 101.8 | 1.1 | 99.6 | 2.2 | |
| Mg2+ | 20 | 101.6 | 1.9 | 97.2 | 1.8 |
| 200 | 99.4 | 1.8 | 98.7 | 1.3 | |
| Fe2+ | 5 | 101.8 | 1.5 | 98.9 | 2.1 |
| 50 | 98.1 | 1.9 | 102.4 | 2.2 | |
| Ni2+ | 5 | 99.1 | 1.2 | 98.4 | 2.2 |
| 50 | 98.4 | 2.2 | 98.5 | 2.4 | |
| Cd2+ | 5 | 97.5 | 1.5 | 99.7 | 1.9 |
| 50 | 98.6 | 1.6 | 102.4 | 1.5 | |
| SO42− | 50 | 103.5 | 1.9 | 99 | 1.9 |
| 500 | 101.3 | 1.9 | 98.2 | 1.7 | |
| Cl− | 200 | 98.4 | 2 | 99.8 | 2.1 |
| 2000 | 98.1 | 2.1 | 99.4 | 2 | |
| S2− | 1 | 98.5 | 2.8 | 101.7 | 2.3 |
| 10 | 87.9 | 4.2 | 100.2 | 1.9 | |
| NO3− | 20 | 101.4 | 1.3 | 99.1 | 1.8 |
| 200 | 99.6 | 1.3 | 99.3 | 2.5 | |
| NO2− | 20 | 99.3 | 1.5 | 97.4 | 1.6 |
| 200 | 99.8 | 1.2 | 98.6 | 2.3 | |
| Creatinine | 100 | 100.3 | 1.9 | 98.3 | 2.9 |
| 1000 | 99.5 | 1.7 | 99.6 | 2.8 | |
| Urea | 1000 | 98.2 | 1.8 | 98.1 | 2.7 |
10![[thin space (1/6-em)]](https://www.rsc.org/images/entities/char_2009.gif) 000 000 |
99.7 | 1.8 | 98.1 | 2.6 | |
4.3. Analysis of real samples
As biological samples always possess different matrices, the only reliable methods are those which have been passed a successful analytical validation procedure in a large statistical population. In this case and in order to ensure the capability of the developed method for a successful vaporization of inorganic and organic Hg in a wide variety of urine samples, 101 urine samples were collected from several persons both male and female within 14 to 71 years of age. Samples were collected in single-use sterile plastic bottles, acidified with acetic acid (1:100 acid to urine ratio) and then stored at 4 °C and were analyzed within 24 h.22 Samples were divided into four 5.0 mL parts as follows: one part was analyzed directly, two parts were spiked with 5.00 μg L−1 of Hg2+ and MeHg and the last part were spiked with 2.50 + 2.50 μg L−1 of each mercury species. Before analysis, 0.25 mL butan-1-ol was added to each sample to control foaming in tubes of the cold vapor generation apparatus. In order to obtain more precise results, calibration was performed close to the estimated sample range by using Hg2+ standard solutions of 1.00, 2.00, 3.00, 4.00, 5.00, 6.00, 7.00, 8.00, 9.00 and 10.0 μg L−1. The prepared samples were injected 3 times and relative standard deviation and recovery of each was calculated.
All experiments were performed in accordance with the international laws for research and education. All the steps and experiments of this research followed the guidelines of the University of Zanjan for research and education. All steps of this study have been accepted and approved as a part of Ph. D. thesis by the department of chemistry, University of Zanjan.
All urine samples were received from a laboratory as blind samples. The only information's which authors know about the volunteers are the range of their ages and gender (male and female). Before sampling, the volunteers became aware about the project and they warmly accepted to participate in this research with a complete consent.
Fig. 5 shows histogram of the obtained results of total mercury analysis in the urine samples. Relative standard deviations in the urine samples are spread in the range of 8.5 to 18.4% for concentrations less than 1.00 μg L−1 and 1.9 to 8.5% for concentrations more than 1.00 μg L−1 which are reasonably precise considering a direct determination of total mercury in trace levels in such sophisticated samples. For samples with mercury concentrations between 0.66 to 2.66 μg L−1, which consist of nearly 50% of the total samples, the average RSD was calculated to be 4.7%. Fig. 6 is a dot plot diagram of the obtained recovery percentages from the analysis of spiked urine samples.
 | ||
| Fig. 5 Histogram of total mercury concentrations obtained from the analysis of 101 urine samples under the optimal conditions. | ||
 | ||
| Fig. 6 Dot plot diagram of the obtained recoveries from 101 urine samples spiked with: A: 5.00 μg L−1 Hg2+, B: 5.00 μg L−1 MeHg and C: 2.50 μg L−1 Hg2+ + 2.50 μg L−1 MeHg. | ||
According to this figure, the minimum and maximum recovery percentages for the spiked samples with Hg2+, MeHg and Hg2+ + MeHg are in the range of (93.1–103.8%), (93.4–104.3%) and (93.4–104.5%), respectively. These recovery results show excellent capability of the proposed method in the analysis of inorganic and organic Hg in a large population of urine samples. The ability of the proposed method in generation of identical signals for both inorganic and organic mercury in urine samples were validated by paired t-test between the obtained recovery percentages from spiked urine samples with Hg2+ and MeHg. P-value of 0.286 ensures identical behavior in the vaporization of both mercury species. Therefore a successful total mercury analysis can be guaranteed using the proposed method under the optimal operational conditions.
Accuracy of the proposed method was assessed using certified NIST SRM 3668 which is a series of frozen standard urine samples at low and elevated concentrations with assigned uncertainty. The SRM samples were kept out of refrigerator in order to increase their temperature from −70 °C to the laboratory temperature followed by calibration and immediate sample injection. The process of the calibration and sample injection was repeated three times for each concentration level. Calibrations were performed in the range of 0.00–5.00 μg L−1 for the low level SRM and 0.00–10.0 μg L−1 for elevated one.
Table 3 summarizes the results of NIST SRM 3668 analysis which indicates very good conformity between certified values and the obtained results. RSD values of 6.7% and 3.3% were obtained for low and elevated concentration levels of mercury species, respectively which suggests a precise procedure considering direct analysis of total mercury in sophisticated urine samples.
A comparative study showed that the proposed method has many advantages over the existing methods. Table 4 summarizes analytical data for the proposed method and some of the previously reported ones which clearly shows the outstanding features of this work.
5. Conclusion
A rapid, accurate, precise and sample preparation free procedure for direct analysis of total mercury in urine samples were described in detail. With the aid of Fe3+ ions as catalyst and using NaBH4 with concentration more than 0.1%, methylmercury has the same vapor generation efficiency as Hg2+ which leads to the elimination of preliminary oxidation of MeHg before the analysis. Identical analytical signals for inorganic and organic mercury is a vital parameter in this method which was obtained using a home-made flow injection analytical system coupled with cold vapor generation AAS. The method was successfully applied to the quantitative analysis of total mercury in the normal and certified (SRM 3668) urine samples with satisfactory recoveries and repeatabilities.Acknowledgements
The authors are grateful to the University of Zanjan research programs of Higher Education for their support.References
- S. J. Blunden, L. A. Hobbs, P. J. Smith and P. J. Craig, Organometallic Compound in Environment, Longman, Harlow, 1986 Search PubMed.
- T. Warren, Analyst, 1994, 119, 2481–2484 RSC.
- H. Matusiewicz and E. Stanisz, Microchem. J., 2010, 95, 268–273 CrossRef CAS.
- R. F. Bendl, J. T. Madden, A. L. Regan and N. Fitzgerald, Talanta, 2006, 68, 1366–1370 CrossRef CAS PubMed.
- M. A. Vieira, A. S. Ribeiro, A. J. Curtius and R. E. Sturgeon, Anal. Bioanal. Chem., 2007, 388, 837–847 CrossRef CAS PubMed.
- A. Shah, T. Kazi, J. Baig, H. Afridi and M. Arain, Food Chem., 2012, 134, 2345–2349 CrossRef CAS PubMed.
- A. M. Aronsson, B. Lind, M. Nylander and M. Nordberg, Biol. Met., 1989, 2, 25–30 CrossRef CAS PubMed.
- F. Bakir, S. Damluji, L. Amin-Zaki, M. Murtadha, A. Khalidi, N. Al-Rawi, S. Tikriti, H. Dhahir, T. Clarkson and J. Smith, Science, 1973, 181, 230–241 CAS.
- J. Harrington, Lancet, 1974, 303, 86–87 CrossRef.
- Y. Zhang and S. B. Adeloju, Talanta, 2008, 74, 951–957 CrossRef CAS PubMed.
- Y. Zhang and S. B. Adeloju, Anal. Chim. Acta, 2012, 721, 22–27 CrossRef CAS PubMed.
- M. K. Rofouei, A. Sabouri, A. Ahmadalinezhad and H. Ferdowsi, J. Hazard. Mater., 2011, 192, 1358–1363 CrossRef CAS PubMed.
- F. Ubillús, R. Barberá, R. Farré, M. Lagarda and A. Alegría, Food Chem., 2000, 71, 529–533 CrossRef.
- Standard methods for the examination of water and wastewater, ed. L. S. Clesceri, A. E. Greenberg and A. E. Eaton, American Public Health Association, 20th edn, 1999 Search PubMed.
- J. W. O'Dell, B. B. Potter, L. B. Lobring and T. D. Martin, Determination of Mercury in Water By Cold Vapor Atomic Absorption Spectrometry, United States Environmental Protection Agency, Method 245.1, 1994 Search PubMed.
- T. Suzuki, H. Akagi, K. Arimura, T. Ando, M. Sakamoto, H. Satoh, A. Nagamura, M. Futatsuka and A. Matsuyama, Mercury Analysis Manual, Ministry of the Environment, Japan, 2004 Search PubMed.
- M. Tuzen and M. Soylak, Bull. Environ. Contam. Toxicol., 2005, 74, 968–972 CrossRef CAS PubMed.
- M. Payehghadr, H. Shafiekhani, A. R. Sabouri, A. M. Attaran and M. K. Rofouei, Iran. J. Chem. Chem. Eng., 2014, 33, 1–10 CAS.
- M. Tuzen, I. Karaman, D. Citak and M. Soylak, Food Chem. Toxicol., 2009, 47, 1648–1652 CrossRef CAS PubMed.
- M. Tuzen, O. D. Uluozlu, I. Karaman and M. Soylak, J. Hazard. Mater., 2009, 169, 345–350 CrossRef CAS PubMed.
- R. A. Richardson, Clin. Chem., 1976, 22, 1604–1607 CAS.
- T. Guo and J. Baasner, Anal. Chim. Acta, 1993, 278, 189–194 CrossRef CAS.
- B. Welz, D. L. Tsalev and M. Sperling, Anal. Chim. Acta, 1992, 261, 91–103 CrossRef CAS.
- P. Coyle and T. Hartley, Anal. Chem., 1981, 53, 354–356 CrossRef CAS PubMed.
- D. Littlejohn, G. S. Fell and J. M. Ottaway, Clin. Chem., 1976, 22, 1719–1723 CAS.
- A. da CP Monteiro, L. S. de Andrade and R. C. de Campos, Fresenius. J. Anal. Chem., 2001, 371, 353–357 CrossRef.
- S. Nouroozi and R. Mirshafian, Talanta, 2009, 79, 1149–1153 CrossRef CAS PubMed.
- S. Elsuccary and A. A. Salem, Talanta, 2015, 131, 108–115 CrossRef CAS PubMed.
- S. Hirata, H. Yoshihara and M. Aihara, Talanta, 1999, 49, 1059–1067 CrossRef CAS PubMed.
- P. D. Tzanavaras and D. G. Themelis, Anal. Chim. Acta, 2007, 588, 1–9 CrossRef CAS PubMed.
- S. Nouroozi, H. Biglary and B. Haghighi, J. Fluoresc., 2012, 22, 365–371 CrossRef CAS PubMed.
- J. D. Ingle Jr and S. R. Crouch, Spectrochemical analysis, Prentice-Hall International, Englewood Cliffs, 1st edn, 1988, ch. 6, p. 171 Search PubMed.
| This journal is © The Royal Society of Chemistry 2016 |