Influence of free fatty acid content on the oxidative stability of red palm oil

Antonella De Leonardis*, Francesca Cuomo, Vincenzo Macciola and Francesco Lopez
Department of Agricultural, Environmental and Food Sciences (DiAAA), University of Molise, Via De Sanctis, I-86100 Campobasso, Italy. E-mail: antomac@unimol.it; Fax: +39 0874404641; Tel: +39 0874404632

Received 1st July 2016 , Accepted 8th October 2016

First published on 10th October 2016


Abstract

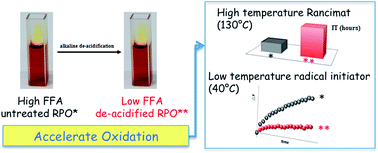
The role of free fatty acids (FFA) on the oxidative stability of four different unrefined red palm oils (RPO) has been investigated. Unrefined red palm oil is a typical African edible oil produced by laborious and traditional methods that heavily affect the final product quality. Physicochemical analysis performed on the RPO samples showed a high FFA content (8.3–14.5%), peroxide values between 2.9 and 10.8 meq O2 per kg and a significant presence of carotenoids (up to 1.6 g kg−1). In order to lower the FFA content, the oil was de-acidified (RPO-D) and the treated product resulted with an improved quality when compared with the untreated oil (RPO-U). The de-acidification route, as well as the reduction of the acidity level, caused a reduction in the UV spectrophotometric indices (K232 and K270) whereas the DOBI index increased and both peroxide and carotenoids amounts were unaffected. Furthermore, the oxidation stability of RPO-U and RPO-D was evaluated using two different experimental approaches: a high-temperature method (Rancimat method) and medium-temperature method (reaction induced by the radical initiator, 2,2′-azobis(2,4-dimethylvaleronitrile)). Both methods unequivocally showed a significant improvement in the resistance to oxidation of RPO-D when compared to RPO-U and confirmed the crucial pro-oxidant effect of FFA on red palm oil.

1. Introduction

The oil palm tree (Elaeis guineensis Jacq.), although native of West Africa, is currently cultivated in several tropical countries, particularly in Southeast Asia where it has rapidly expanded as an industrial crop.1,2 Nowadays, Indonesia and Malaysia produce more than 85% of the world's palm oil, whereas Africa produces only about 5%. Palm fruit provides two types of oils, the crude palm oil, obtained from the fruit pulp, and the palm kernel oil, obtained from the seed kernel. Refined palm oil and its fractions are widely used in various food products such as margarines, shortenings, cooking oils, spreads, confectionery and baking fats.3 In West Africa, palm oil has been used since ancient times as food and medicine, and currently Africans consume about 3 kg per capita per years of crude, unrefined palm oil, also referred to as red palm oil (RPO) for its typical orange-red color due to carotenoid abundance.4 To date, African RPO is produced on small-scale using laborious and complex methods based on traditional farming practices. In brief, the oil palm process involves the following steps: harvesting of fresh fruit bunches, fermentation, sterilization and threshing, digestion and mashing of the fruits, pressing, oil clarification, drying and storage.5 Generally, fresh fruit bunches (weighing about 25 kg) are cut manually from the palm tree and allowed to drop by gravity. Consequently, several fruits are damaged making the lipolytic activity of endogenous enzymes easier and significantly increasing the amount of free fatty acid (FFA) in oils.6 Fruit bunches are left on soil and covered with leaves for 2–3 days in order to allow the fruits detachment (fermentation). During this time, microbial fermentation can also take place on the fruit surface and as a result gives an additional increase in the amount of FFA.7 Fruits are knocked off from the bunches manually (threshing) and then cooked (sterilization) in hot water or under pressurized steam to stop the biochemical and microbial processes, to soften fibers and to facilitate oil release. Alternatively, fruit threshing may follow the bunch sterilization. It follows the so-called “digestion” step, generally carried out in a steam-heated cylindrical vessel under high temperatures in order to make the oil spill easier. The oil is then separated from the digested material by crushing under foot or by small centrifuges or hydraulic presses. Finally, the oil, heated again to reduce its viscosity, is clarified and dried to eliminate residual water, cell debris, fibrous material and other impurities.

Although RPO is currently consumed in the African country of origin, recently, as a consequence of migration flows, its sale has spread to European and Western countries.

RPO is considered a vegetable oil with high nutritional potential due to its high content of phytonutrients.8 In particular, RPO is a natural food source of carotenoids, which are the precursors of vitamin A,9 tocopherols and tocotrienols, which are the precursors of vitamin E.10,11 Other RPO minor components are phytosterols, phospholipids, glycolipids, coenzyme Q10 and squalene.12 Some studies have highlighted several potential health benefits of RPO,13 demonstrating hypocholesterolemic, anticancer,14 gastro-protective, anti-inflammatory,15 antidiabetic16 and neuroprotective effects.17

Unfortunately, as result of its complex extraction process, RPO may contain other undesirable components, such as free fatty acids, moisture, impurities and bad-smelling compounds that may invalidate its potential. Consequently, a refining process is necessary to improve the palm oil quality by involving high-temperature deodorization and de-acidification steps that cause a significant loss of the abovementioned healthy phytonutrients.

Because of its potential health effects, it is highly likely that, in the future, RPO could also meet the increasing demand for wellness and functional foods of Western consumers.

In this study, the influence of free fatty acids on the oxidative stability of commercial RPO has been studied by analyzing oil samples before and after a de-acidification treatment. The stability towards oxidation of both the untreated and de-acidified oils has been investigated. Taking into account that an accelerated oxidation method can affect the behavior of the oils,18,19 two different experimental approaches were proposed: a high-temperature method (Rancimat method) and medium-temperature method (oxidation induced at 40 °C by a radical initiator, 2,2′-azobis(2,4-dimethylvaleronitrile), AMVN).

2. Experimental

2.1 Materials

Red palm oils (RPO) were purchased from stores located in European countries. All were commercial oils produced in Africa, specifically in Ghana (1 RPO, 3 RPO and 4 RPO samples) and West Africa (2 RPO), as indicated on their labels. The oils were stored at 4 °C. All chemicals were of analytical grade. The radical initiator, 2,2′-azobis(2,4-dimethylvaleronitrile) (AMVN) was obtained from the Cayman Chemical Company, and the fluorescence probe diphenyl-1-pyrenylphosphine (DPPP) was purchased from Probior. β-Carotene and other standard compounds were obtained from Sigma-Aldrich Co (St. Louis, MO, USA).

2.2 Alkali de-acidification

Oil de-acidification was carried out at room temperature upon titrating 10 g of untreated oil (RPO-U) dissolved in 1 × 10⁻¹ L ethylic ether[thin space (1/6-em)]:[thin space (1/6-em)]ethanol (1[thin space (1/6-em)]:[thin space (1/6-em)]2, v/v) solution with 0.1 N NaOH solution. The equivalence point was identified by means of phenolphthalein indicator. The ether/oil (phase A) and ethanol/alkaline water/free fatty acids (phase B) were separated using a separating funnel. Phase A was dried under vacuum at 40 °C to recover the de-acidified red palm oil (RPO-D), whereas phase B was acidified with 1 N HCl to obtain the free fatty acids from the corresponding soaps. Then, the free fatty acids (FFA) were extracted by repeated washing (three times) with hexane. After evaporation of the solvent on a rotavapor, the FFA amount was weighed (RPO-FFA). The neutral oil loss (NOL%) was calculated according to eqn (1)20 where RPO-U-FA is the grams of untreated RPO corrected by the free acidity determined by the titration described below.
 
image file: c6ra16953h-t1.tif(1)

2.3 Physicochemical characterization

Determination of free acidity, peroxide values and spectrophotometric indices was carried out according to literature.21 The primary (K232) and secondary (K270) oxidation products were determined on the absorption at wavelengths of 232 and 270 nm for the RPO-U, RPO-D and RPO-FFA samples diluted in hexane (about 0.5 mg mL−1) using a Varian Cary 100 spectrophotometer. The extinction coefficients (K) of RPO-U and relative de-acidification products were calculated using 1% RPO-U/hexane with eqn (2).
 
image file: c6ra16953h-t2.tif(2)

In eqn (2) K and Abs are referring either to 232 nm or 270 nm. The DOBI index is defined as the absorbance ratio Abs446 nm/Abs269 nm of the 1% oil samples dissolved in hexane. The carotenoid content was calculated by measuring the absorbance at 446 nm for each oil diluted in hexane (about 1 mg mL−1) using an independent β-carotene calibration curve as reference.

The fatty acid composition was determined using a gas-chromatograph MOD-8000 (Thermoquest Instrument, Rodano, MI, Italy) equipped with a flame ionization detector. Analysis was carried out using an Alltech EC-1000 FFAP (Alltech, USA) capillary column (30 m × 0.32 mm i.d.; film 0.25 μm) under the following conditions: carrier gas He at 50 kPa; split injection system with a splitting ratio of 1[thin space (1/6-em)]:[thin space (1/6-em)]50; injector and detector temperatures set at 250 °C and 270 °C, respectively; programmed ramp 150–240 °C at 10 °C min−1; injected quantity of 1 μL. Trans-esterification of RPO-U, RPO-U and RPO-FFA fraction was carried out according to the procedure reported by De Leonardis et al.22 using pentadecanoic acid as an internal standard.

2.4 Heat oxidation: Rancimat

The induction times (hours) of the RPO-U and RPO-D oils (2.5 g) were measured on a Rancimat apparatus model 730 (Metrohm AG, Herison, Switzerland) at 130 °C and 20 L h−1 airflow.

2.5 Oxidation kinetics: fluorescence spectroscopy

Red palm oil oxidation was monitored with time using a fluorimetric method adapted from the work of Akasaka et al. and Mosca et al.23,24 A 5 × 10⁻² g oil sample, mixed with 2% of the azo-initiator, AMVN, was weighed exactly and dispersed in 1 × 10⁻² L of a mixed solvent comprised of chloroform/methanol (1[thin space (1/6-em)]:[thin space (1/6-em)]1, v/v). 10 μL of this solution was placed in a reaction cuvette with 5 × 10⁻⁶ L of DPPP solution (3 × 10⁻³ M in chloroform/methanol 1[thin space (1/6-em)]:[thin space (1/6-em)]1, v/v) and taken to a final volume of 5 × 10⁻⁵ L with the same mixed solvent. The cuvette was capped and left for 30 min in a cell holder at 60 °C in the dark. Successively, the cuvette was cooled to 25 °C and taken to a final volume of 1 mL with the mixed solvent. The fluorescence emission at 380 nm (λex 352 nm) was recorded every 10 minutes. DPPP is reported to be a fluorescent reagent for the measurements of hydroperoxides with high selectivity and sensitivity.25–29 DPPP itself is not fluorescent but its oxide, DPPP oxide, shows a strong fluorescence. So the concentration of hydroperoxides present in the sample can be calculated as the concentration of DPPP oxide that forms from the stoichiometric reaction with the hydroperoxides.

2.6 Statistical analysis

Statistical analysis was performed with SPSS statistical software (Chicago, IL, USA). The tests and analyses were carried out in three replicates, calculating the mean and standard deviation. ANOVA (Duncan's multiple range post hoc test at p < 0.01) was performed to show the significant differences. Finally, a Pearson correlation test was used to determine the significant correlations between the oxidative stability and other analytical variables.

3. Results and discussion

3.1 The effect of the de-acidification treatment

Different physical, chemical and biochemical methods may be used for the removal of FFA from crude oil.20 In this study chemical neutralization with NaOH was performed on a laboratory scale. The advantage of this method was that each oil sample was treated with the right amount of NaOH needed to saponify the free fatty acids (FFA) without reacting with the triglycerides. After saponification, three different lipid types were obtained from each oil sample: (i) untreated primary oil (RPO-U), (ii) de-acidified oil (RPO-D) and (iii) free fatty acid fraction (RPO-FFA). The physicochemical properties of the RPO samples, before and after the de-acidification treatment are reported in Table 1. From these data, it is evident that the FFA content was considerably high for all the RPO-U samples particularly when compared with the olive oil values. The European normative on olive oil,21 indeed, considers an oil un-edible with an FFA content higher than 2% in oleic acid. In this study, oleic acid was preferred as the reference fatty acid (Table 1) although the free acidity of RPO should be correctly expressed as a percentage of palmitic acid, which is generally the main component; however, the data significance did not change substantially. Specifically, the FFA in RPO-U ranged from 8.3% to 14.5%, which are values far from the acceptable limit for the European consumer. Moreover, this FFA high level justifies the need of innovative strategies to modify the traditional extraction process of RPO in order to improve the oil quality. The de-acidification treatment applied in this study has been revealed as a rapid and efficient method. In fact, the FFAs were easily and completely removed from the oil and the loss of oil in the aqueous phase was considered negligible being lower than 4% (data not shown).
Table 1 The physicochemical properties of the untreated red palm oil (RPO-U) and the relative fractions obtained after NaOH de-acidification (RPO-D = de-acidified oil; RPO-FFA = free fatty acids). The values are reported as the mean ± standard deviation of three independent replicates. The different letters indicate the significant difference (p < 0.01) of each oil sample
Oil sample Free fatty acids (% oleic acid) Peroxide value (meq O2 per kg) Primary oxidation products (K232 1% RPO-U) Secondary oxidation products (K270 1% RPO-U) DOBI index Carotenoids (g kg−1 oil as β-carotene)
1 RPO-U 14.5 ± 0.7 5.7 ± 0.1a 3.40 ± 0.15a 0.89 ± 0.03a 1.8 ± 0.4a 1.34 ± 0.18a
1 RPO-D 5.6 ± 0.2a 1.76 ± 0.08b 0.57 ± 0.02b 2.7 ± 0.3b 1.54 ± 0.31a
1 RPO-FFA 0.45 ± 0.02 0.16 ± 0.01
2 RPO-U 8.7 ± 0.4 2.9 ± 0.1a 1.85 ± 0.09a 0.62 ± 0.02a 2.4 ± 0.3a 1.26 ± 0.11a
2 RPO-D 2.8 ± 0.1a 1.24 ± 0.05b 0.31 ± 0.03b 4.6 ± 0.6b 1.31 ± 0.15a
2 RPO-FFA 0.29 ± 0.02 0.13 ± 0.02
3 RPO-U 8.3 ± 0.4 11.2 ± 0.8a 4.03 ± 0.22a 1.41 ± 0.09a 0.6 ± 0.2a 0.76 ± 0.10a
3 RPO-D 12.9 ± 0.7a 2.62 ± 0.12b 1.00 ± 0.10b 1.0 ± 0.4a 0.93 ± 0.12a
3 RPO-FFA 0.56 ± 0.08 0.27 ± 0.04
4 RPO-U 14.0 ± 0.6 10.8 ± 0.6a 2.98 ± 0.15a 0.68 ± 0.13a 2.4 ± 0.3a 1.35 ± 0.26a
4 RPO-D 11.5 ± 0.8a 2.35 ± 0.08b 0.51 ± 0.10b 3.1 ± 0.2b 1.58 ± 0.18a
4 RPO-FFA 0.46 ± 0.02 0.14 ± 0.01


FFA removal led to considerable improvements in the de-acidified oils (RPO-D), though the peroxide values remained substantially unchanged, as can be seen from Table 1. The peroxide values obtained for RPO-U ranged between 2.9 to 10.8 meq O2 per kg; these values, unlike FFA, were found to be relatively low taking into account the European Commission limit set at 20 meq O2 per kg for edible olive oils.21 The unchanged peroxide values after the de-acidification treatment suggested that radical ions remained in the de-acidified lipid fraction, composed of triglycerides and a significant amount of partial glycerides (mono- and di-glycerides) that was not determined in this study have been well highlighted by other authors.20 Conversely, a meaningful reduction of both the primary and secondary oxidation products, measured by the UV spectrophotometric indices, was observed as an effect of de-acidification (Table 1). In particular, the absorbance at 232 nm (K232) was due to primary oxidation products, mainly conjugated dienes, whereas the secondary oxidation products and conjugated trienes were identified at 270 nm (K270). For a better comparison between the lipid varieties of each oil sample, the values of K232 and K270 relative to RPO-D and RPO-FFA were calculated on the correspondent RPO-U (eqn (2)). As inferred from Table 1, the K232 drop was significant in all samples and mostly for 1 RPO and 3 RPO varying from 3.40 to 1.76 and 4.03 to 2.62, respectively. As reported, after the de-acidification treatment, the K270 values decreased in the same way significantly. In contrast, carotenoids remained in the de-acidified lipid fraction (RPO-D) according to the study carried out by Gonçalves and co-workers.30 As a consequence of the K270 and carotenoid changes, a significant increase in the ‘Deterioration of Bleachability Index’ (DOBI) was observed in all the de-acidified oils. This parameter, given from the numeric ratio of β-carotene (pro-vitamin A) and secondary oxidation products, is used for measuring the oxidation state of crude palm oil.31

For each oil sample, the fatty acid composition of RPO-U, RPO-D and RPO-FFA was given. Detailed FFA compositions are outlined in the ESI (Table S1). The fatty acid composition of RPO-U was in agreement with the typical range of refined palm oil.32 Palmitic and oleic acids were the main fatty acids, found in almost equal amounts in the oil samples. Nevertheless, the percentage composition of the RPO-D and RPO-FFA fractions appeared to be very similar to the relative RPO-U showing that the lipolytic activity occurred randomly and non-selectively for one or more specific fatty acids. In particular, it was evident that the palmitic/oleic, palmitic/linoleic and saturated/unsaturated ratios did not change after de-acidification. Interestingly the saturated/unsaturated ratio was found to be near to 1, which is considered a good value since it corresponds to a high level of stability for palm oil.33

3.2 High temperature oxidation: Rancimat method

In Fig. 1 the induction time (IT) values, measured using the Rancimat method (130 °C), for red palm oils before and after de-acidification are shown. This representation clearly highlights the role of the de-acidification treatment. In fact, as shown for all the analyzed oil samples, the untreated oil (RPO-U) always had a lower thermal oxidative stability compared with the treated oil (RPO-D). In detail, the RPO-U IT values ranged from a minimum of 0.16 h (sample 3) to a maximum of 1.74 h (sample 2); these values were very low, particularly when compared with those of the refined palm oil that in similar conditions could exhibit IT values higher than 7.00 h.33 Furthermore, the data displayed in Fig. 1 indicate that the IT RPO-D/RPO-U ratio was always higher than 3 with the exception of sample 3, which shows a considerably higher ratio (RPO-D/RPO-U = 20).
image file: c6ra16953h-f1.tif
Fig. 1 The Rancimat induction time at 130 °C of the red palm oil samples before (RPO-U) and after (RPO-D) alkaline de-acidification treatment. The data are reported as the mean and standard deviation of three replicates.

The effect of the heat oxidation treatment on the polyunsaturated fatty acid (PUFA) content was also analyzed (Fig. 2). It is well known that PUFA are the main substrate in the lipid autoxidation process and that these significantly decrease as a consequence of thermal oxidation carried out through Rancimat.33 The data reported in Fig. 2 show that the degradation of PUFA is of a slighter extent for (RPO-D) when compared with the untreated oils (RPO-U). Therefore, it can be stated that FFA removal has a crucial role for the preservation of red palm oil.


image file: c6ra16953h-f2.tif
Fig. 2 Variation (g per 100 g oil) and percentage drop (%) of polyunsaturated fatty acids (PUFA) measured after oxidation by Rancimat at 130 °C on the red palm oil samples (1, 2, 3, 4 as indicated on the bars), untreated (panel A, RPO-U) and de-acidified (panel B, RPO-D). The data reported are the mean values of three replicates.

3.3 Medium temperature oxidation: fluorescence based method

Further information concerning the strict relationship between the amount of free fatty acid and the oxidative stability were provided by analyzing the response to the oxidation triggered by the free radical initiator AMVN. The rationale behind this approach is explained as follows: the free radical initiator AMVN thermally decomposes at 40 °C into two carbon-centered radicals (eqn (3)) that react with oxygen, forming free peroxyl radicals (eqn (4)). The reaction between the peroxyl radical and fatty acids (free or not) gives hydroperoxides (eqn (5)) that stoichiometrically oxidize the probe DPPP to DPPP[double bond, length as m-dash]O (eqn (6)), which is a fluorescent compound. The fluorescence response, as a consequence, is proportional to the amount of hydroperoxides present.
 
R–N[double bond, length as m-dash]N–R (AMVN) → 2R˙ + N2 (3)
 
R˙ + O2 → ROO˙ (peroxyl radical) (4)
 
ROO˙ + RH → ROOH (hydroperoxide) + R˙ (5)
 
ROOH + DPPP → DPPP[double bond, length as m-dash]O + ROH (6)

The free radical activator provides the trigger for the oil oxidation reaction to form hydroperoxides. Considering that some of those species are already formed in the samples, as revealed by the peroxide values, the amount of hydroperoxides generated by the AMVN, shown by the increase in the DPPP fluorescence, depends on the starting conditions of each oil sample. Fig. 3 compares the fluorescence response of the untreated and de-acidified RPO for each of the four commercial oils considered. The data, expressed as the variation of fluorescence ΔF, is the difference between the fluorescence at time t and at t = 0 (FF0) as function of time fitted to eqn (7):

 
image file: c6ra16953h-t4.tif(7)
where ΔFmax is the maximum of ΔF and τ is the time to have half of ΔFmax. The values of ΔFmax and τ calculated from the data interpolation are reported in Table 2. As can be seen, the values of ΔFmax were always higher for the untreated samples compared with the de-acidified oils indicating that RPO-Us can be more oxidized than the RPO-Ds. Although from Fig. 3 it appears that RPO of sample 1 behaved differently from the other oils, i.e. ΔFmax for RPO-D in the graph is higher than the one for RPO-U, the extrapolated value of ΔFmax confirms that the de-acidified sample was less oxidized than the untreated parent. In fact, taking into consideration the values of ΔFmax relative to sample 1, it was noticeable that the calculated value of ΔFmax was close to the experimental value detectable from the graph for RPO-D, whereas the experimental ΔFmax for RPO-U was lower than the extrapolated value. However, this last value confirms a higher susceptibility of RPO-U to oxidation compared to RPO-D and the τ values indicate that the kinetic of oxidation was faster in RPO-D compared to RPO-U.


image file: c6ra16953h-f3.tif
Fig. 3 Comparison of the fluorescence response as a function of time for untreated (RPO-U, black dots) and de-acidified (RPO-D, red dots) oil samples (1, 2, 3, 4 as indicated on the left corner of each panel). Hydroperoxides generated by the radical initiator, AMVN, react with DPPP to give the fluorescent oxide DPPP[double bond, length as m-dash]O. The data are reported as the mean and standard deviation of three replicates.
Table 2 The ΔFmax and τ values obtained using eqn (7)
  1 RPO 2 RPO 3 RPO 4 RPO
-U -D -U -D -U -D -U -D
ΔFmax 57.9 (±4.8) 33.1 (±1.4) 59.5 (±2.3) 16.3 (±0.8) 32.9 (±0.9) 18.2 (±0.9) 31.4 (±0.9) 23.1 (±1.7)
image file: c6ra16953h-t3.tif 0.57 (±0.053) 0.27 (±0.017) 0.55 (±0.031) 0.74 (±0.057)
τ (min) 281 (±33.4) 47.9 (±6.1) 94.2 (±7.8) 55.0 (±7.2) 25.6 (±2.9) 92.3 (±10.5) 19.9 (±2.4) 33.5 (±8.7)


Moreover, the RPO-U of sample 1 together with the RPO-U of sample 2 gave the highest values of ΔFmax because they started from lower values of the peroxide values, that is, from a lower amount of hydroperoxydes. This aspect allows the production of more hydroperoxydes from the oxidation induced by AMVN. In Table 2, a further parameter is reported, which is the ratio between ΔFmaxROP-D/ΔFmaxROP-U. This ratio has a value that ranges between 1 (if ΔFmaxROP-D has the same value as ΔFmaxROP-U) and 0 (is close to 0 when ΔFmaxROP-D is very small).

The smaller the value of that ratio; the higher is the difference between the untreated and the de-acidified oils. Overall, the results of the oxidation reactions carried out at medium temperature (40 °C) and in the presence of the radical initiator (AMVN) are in agreement with the results obtained from the Rancimat method, which works under conditions of high temperature.

From both the experimental results, in fact, it is confirmed that the de-acidified samples have a higher resistance to oxidative stress.

By analyzing the data so far collected and in order to explain the role of FFA on the oxidative stability of the oils, some relationships among the studied parameters were taken into consideration. Fig. 4 highlights the closest correlations found in this study. As shown, by correlating the RPO-U IT data and K232 values obtained for RPO-FFA, a very close linear relationship was found (Fig. 4A). In contrast, in the correlation study between the IT of RPO-U and the FFA, peroxide values and carotenoids gave insignificant results. The high significance of the correlation shown in Fig. 4A leads to the conclusion that under high temperature (130 °C) primary oxidation products, particularly those enclosed in the FFA fraction, have to be considered as highly pro-oxidant. Moreover, conjugated diene free fatty acids appear to be able to affect the oxidative stability of RPO more than the peroxide radicals that remain entirely in the de-acidified oil fractions (RPO-D) (see Table 1). As a result, the conjugated diene free fatty acids appear to have the role of initiator for these reactions at high temperature and therefore, their removal gives a considerable improvement of the oil oxidative stability, as shown by the results reported in Fig. 2. This evidence proves that a high presence of FFA significantly limits the use of crude RPO in cooking.2


image file: c6ra16953h-f4.tif
Fig. 4 Correlation plots between RPO-U IT data and K232 data of RPO-FFA (A); ΔFmaxROP-U data and peroxide data (B); RPO-D IT data and ΔFmaxROP-D/ΔFmaxROP-U ratio (C).

At the same time, for the oxidation carried out at medium-temperature, the peroxide value appears to have a crucial role (Fig. 4B), particularly for untreated oils, however, this positive relationship was minimized for the de-acidified oils (data not shown). Finally, the correlation between the IT of the de-acidified oils and the ΔFmaxROP-D/ΔFmaxROP-U ratio, which indicate the effectiveness of the de-acidification treatment, is shown in Fig. 4C. This relationship confirms that a low FFA content was crucial to improve the oil oxidation stability at both high and medium temperatures.

4. Conclusions

In the present study, we analyzed in detail the quality impact that the presence or absence of free fatty acids (FFA) has on the oil characteristics and in particular on the oxidative stability. A high content of FFA ranging from 8.3% to 14.5% in oleic acid was found for the four different red palm oils analyzed. This high value of FFA is notably far from the acceptable limit (2%) required for the European consumer. These results confirm that the high content of FFA red palm oil comes from the lipolytic activity that occurs during fruit working. Furthermore, FFA removal provided by an alkaline neutralization technique led to considerable improvements in the oil quality. In detail, the de-acidified oils show lower primary (K232) and secondary (K270) oxidation product values and higher DOBI indexes when compared to the untreated oils. Conversely, the peroxide and carotenoid values remained substantially unchanged after the de-acidification treatment. Remarkably, both the oxidation methods used (Rancimat and AMVN) unequivocally demonstrate a higher oxidative stability for the de-acidified oils compared with the untreated oils. Moreover, correlations among the analyzed parameters confirmed the crucial role of FFA on the oxidative stability of the oil. Overall, we have demonstrated that the high FFA and likewise, the conventional de-acidification and refining process considerably invalidate the potential of red palm oil and that both can be avoided by preventing the formation of FFA during the oil extraction process. This scenario justifies the need for innovative strategies to modify the traditional extraction process of RPO in order to improve oil quality.

Notes and references

  1. C. W. S. Hartley, The Oil Palm (Elaeis guineensis Jacq.), Prentice Hall Press, Longman Scientific and Technical, Hartley, Harlow, UK, 1988 Search PubMed.
  2. O. I. Mba, M. J. Dumont and M. Ngadi, Food Biosci., 2015, 10, 26–41 CrossRef CAS.
  3. I. N. Aini and M. S. Miskandar, Eur. J. Lipid Sci. Technol., 2007, 109, 422–432 CrossRef CAS.
  4. K. Ofosu-Budu and D. B. Sarpong, in Rebuilding West Africa's Food Potential, ed. A. e. Elbehri, FAO/IFAD, 2013, ch. 11 Search PubMed.
  5. C. J. Vincent, R. Shamsudin and A. S. Baharuddin, J. Food Eng., 2014, 143, 123–131 CrossRef CAS.
  6. G. F. N. Ebonogue, R. Dhouib, F. Carriere, P. H. A. Zollo and V. Arondel, Plant Physiol. Biochem., 2006, 44, 611–617 CrossRef PubMed.
  7. E. U. U. Ituen and I. V. O. Modo, Indigenous Knowledge and Development Monitor, 2000, 8, 7–12 Search PubMed.
  8. R. C. Cottrell, Am. J. Clin. Nutr., 1991, 53, S989–S1009 Search PubMed.
  9. D. O. Edem, Qual. Plant.–Plant Foods Hum. Nutr., 2002, 57, 319–341 CrossRef CAS.
  10. K. Sundram and A. Gapor, Lipid Technol., 1992, 4, 137–141 Search PubMed.
  11. J. M. Al-Saqer, H. S. Sidhu, S. N. Al-Hooti, H. A. Al-Amiri, A. Al-Othman, L. Al-Haji, N. Ahmed, I. B. Mansour and J. Minal, Food Chem., 2004, 85, 579–583 CrossRef CAS.
  12. R. Loganathan, K. R. Selvaduray, K. Nesaretnam and A. K. Radhakrishnan, Malaysian Journal of Nutrition, 2010, 16, 309–322 Search PubMed.
  13. P. E. Ebong, D. U. Owu and E. U. Isong, Qual. Plant.–Plant Foods Hum. Nutr., 1999, 53, 209–222 CrossRef CAS.
  14. K. Sundram, H. T. Khor, A. S. H. Ong and R. Pathmanathan, Cancer Res., 1989, 49, 1447–1451 CAS.
  15. M. L. Yam, S. R. A. Hafid, H. M. Cheng and K. Nesaretnam, Lipids, 2009, 44, 787–797 CrossRef CAS PubMed.
  16. S. B. Budin, F. Othman, S. R. Louis, M. Abu Bakar, S. Das and J. Mohamed, Clinics, 2009, 64, 235–244 CrossRef PubMed.
  17. C. K. Sen, C. Rink and S. Khanna, J. Am. Coll. Nutr., 2010, 29, 314S–323S CrossRef CAS PubMed.
  18. F. Cuomo, F. Venditti, A. Ceglie, A. De Leonardis, V. Macciola and F. Lopez, RSC Adv., 2015, 5, 85586–85591 RSC.
  19. A. De Leonardis, V. Macciola, F. Cuomo and F. Lopez, Food Chem., 2015, 175, 568–574 CrossRef CAS PubMed.
  20. P. K. Prasanth Kumar and A. G. Gopala Krishna, J. Oleo Sci., 2014, 63, 1209–1221 CrossRef PubMed.
  21. European Community, Off. J. Eur. Communities: Legis., 1991, 258, 1–82 Search PubMed.
  22. A. De Leonardis and V. Macciola, Food/Nahrung, 2004, 48, 209–212 CrossRef CAS PubMed.
  23. K. Akasaka, T. Takamura, H. Ohrui, H. Meguro and K. Hashimoto, Biosci., Biotechnol., Biochem., 1996, 60, 1772–1775 CrossRef CAS.
  24. M. Mosca, F. Cuomo, F. Lopez and A. Ceglie, Food Res. Int., 2013, 50, 377–383 CrossRef CAS.
  25. K. Akasaka, I. Sasaki, H. Ohrui and H. Meguro, Biosci., Biotechnol., Biochem., 1992, 56, 605–607 CrossRef CAS PubMed.
  26. M. Mosca, A. Diantom, F. Lopez, L. Ambrosone and A. Ceglie, Eur. Food Res. Technol., 2013, 236, 319–328 CrossRef CAS.
  27. N. Noguchi, R. Hanyu, A. Nonaka, Y. Okimoto and T. Kodama, Free Radical Biol. Med., 2003, 34, 1614–1620 CrossRef CAS PubMed.
  28. F. Cuomo, A. Ceglie and F. Lopez, J. Colloid Interface Sci., 2012, 365, 184–190 CrossRef CAS PubMed.
  29. F. Lopez, F. Cuomo, P. Lo Nostro and A. Ceglie, Food Chem., 2013, 136, 266–272 CrossRef CAS PubMed.
  30. C. B. Gonçalves, P. A. Pessoa and A. J. A. Meirelles, J. Food Eng., 2007, 81, 21–26 CrossRef.
  31. G. I. Onwuka and B. I. Akaerue, Res. J. Biol. Sci., 2006, 1, 16–19 Search PubMed.
  32. R. Sambanthamurthi, K. Sundram and Y. A. Tan, Prog. Lipid Res., 2000, 39, 507–558 CrossRef CAS PubMed.
  33. A. De Leonardis and V. Macciola, Food Chem., 2012, 135, 1769–1776 CrossRef CAS PubMed.

Footnote

Electronic supplementary information (ESI) available. See DOI: 10.1039/c6ra16953h

This journal is © The Royal Society of Chemistry 2016
Click here to see how this site uses Cookies. View our privacy policy here.