Synthesis of shape and size controlled copper indium diselenide (CuInSe2) via extrusion of selenium from 1,2,3-selenadiazole†
Anuraj S. Kshirsagar,
Priyesh V. More and
Pawan K. Khanna*
Nano Chemistry and Quantum Dots R & D Lab, Department of Applied Chemistry, Defence Institute of Advanced Technology (DIAT), Ministry of Defence, Govt. of India, Girinagar, Pune-411021, India. E-mail: pawankhanna2002@yahoo.co.in
First published on 5th September 2016
Abstract
Extrusion of selenium from cyclohexeno-1,2,3-selenadiazole (SDZ) was successfully utilized for the synthesis of CuInSe2 nanoparticles. Changes in various reaction parameters such as reaction temperature, concentration of oleic acid (OLA) and various other capping agents showed changes in the physical characteristics of the CISe nanoparticles. The reactions performed at various temperatures resulted in alteration in physical appearance, shape and size of the CISe nanoparticles which was confirmed by XRD, Williamson Hall analysis, particle size analyzer, SEM and TEM analysis. The variation in the amount of OLA only affected the particle size. Optical studies of as-synthesized CISe NPs revealed band gap ranging between 1.1–1.7 eV. HRTEM analysis confirmed the presence of CISe with a variety of shapes and lattice spacings of 0.33 nm corresponding to the (112) crystal plane.
1. Introduction
In recent times, size-tunable electronic and optical properties of semiconductor nanoparticles (NPs) have been proposed as highly demanding materials for applications in light emitting diodes (LEDs), thin film transistors (TFTs),1 absorber layers in solar cell devices,2 bio medical engineering3–5 etc. Amongst semiconductor NPs or QDs, group II–VI and IV–VI materials have enticed attention because of their application in thin film photovoltaics6–8 and have been widely studied. The band gap of such materials mainly depends on the size and shape. In comparison with their bulk counterpart, semiconductor NPs offer much improved significant properties such as, good photo stability with high emission quantum yields (QYs), high photoluminescence and ability to improve device performance via size tuning etc.9–11 Beyond binary semiconductors, the studies are mainly for NIR related energy devices. However, efforts have also been emphasized for their potential as solar cell materials. Thus, colloidal nanoparticles of I–III–VI2 (I = Cu, Ag; III = Ga, In; VI = S, Se, Te) group ternary chalcogenides have attracted much recent attention due to their unique structural and electronic properties coupled with high absorption coefficient as well as high photo stability.12 In addition, due to their low toxicity such materials are considered excellent alternate to cadmium or lead containing chalcogenides often employed for device applications.9,13,14Nanomaterials have applications in wide spectrum owing to their versatile nature. Nanotechnology thus has given new dimensions in the field of photovoltaics and in recent time several types of solar cell devices have been reported in literature e.g. semiconductor, dye and QDs sensitized solar cells, hybrid and heterojunction solar cells etc. Silicon based solar cells have been demonstrated to show high power conversion efficiency albeit not without the drawbacks such as indirect band gap of silicon, low absorption coefficient, high recombination rate driven from the thick layered structure etc. Additionally, Si-based solar cells are expensive due to their fabrication via high temperature vacuum based processes employing expensive equipment. Despite certain limitations silicon solar cells have dominated the last decades in terms of their commercial uses. With the availability of nanotechnology solar cells based on other semiconductor have also been demonstrated as highly promising due to possible high conversion efficiency. Among them ternary I–III–VI2 chalcopyrite type semiconductors such as CuInS2, CuInSe2 (CIS) and their alloys like CuInGaSe (CIGS) have progressed well as an alternative to Si-based solar cells15 because of many advantages e.g. their ability to absorb significant fraction of the photon energy from incident solar radiations (due to thin absorber layer) leading to high conversion efficiency and promising low processing cost. The power conversion efficiency (PCE) of about 19.9% have been reported for such solar cells with CIGS as absorber layer16 and that of 14% for CISe based solar device. However, these devices were fabricated by using expensive vacuum based techniques.17 PCE as high as 12.2% have been reported by Liu et al.18 using low cost, simple and non-vacuum based technique. Wherein hydrazine based approach was described for deposition of CISeS layer and band gap was tuned by changing the concentration of sulphur. Another report on the CISeS based solar cell device showed PCE of 10.1% via use of air stable, low toxic precursors especially avoiding use of hydrazine hydrate for deposition.19 Cu–In precursor film of CISe via colloidal solution deposition showed an improved power conversion efficiency (PCE) of 9%.20 Similarly, multiphase CISe NPs based and solution processed CISe solar cell have been reported by Jeong et al.21 showing an 8.2% PCE. There are examples of insertion of tellurium along with selenium to improve the efficiency however; outcome of such research is still in its early stage and will likely grow with time to offer better solution. Indeed, recently 3.2% efficiency has been demonstrated from a solar cell device made of alloyed CuInTeSe nanoparticles synthesized by hot injection method.22 The vast literature is now available and several recent reports emphasize on the importance of the I–III–VI2 group ternary chalcogenide NPs in the field of solar cell device.
Among the I–III–VI2 types of the semiconductors, copper indium diselenide (CuInSe2) is highly demanding and important due to its good radiation stability, large exciton Bohr radius (10.6 nm), narrow direct band gap (1.04 eV) and high absorption coefficient to the tune of 105 cm−1.23 This therefore offer scope for CISe2 to compete with silicon for solar cells. Appropriately, recent time has witnessed tremendous progress in the synthesis of CISe by various methods e.g. solvothermal,24 microwave,25,26 hydrothermal,27,28 chemical vapor deposition,29 hot-injection,30–33 pyrolysis,34 electrodeposition,35 vapor–liquid–solid growth route,36 single precursor decomposition37 etc. Amongst these popular methods, synthesis of the CISe NPs using chemical method provides good control over particle size, shape and overall optical properties. Some of the noted methods are reviewed briefly e.g. Guo et al.38 have described synthesis of highly monodisperse wurtzite nano-structured CISe via solution method for high performance organic–inorganic hybrid photodetectors due to its uniform hexagonal shape and monodispersed size. Size dependent (between 1.2 to 5.6 nm) band gap and blue shift in photoluminescence of CISe prepared by colloidal method has been described by Omata et al.39 Zhang et al.40 utilized non-injection route for the synthesis of single phase spherical CISe nanocrystals using triethanolamine as complex forming agent. Colloidal CuInSe2 nanocrystals was also reported by Wood et al.41 describing the use of bis(trimethylsilyl)amide (LiN(SiMe3)2) as shape and size controlling compound. Similarly, thermolysis of diorganyl dichalcogenides are also proved to be successful method for the synthesis of metal chalcogenides including CuInSe2 nanocrystals.42 Thermal decomposition of the single molecular precursor is also one of the interesting methods described in literature for the synthesis of ternary chalcogenides. Castro et al.43 have employed (PPh3)2, CuIn(SEt)4 and (PPh3)2CuIn(SePh)4 as single molecular precursor for the synthesis of CuInS2 and CuInSe2 nanoparticles in dioctyl phthalate. It has been shown that bis(trimethylsilyl) selenide can function as selenium transfer source during the synthesis of CISe via hot-injection method.44 Jain et al. have demonstrated the use of complexes of 2-pyridyl selenolate, 3-methyl-2-pyridyl selenolate, pyrimidyl-2-selenolate and 2-(4,6-dimethyl pyrimedyl)selenolates as single molecular precursors for the synthesis of CISe NPs and other metal chalcogenides.45a
It is therefore gathered from the literature that the synthesis of colloidal ternary semiconductor nanocrystals has been well documented however not without limitations and concerns. The limitation in synthesis of ternary chalcogenides warrants extensive research in synthesis of CISe and other semiconductors to realize commercially viable technology. Additionally, the aspect of toxicity must be addressed. There are several successful reports on use of amines and phosphine based organic reagents for synthesis of CISe, there is still wide scope to explore alternative methods for preparation of ternary chalcogenides avoiding the use of toxic reagents. On the other hand, organometallic compounds of organosulfur, organoselenium and organotellurium have been employed as precursor of chalcogens (S, Se, Te) in the synthesis of binary or ternary chalcogenides. Korgel et al.45b have demonstrated the use of selenourea for the synthesis of trigonal pyramidal CISe nanocrystals at 240 °C. Schlecht et al.45c demonstrated use of diphenyl diselenides or ditellurides which are well known precursors for the synthesis of metal selenides and tellurides via solution phase reaction. Diphenyl diselenide is also well documented for the synthesis of wurtzite phase of CISe, Cu2ZnSnSe4 NPs. Similarly, other organochalcogenides like diethyl sulfide, dimethyl sulfide, dibenzyl disulfide, allyl, tert-butyl, isopropyl diselenides, ditellurides are reported in literature for their use as precursor of respective chalcogen atom in the synthesis of metal chalcogenide NPs.46
Despite an impressive literature on various sources for selenium for ternary metal selenides synthesis, there is no report to date on the use of selenadiazoles as source of selenium. We have in the recent past, described formation of high quality, monodispersed phase pure binary chalcogenides47,48 by use of 1,2,3-selenadiazoles. During our studies on binary semiconductor metal selenide quantum dots such as CdSe, ZnSe and their core–shell nanostructures, we have proposed various mechanism about their formation by use of surface capping agents combined with free selenium generated in situ on thermal treatment and its reaction with respective metal ions. Successful implication of selenadiazole heterocycle as Se precursor for synthesis of binary selenides has impelled us to study its usefulness in the ternary chalcogenides as selenium precursor.
Present article therefore, focuses on the synthesis of copper indium selenide via use of cyclohexeno-1,2,3-selenadiazole (C6-SDZ) as selenium precursor as a novel source of selenium. Synthesis of CISe NPs were carried out by employing various reaction parameters such as temperature & concentrations of capping agent and their impact on size, shape and crystallinity by XRD, SEM/EDAX, TEM, XPS, UV-Visible, FTIR and Raman spectroscopy.
2. Experimental
2.1 Materials and methods
Indium chloride, diphenyl ether (DPE), oleic acid (OLA), dodecylamine (DDA), 1-octadecene (OD), mercapto propionic acid (MPA) were purchased from Sigma Aldrich India Ltd. Copper(II) chloride dihydrate and ethanol were procured from Merck India Ltd. All these chemicals were utilized as received. Cyclohexeno-1,2,3-selenadiazole (C6-SDZ) was prepared by reported method.35 Analytikjena SPECORD@210 plus spectrophotometer (Germany) was used to obtain UV-Visible absorption spectra of samples using chloroform as solvent at room temperature. Raman spectra were recorded using EZ Raman spectrometer (USA, λEm is 780 nm) in the range 4000 cm−1 to 400 cm−1. FTIR analysis was performed on FTIR Perkin Elmer spectrum one (USA) at room temperature using KBr pellets in the frequency range of 4000 cm−1 to 600 cm−1. Powder X-ray diffraction (XRD) patterns were acquired on a Bruker D8 Advance diffractometer (Germany) with Cu_Kα radiation (1.5405 Å) at 45 kV and 40 mA. Transmission Electron Microscopy (TEM) imaging was carried out using FEI Technai G2 with 300 kV. The samples were analysed by pouring a drop of diluted colloidal solution on carbon coated copper grid followed by drying. Scanning Electron Microscope (SEM) measurements were performed on Zeiss Gemini (Germany) operated at 300 kV. Thermogravimetric analysis (TGA) was done on Perkin Elmer TGA7 (USA) under nitrogen atmosphere between 25 °C to 850 °C at a constant heating rate of 10°C min−1. The particle size distribution of well dispersed samples was measured using NANOPHOX (SYMPATEC) particle size analyzer.2.2 Synthesis of CISe NPs using C6-SDZ: effect of temperature
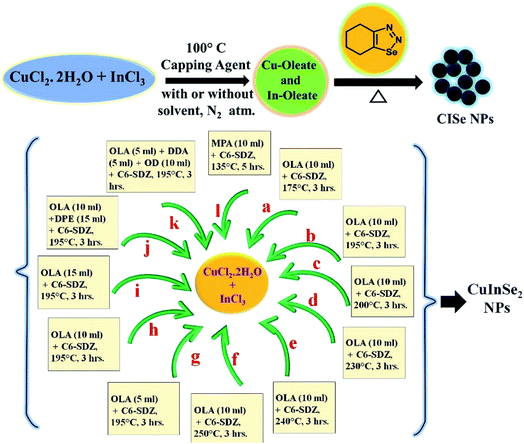
Copper(II) chloride dihydrate (0.5 g) and indium(III) chloride (0.64 g) were added in oleic acid (8.0 ml) and resulting mixture was heated to 120 °C under nitrogen atmosphere for 30–40 min to get a clear dense solution. Cyclohexeno-1,2,3-selenadiazole (0.96 g) was separately dissolved in oleic acid (2.0 ml) at room temperature and then swiftly injected in to the above reaction mixture at the same temperature. The addition of SDZ caused instant blackening indicating the beginning of formation of nanoparticles. The reaction temperature was then raised to 175 °C and mixture was stirred for about 3 h. Reaction mixture was cooled to room temperature and n-hexane (10 ml) was added to quench the reaction. Subsequently, ethanol (25 ml) was added to precipitate CISe NPs. The black precipitate of CISe was then collected by repeated centrifugation at 6000 rpm. The product was dried in an oven at 50 °C for 3–5 h and the sample was named as (a). Similarly, using same procedure as-above, CISe NPs were synthesized at different temperatures such as 195 °C, 200 °C, 230 °C, 240 °C and 250 °C and the samples were labeled as (b), (c), (d), (e) and (f) respectively. As-synthesized CISe NPs were stable at room temperature.2.3 Synthesis of CISe NPs: effect of concentration of oleic acid
The synthesis of CISe nanoparticles was also carried out by changing concentration of oleic acid as surfactant. The reactions were performed by keeping temperature (195 °C) and time (3 h) constant. The synthesis procedure for these experiments was same as explained in Section 2.2 above. However, ratio of oleic acid with respect to metal precursors was varied as 1![[thin space (1/6-em)]](https://www.rsc.org/images/entities/char_2009.gif) :
:![[thin space (1/6-em)]](https://www.rsc.org/images/entities/char_2009.gif) 5, 1
5, 1![[thin space (1/6-em)]](https://www.rsc.org/images/entities/char_2009.gif) :
:![[thin space (1/6-em)]](https://www.rsc.org/images/entities/char_2009.gif) 10 and 1
10 and 1![[thin space (1/6-em)]](https://www.rsc.org/images/entities/char_2009.gif) :
:![[thin space (1/6-em)]](https://www.rsc.org/images/entities/char_2009.gif) 15. In view of the above, 5 ml (g), 10 ml (h) and 15 ml (i) oleic acid was employed in order to understand its effect on the particle size and shape. It should be noted that experiment (h) discussed in the text, is a repeat of experiment (b) from Section 2.2 and CISe NPs were found to be stable at room temperature. The product was reproduced for fresh characterization and comparison purposes.
15. In view of the above, 5 ml (g), 10 ml (h) and 15 ml (i) oleic acid was employed in order to understand its effect on the particle size and shape. It should be noted that experiment (h) discussed in the text, is a repeat of experiment (b) from Section 2.2 and CISe NPs were found to be stable at room temperature. The product was reproduced for fresh characterization and comparison purposes.
2.4 Synthesis of CISe NPs: effect of combination of capping agents and solvents
The synthesis of CISe NPs using combination of oleic acid (10 ml) and diphenyl ether (15 ml) was performed at 195 °C and was labeled as (j). Similarly, sample labeled as (k) was synthesized using oleic acid (5 ml), dodecylamine (5 ml) and octadecene (10 ml). The synthesis using mercapto-propionic acid (10 ml) as capping agent (replacing OLA) was performed at 135 °C for 5 h and the product was labeled as (l). All the synthesis procedure for j, k, and l were same as described above (Section 2.2) and as-obtained CISe NPs were stable at room temperature.3. Results and discussion
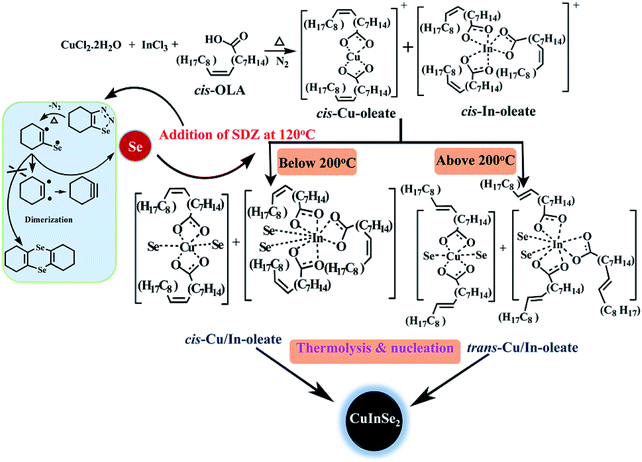
During synthesis of CISe NPs although there are three different elements with different oxidation states involved, formation of thermodynamically stable compound takes place with stoichiometric control. The reaction kinetics and thermodynamics play vital role in the synthesis of the NPs and therefore, choice of suitable precursors, reaction temperature, organic ligands as capping agent and solvent plays a pivotal role in the process of nucleation and growth of nanoparticles. The use of oleic acid as capping agent has several advantages such as (i) formation of metal oleate during the course of reaction which acts as an intermediate and can be decomposed at higher temperature (ii) it can act as solvent as well as capping agent and (iii) also facilitate the growth of nanoparticles in specific direction via conversion of cis oleic acid to its trans form at higher temperature.45c The general reaction path for the synthesis of CISe nanoparticles is presented in the Scheme 1.As far as formation pathway of CISe NPs is concerned, the reaction of copper and indium precursors with oleic acid generally leads to the formation of respective metal oleates as intermediates with cis configuration of the oleic acid in coordination sphere. Thereafter, the addition of SDZ at 120 °C sets the initial process via free radical formation which accelerates at higher temperature effecting the extrusion of reactive selenium. The key to formation of CISe is governed by effectively suppressing the formation of a dimer known as 1,4-diselenin (Scheme 2). It can be proposed that, at elevated temperature released selenium reacts with copper and indium–oleate complexes allowing the insertion of selenium in coordination sphere. The reactions performed below 200 °C possibly favor the complex formation with cis configuration of the oleate ligand while reactions executed above 200 °C will likely favor trans configuration of oleates in the complex. It is assumed that the growth of the CISe NPs would be restricted in presence of cis-OLA due to steric hindrance caused by its structural configuration.
Alternatively, the trans-OLA will promote the growth of CISe NPs due to its linear configuration. Thermolysis of such intermediates eventually leads to the formation of the CISe NPs. The conversion of cis to trans form of ligand (oleic acid) depends on temperature of the reaction mixture. The change in configuration of the ligand therefore will affect the size and morphology of the CISe NPs.
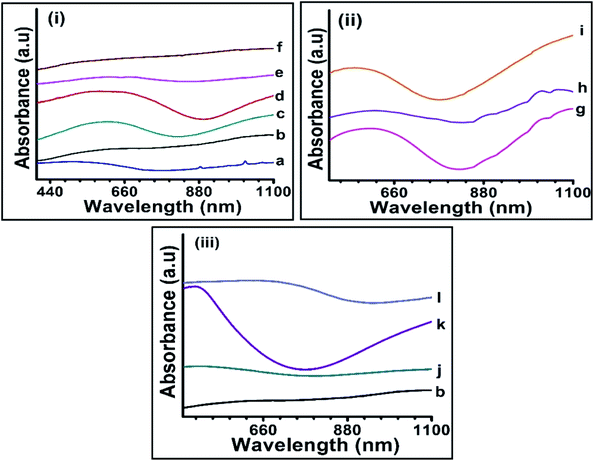
The optical properties of as-synthesized CISe nanoparticles were studied by UV-visible spectroscopy. CISe NPs synthesized at 175 °C, 200 °C and 230 °C (Fig. 1a, c and d) showed two absorption peaks, one in the visible region and the other tailing towards near IR region. The broad and mostly featureless absorption below 800 nm was observed due to presence of extremely small CISe nanoparticles (less than 5 nm) in the sample41 along with the larger sized nanoparticles. Similar profiles were observed for samples g, i and k where small sized CISe NPs were likely present. These observations suggest that synthesis of CISe NPs conducted at 175 °C and between 200 to 230 °C resulted in a combination of extremely small sized and relatively large sized CISe NPs irrespective of capping agents used. CISe NPs synthesized at 195 °C (b) and above 230 °C (e and f) showed relatively featureless profile, signifying the dominance of larger sized particles present in these samples. CISe NPs those synthesized using combination of oleic acid and diphenyl ether (j) as well as using MPA as surfactant (l) resulted in similar trend. The UV-visible spectra in some of the cases either resulted in featureless absorption curves or showed absorption near 1100 nm indicating bulk like behavior (bulk CISe band gap = 1.04 eV). The band gap of as-synthesized nanoparticles was obtained from Tauc's plot (Fig. 2) and was estimated to be higher than the bulk band gap of CISe (1 eV)12 for all samples.
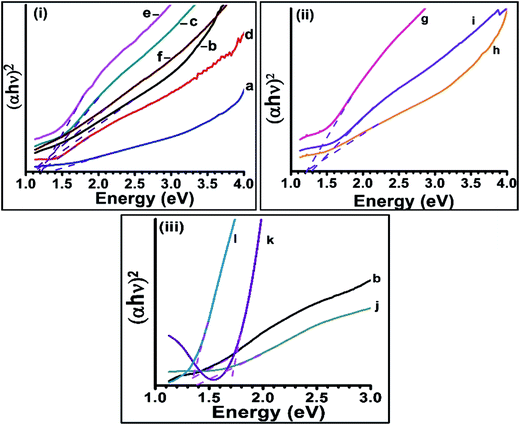 | ||
| Fig. 2 Tauc's plot of as-synthesized CISe nanoparticles. (i), (ii), (iii) are same as in Fig. 1. | ||
The samples synthesized between 200 °C to 230 °C showed large deviation from bulk band gap as compared to the samples synthesized below 200 °C and above 230 °C. The band gap calculated for a, b, c, j and l samples was around 1.1 eV which was near to the bulk band gap of CISe (calculated from Tauc's plot). Furthermore, the samples d, g, h and k showed the band gap in the range of 1.1 to 1.7 eV. The sample (k) prepared by using combination of OLA, DDA and OD showed largest band gap of ∼1.7 eV. The small size of CISe NPs suggests the presence of defects in their crystal structure which was further studied from XRD analysis.
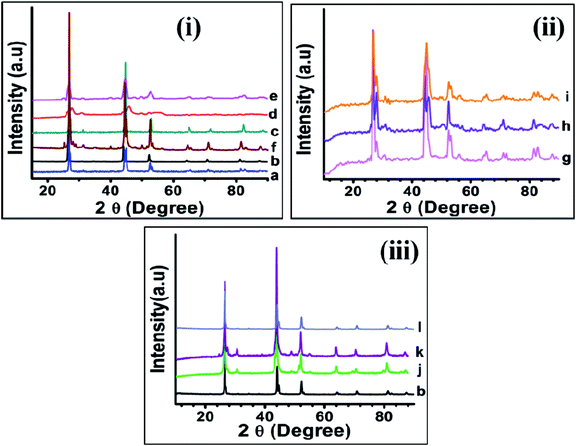
All reactions irrespective of changes in reaction parameters (temperature and ratio of reagents) resulted in formation of CISe nanoparticles as black powder. The powder XRD of CISe NPs synthesized at various temperatures [Fig. 3(i)a–f], changing concentration of capping agents [Fig. 3(ii)g–i] and employing different capping agents [Fig. 3(iii) b and j–l] confirmed formation of phase pure CISe NPs. According to the obtained XRD patterns, the major peaks were centered near 2θ 26.64°, 44.54°, 52.60° and are attributed to the (112), (220)/(204), (116)/(312) crystal planes. Other small peaks were also observed near 2θ 64.27° and 71.0° due to the Bragg's reflections for (008)/(400) and (316)/(332) crystal planes. In some cases, smaller peak at about 2θ 26.8° for crystal plane (103) was observed indicating the highly crystalline nature of the particles.14,49 The observed peaks highlight the presence of zinc blende phase ruling out presence of chalcopyrite phase due to absence of peak at 2θ 17.0°corresponding to (101) crystal plane in all the samples except sample f and k where small peaks at about 2θ 28.0° (002), 29.0° (101), 38.0° (102) and 49.0° (103) confirmed the formation of wurtzite phase in these samples. Thus, the increase in reaction temperature to 240 °C in presence of OLA alone (e) and the combination of OLA, DDA and OD (k) resulted in the formation of wurtzite phase of CISe. However, a combination of both the phases (wurtzite and zinc blend) cannot be ruled out in samples (f) and (k) as the intensity of the relevant peaks was relatively low. The calculated values of crystallite size have been presented in Table S1 ESI.†
The FTIR study of as-synthesized CISe NPs was carried out to understand the presence of capping agent around the nanoparticles. The FTIR spectra of CISe NPs synthesized at various temperatures is presented as a ESI in Fig. S1(i).† All the samples showed similar kind of spectrum with signature peaks of –OH stretching, –C–H asymmetric and symmetric stretching, C![[double bond, length as m-dash]](https://www.rsc.org/images/entities/char_e001.gif) O, C
O, C![[double bond, length as m-dash]](https://www.rsc.org/images/entities/char_e001.gif) C stretching as well as C–O stretching vibrations near 3400 cm−1, 2950–2790 cm−1, 1590–1610 cm−1, 1460–1490 cm−1 and 1000–1100 cm−1 respectively.50 These peaks are characteristic peaks of the oleic acid confirming its presence in all the samples synthesized at various temperatures. The CISe NPs synthesized using 5, 10 and 15 ml OLA also resulted in similar kind of spectrum as discussed above [ESI Fig. S1(ii)†]. Additionally, a weak peak at ∼970 cm−1 was observed confirming the presence of the trans-form of OLA (elaidic acid) in the sample.50b The change in the capping agent showed changes in the FTIR spectra as sample (k) where the mixture of OLA and DDA was used resulted in broad and intense peak near 3500 cm−1 due to the presence of hydroxyl (–OH) and amine groups together in the sample. The CISe NPs synthesized using MPA showed weak intensity peaks which could not be clearly identified [Fig. S1(iii)†] however, peaks due to C
C stretching as well as C–O stretching vibrations near 3400 cm−1, 2950–2790 cm−1, 1590–1610 cm−1, 1460–1490 cm−1 and 1000–1100 cm−1 respectively.50 These peaks are characteristic peaks of the oleic acid confirming its presence in all the samples synthesized at various temperatures. The CISe NPs synthesized using 5, 10 and 15 ml OLA also resulted in similar kind of spectrum as discussed above [ESI Fig. S1(ii)†]. Additionally, a weak peak at ∼970 cm−1 was observed confirming the presence of the trans-form of OLA (elaidic acid) in the sample.50b The change in the capping agent showed changes in the FTIR spectra as sample (k) where the mixture of OLA and DDA was used resulted in broad and intense peak near 3500 cm−1 due to the presence of hydroxyl (–OH) and amine groups together in the sample. The CISe NPs synthesized using MPA showed weak intensity peaks which could not be clearly identified [Fig. S1(iii)†] however, peaks due to C![[double bond, length as m-dash]](https://www.rsc.org/images/entities/char_e001.gif) O stretching was present in the sample. The peak for S–H from thiol (2500–2600 cm−1) was absent in MPA capped sample which confirms that the S atom from thiol was bonded with Cu/In to form a strong interaction at the surface of the CISe NPs. Confirmation of presence of particular surfactant in the sample was identified from the change in the appearance of the peaks as well as change in the nature of transmittance due to different functional groups.
O stretching was present in the sample. The peak for S–H from thiol (2500–2600 cm−1) was absent in MPA capped sample which confirms that the S atom from thiol was bonded with Cu/In to form a strong interaction at the surface of the CISe NPs. Confirmation of presence of particular surfactant in the sample was identified from the change in the appearance of the peaks as well as change in the nature of transmittance due to different functional groups.
The formation of CISe NPs by changing reaction parameters were also confirmed by Raman spectroscopy. In the Raman spectra of ternary selenide various peaks are possible due to different vibrational modes in the compound e.g. A1, E, E2 etc. The presence of intense peak near 174 cm−1 confirms the formation of CISe NPs. This peak was attributed to the A1 vibrational mode of selenium (Se) in CISe NPs. The dominant peak at 174 cm−1 was present in all the samples as it was evident from Fig. S2(i–iii).† The spectra obtained was noisy due to the presence of the organic capping on CISe NPs. The presence of very low intensity peak near 240 cm−1 is supposed to be due to the E vibrational mode in the CISe NPs. The absence of intense Raman scattering near 250–300 cm−1 confirms the purity of CISe NPs.51
3.1 Effect of temperature on particle size and shape
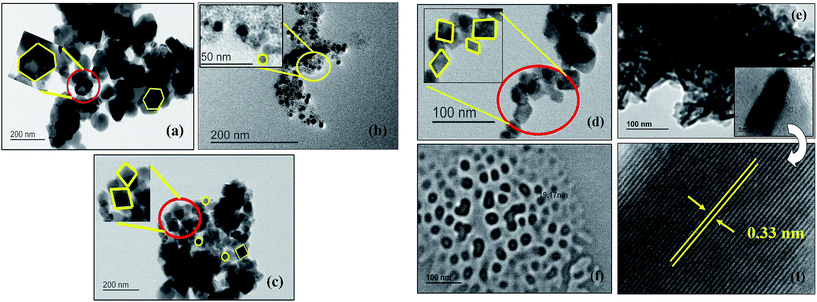
Morphological changes in CISe nanoparticles with respect to temperatures were studied by TEM and SEM. An anisotropic shape orientation was confirmed by TEM analysis of the samples synthesized at 175 °C (Fig. 4). The careful imaging showed presence of a mixture of hexagonal and spherical nano-particles with particle size ranging from 25–30 nm. Same reaction when carried out at higher temperatures showed changes in the shape and size of the nano-particles thus the synthesis performed at 195 °C resulted in particles with spherical and irregular morphology with size domain of 15–20 nm. The reaction carried out at 200 °C (c) and 230 °C (d) again resulted in formation of crystalline CISe NPs of anisotropic nature (combination of spherical and tetragonal bipyramidal) while particle size observed to be about 15–20 nm and 10–15 nm respectively. Similarly, the reaction performed at 240 °C (e) showed formation of rod like nano-structures with size domain of 20–25 nm along with elongated spherical CISe NPs while the reaction performed at 250 °C (f) led to formation of only spherical CISe NPs of 20 nm particle size. The correlation of the particle size obtained for the samples synthesized at various temperatures clearly confirms the decrease in the particle size as temperature increased and lower size domain was observed for the sample synthesized at 230 °C. Further CISe obtained at higher temperatures showed increase in the particle size.The lattice spacing of about 0.33 nm corresponding to the (112) crystal plane of CISe NPs was obtained from TEM images in case of the CISe synthesized at 240 °C as shown in the inset of Fig. 4(e). Lattice spacing of 0.33 nm is closely supported by literature value as well as our current analysis by TEM during the change in concentration of OLA for other samples described in Section 3.2. The change in morphology of CISe NPs prompted us to investigate the role of OLA and its behavior at various reaction temperatures. It is assumed that cis and trans configuration of oleic acid will dictate the particle size to certain extent in similar manner that has been described by one of us for magic-sized CdSe by use of oleic acid under microwave irradiation.45c
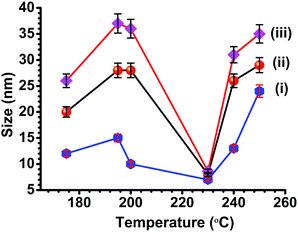
We believed that the presence of cis-OLA was significant when the reaction temperature was maintained below 200 °C leading to small sized CISe NPs. Alternatively, the presence of trans-OLA was dominant when the reaction temperature was above 200 °C aiding the growth of CISe NPs. As expected, a mixture of small sized CISe NPs (due to cis-OLA) and large CISe NPs (due to trans-OLA) were observed in the samples synthesized below 200 °C (Fig. 4(i)b; inset). The results obtained from SEM are in good agreement with the TEM results indicating change in the shape of the CISe nanoparticles with change in reaction temperature. Fig. 5(a) clearly shows the presence of 2D hexagonal CISe NPs in the product synthesized at 175 °C. Tetragonal bipyramidal shaped CISe NPs were synthesized at higher temperatures. It can be seen in image (d) that the aggregated particle is pyramidal in nature. High clustering was detected in all the samples possibly because of large excess of capping agents. The compositional and stoichiometric correctness of CISe formation was studied by EDAX analysis [Fig. S3(a–f)†]. Careful analysis of the EDAX spectra showed that the CISe samples were nearly stoichiometric with slight copper richness. The excess copper content in some of the samples could be due to insufficient reaction time or due to deficiency of selenium because of slow reaction and non-stoichiometric extrusion of selenium.52 It is to be noted that optimum temperature and time is key to formation of stoichiometric composition. Fig. 6 emphasizes on the trends obtained for particle size against the temperature variation. The Scherrer's equation was employed to understand the changes in the crystallite size at different temperature. The calculated values of average crystallite size suggested that the variation in temperature from 175 °C to 250 °C leads to change in the crystallite size which indeed is possible because of altered reaction kinetics.
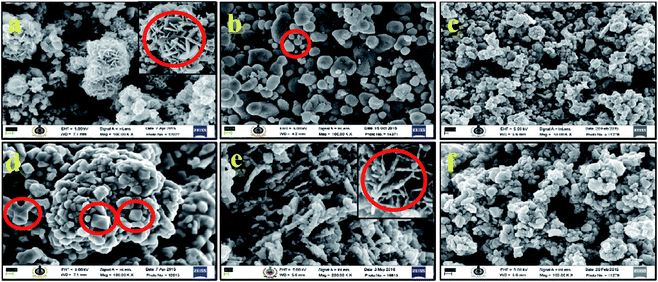 | ||
| Fig. 5 SEM images of CISe NPs synthesized at (a) 175°, (b) 195°, (c) 200°, (d) 230°, (e) 240° and (f) 250 °C (Scale bar 100 nm for all images). | ||
The trend observed for the crystallite size suggested increase in the particle size as reactions temperature were ramped from 175 °C to 200 °C. However, exception was observed at 230 °C where smaller crystallite size was obtained which is might be the optimum reaction condition as the yield of the product was maximum at this temperature. Interestingly, reactions performed below and above 230 °C showed increased crystallite size (Fig. 6) possibly due to factors such as inhomogeneous nucleation and growth process, slow or random release of free selenium and variation in surface capping.
Alternately, Williamson–Hall plot (β![[thin space (1/6-em)]](https://www.rsc.org/images/entities/char_2009.gif) cos
cos![[thin space (1/6-em)]](https://www.rsc.org/images/entities/char_2009.gif) θ vs. sin
θ vs. sin![[thin space (1/6-em)]](https://www.rsc.org/images/entities/char_2009.gif) θ) is well known for particle size and lattice strain determination.53a The uniform deformation model (UDM) was employed for the determination of particle size and strain using following equation,
θ) is well known for particle size and lattice strain determination.53a The uniform deformation model (UDM) was employed for the determination of particle size and strain using following equation,
 | (1) |
The term (β![[thin space (1/6-em)]](https://www.rsc.org/images/entities/char_2009.gif) cos
cos![[thin space (1/6-em)]](https://www.rsc.org/images/entities/char_2009.gif) θ) was plotted against (4ε
θ) was plotted against (4ε![[thin space (1/6-em)]](https://www.rsc.org/images/entities/char_2009.gif) sin
sin![[thin space (1/6-em)]](https://www.rsc.org/images/entities/char_2009.gif) θ) for the preferred peaks of the CISe and is presented in ESI Fig. S4.† In eqn (1), β = full width at half maximum (FWHM), θ = diffraction peak, λ = X-ray wavelength, D = particle size, ε = lattice strain and k = 0.9.
θ) for the preferred peaks of the CISe and is presented in ESI Fig. S4.† In eqn (1), β = full width at half maximum (FWHM), θ = diffraction peak, λ = X-ray wavelength, D = particle size, ε = lattice strain and k = 0.9.
The particle size obtained from Williamson–Hall plot by linear fitting was found to follow same trend as obtained from XRD (ESI Table S1†). The intercept of the plot corresponds to the particle size while slope of Williamson–Hall plot indicate the lattice strain in the particle. The positive values of the lattice strain indicate lattice expansion while negative values indicate lattice shrinkage. The lattice expansion and shrinkage arises possibly due to the point defects and poor crystallinity in the samples.53b,c The increase in the particle size was observed for reactions executed at 175°, 195° and 200 °C while decrease in size was observed when reaction performed at 230° and 240 °C. Similar trend was observed when as-synthesized CISe (re-dispersed and diluted) were subjected to the particle size analysis using dynamic light scattering (DLS) technique (ESI Fig. S5 and Table S1†). The particle size obtained from particle size analyzer was comparatively smaller since diluted and well dispersed CISe NPs first centrifuged and then employed for the analysis. The calculated values of particle size from XRD, Williamson–Hall plot, particle size analyzer, band gap and lattice strain are presented in ESI Table S1.†
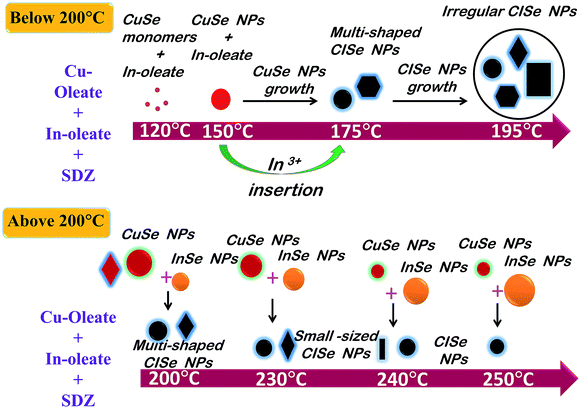
The overall changes in shape and size of CISe NPs suggests that the reaction temperature is an important parameter for growth of nanoparticles. Initial decomposition of SDZ starts at 120 °C and continues till about 160 °C. As the temperature increases, the rate of decomposition of SDZ and release of Se increases. It is believed that when reactions are performed at low temperatures (i.e. below 155 °C), copper selenide nanoparticles were formed along with free selenium (Fig. S6†). Subsequently, the insertion of In3+ and Se2− ions takes place systematically to form CISe NPs. However, it has been reported in literature that, indium selenide formation takes place around 200 °C.42 Thus, the CISe NPs synthesized below 200 °C follow the formation pathway where copper selenide nanoparticles are formed first followed by diffusion of In and Se ions. Whereas, the reaction above 200 °C may involve formation of copper selenide and indium selenide and their further diffusion eventually results in CISe NPs. Since, the SDZ amount was same for consumption, the size of copper and indium selenide before formation of CISe NPs may vary. The particle size of copper selenide nanoparticles below 200 °C is expected to be more as the controlled release of Se by SDZ can result in slow nucleation. It was observed from the TEM/SEM images that irregular shaped CISe NPs were formed in the final product highlighting the initial formation of irregular shaped copper selenide. The slow nucleation coupled with presence of both cis and trans form of OLA may result in the irregular shape of copper selenide leading to various size and shaped CISe Nps. The fact that the particle size of as-formed CISe NPs at 195 °C was slightly larger than 175 °C supports the above assumption well. The decrease in CISe NPs size at 230 °C could be due to near equal sized copper and indium selenide formation. The fusion or dissolution of both copper and indium selenide would thus result in relatively smaller CISe NPs. Further, the trend reverses at 240 °C and 250 °C as the size of indium selenide must be dominant compared to the size of copper selenide component. This, therefore, might be responsible for an overall increase in the size of CISe NPs at 240 °C and 250 °C (Scheme 3).
3.2 Effect of OLA concentration, solvents and other capping ligands
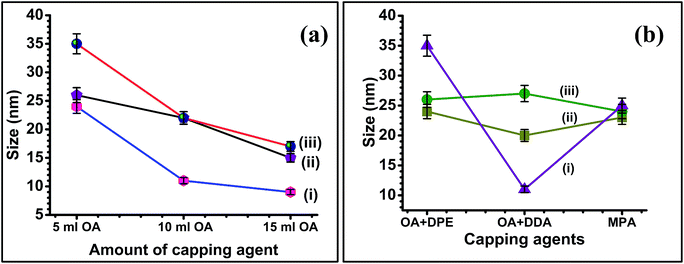
The reaction of copper, indium and selenium precursors resulted in formation of CISe NPs irrespective of concentration of OLA. Interestingly, there was no change in the nanoparticle shape when OLA concentration was changed. The particle size however decreased as the OLA amount was increased from 5 ml to 15 ml. This trend was supported by the crystallite and particle size obtained from XRD, Williamson–Hall plot (Fig. S8†) and particle size analyzer (Table S1 and Fig. S5†). The increased amount of OLA could help to complete formation of metal oleates (with copper as well as indium ions) as intermediate during the course of reaction and thus further helps to improve the reactivity with the C6-SDZ. This may also lead to good micelle formation once the reaction gets completed. The size of the CISe NPs therefore can be well controlled by increasing OLA amount.The TEM analysis [Fig. S7†] of CISe NPs also revealed the formation of smaller particles. HRTEM images obtained clearly show the lattice fringes with lattice spacing of about 0.3 nm which were in good agreement with the ‘d’ spacing obtained from line profile. The d-spacing obtained corresponding to the (112) crystal plane of the CISe NPs which was also evident from XRD studies. The SEM images revealed high agglomeration of the particles but aggregation was visibly less when 15 ml OLA was employed. Even though change in the particle size cannot be well predicted from SEM images, unchanged shape of CISe NPs can be easily seen since all three figures were clearly revealing the formation of spherical shaped nanoparticles. The CISe NPs synthesized using 5 ml OLA resulted in formation of spherical particles with substantial agglomeration as it is evident from Fig. 7(g). Other CISe NPs synthesized using 10 ml and 15 ml OLA resulted in smaller size particles with comparatively less agglomeration [Fig. 7(h) and (i)]. According to the compositional study by EDAX analysis the increased amount of the OLA resulted in the formation of the copper rich and selenium deficient CISe NPs [Fig. S3(g–i)†]. The synthesis of CISe NPs using various capping agents along with solvents was also studied and it was observed that, there was no such difference in the particle size and shape by variation of capping agents as observed with OLA. During this study other reaction parameters were kept constant except temperature of the reaction using MPA where the reaction was performed at 135 °C owing to its low boiling point. The reaction carried out in OLA without any solvent was compared here with the reactions performed using mixture of OLA and DPE as well as mixture of OLA, DDA, octadecene and MPA alone. It is found that nearly matching particle size with spherical morphology resulted from all the synthesis. As discussed earlier CISe NPs synthesized in OLA alone resulted in spherical particles with crystallite size of about 20 nm (obtained from XRD). The reaction by introducing DPE as solvent along with OLA also resulted in CISe NPs with nearly same physical appearance as confirmed from XRD and W–H plots (Fig. S9†), SEM and TEM respectively. Another reaction using mixture of capping agents OLA and DDA in presence of 1-octadecene as solvent also revealed nearly same physical properties indicating no effect of capping agents and solvents on the reactivity of C6-SDZ and thus on the final physical properties of the CISe NPs. According to the TEM analysis, size domain of CISe NPs was 15–30 nm when reactions were carried out using different capping agents. The change in particle size with respect to the change in capping agent is obvious because of the different reactivity and functional groups of the surfactants employed. Fig. 8(j) revealed formation of non-agglomerated nearly 10–12 nm sized CISe NPs with d-spacing of 0.33 nm.
 | ||
| Fig. 7 SEM images of CISe NPs synthesized using 5 ml (g), 10 ml (h) and 15 ml (i) OLA as capping agent [scale bar 30 nm for all images]. | ||
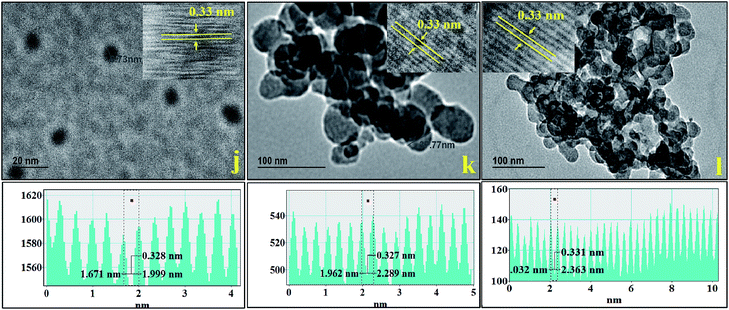 | ||
| Fig. 8 TEM images of CISe NPs synthesized using (j) OLA + DPE, (k) OLA + DDA + 1-octadecene and (l) MPA. Inset shows HRTEM images revealing lattice fringes of CISe NPs. | ||
However, in case of sample j and k agglomerated CISe NPs were observed with little bigger size domain (∼25–30 nm) with d-spacing of 0.3 nm corresponding to the (112) crystal plane of CISe NPs (Fig. 8). Similarly, SEM images revealed agglomerated CISe NPs with spherical morphology [Fig. 9(j) and (k)]. Similar trend was also observed for the reaction carried out using MPA. SEM image obtained at scale bar of 100 nm clearly indicate spherical particles with comparatively less agglomeration [Fig. 9(j) and (k)]. Fig. 10 indicates the change in particle size with respect to change in concentration and nature of capping. Based on XRD and Williamson–Hall plots the particle size was found to be nearly same however, it showed some variation when measured using particle size analyzer (Fig. S5 and S9†). According to the EDAX analysis there was slight difference in the compositional ratio of CISe NPs. As synthesized CISe was found to be nearly stoichiometric in composition [Fig. S3(j–l)†].
 | ||
| Fig. 9 SEM images of CISe NPs synthesized using (j) OLA + DPE, (k) OLA + DDA + 1-octadecene and (l) MPA (scale bar 100 nm). | ||
3.3 XPS analysis of CISe NPs
The oxidation states of various elements in as-synthesized CISe NPs were confirmed by X-ray photoelectron spectroscopy (XPS) (Fig. 11). The complete scan of the CISe NPs shows presence of Cu, In, Se, O and C in the sample. It was observed that; all elements were found in their expected oxidation states. High resolution XPS of copper showed two peaks for Cu 2p3/2 and 2p1/2 states with binding energy of about 931.8 eV and 951.9 eV respectively. The peak splitting value of 20.1 eV confirms the presence of monovalent copper in the sample.38 The monovalent nature of copper was observed due to the reduction of Cu2+ to Cu+ during the reaction. Similar observation was obtained in case of indium, as two symmetric peaks were observed near 444.5 eV and 452.0 eV corresponding to the 3d5/2 and 3d3/2 states of trivalent indium with peak separation of about 7.5 eV. The selenium 3d peak was obtained at 54.2 eV indicating the presence of Se2−. The presence of peak near 288 eV and 530 eV were assigned to the 1 s state of the carbon and oxygen respectively. These elements were observed due to the presence of organic capping over the CISe NPs. Guo et al.38 estimated that the binding energy value for monovalent copper (2p3/2) was 931.8 eV, In 444.5 eV and Se 54.2 eV indicating the similar oxidation states as observed in the present case. Thus the analysis confirms near stoichiometric composition with high purity.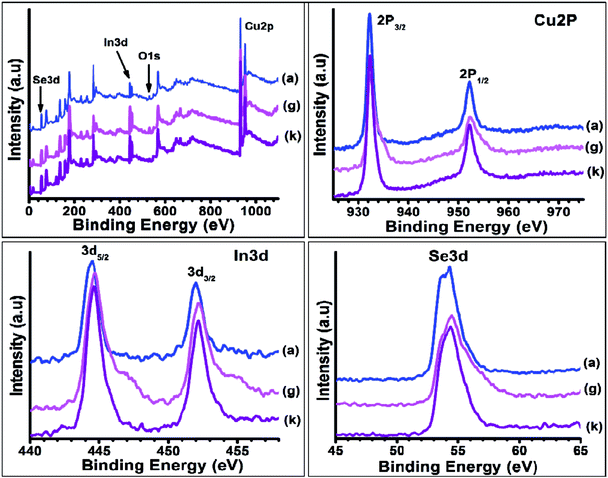 | ||
| Fig. 11 XPS of CISe NPs synthesized at 175 °C (a), using 5 ml OLA (g) and using oleic acid, dodecylamine as surfactant in octadecene (k). | ||
3.4 TGA analysis of CISe NPs
As-synthesized CISe nanoparticles were subjected to the thermo-gravimetric analysis revealing the three stage decomposition. The decomposition of the CISe NPs measured in terms of percentage weight loss mainly occurred due to the presence of organic surfactant associated with the material. Initial 3% weight loss as shown in Fig. S10† was observed in the temperature range of 300–400 °C due to the vaporization of the oleic acid present in the sample as surfactant (boiling point of the oleic acid is 360 °C). In second step 12% decomposition was mainly due to the complete loss of the oleic acid while in third step 18% weight loss after 590–600 °C was observed which can be attributed to the dissociation of the CISe NPs. The sharp slope after 400 °C was obtained indicating the instability of oleic acid while CISe decomposition after 600 °C was observed to be slow. The absence of weight loss near 100–200 °C suggesting the sample was free from absorbed environmental moisture.4. Conclusions
The current article describes the first ever use of cyclohexeno-1,2,3-selenadiaziole as selenium precursor for successful synthesis of copper indium diselenide (CISe). The formation of CISe NPs was confirmed by XRD, SEM, TEM, Raman, FTIR and other tools. The synthesis of CISe nanoparticles were studied by changing various reaction parameters such as temperature, concentration of OLA as capping agent and combination of various other capping agents. The change in reaction parameters resulted in change in physical appearance of the CISe NPs without affecting the crystal structure or phase. The temperature effect revealed change in size and shape of the CISe nanoparticles. The reaction performed at 230 °C resulted in smaller particle size while reactions at various temperatures (175 °C to 250 °C) resulted in CISe NPs of varied shape. The increase in amount of oleic acid resulted in decreased particle size however, synthesis by changing capping agents does not affect the size and shape of the CISe NPs.Acknowledgements
We are thankful to vice chancellor of DIAT (DU) for encouragement and JRF to ASK. PKK thanks DIAT for an internal research grant through project no. DIAT/F/REG (G)/AC/Project. We are grateful to the NIT Jaipur for XPS analysis.Notes and references
- D. V. Talapin, J. S. Lee, M. V. Kovalenko and E. V. Shevchenko, Chem. Rev., 2010, 110, 389–458 CrossRef CAS PubMed
.
- H. W. Hillhouse and M. C. Beard, Curr. Opin. Colloid Interface Sci., 2009, 14, 245–259 CrossRef CAS
.
- I. L. Medintz, H. T. Uyeda, E. R. Goldman and H. Mattoussi, Nat. Mater., 2005, 4, 435–446 CrossRef CAS PubMed
.
- X. Michalet, F. F. Pinaud, L. A. Bentolila, J. M. Tsay, S. Doose, J. J. Li, G. Sundaresan, A. M. Wu, S. S. Gambhir and S. Weiss, Science, 2005, 307, 538–544 CrossRef CAS PubMed
.
- S. Bhanoth, A. S. Kshirsagar, P. K. Khanna, A. Tyagi and A. K. Verma, Adv. Nanopart., 2016, 5, 1–8 CrossRef
.
- K. Ramanathan, M. A. Contreras, C. L. Perkins, S. Asher, F. S. Hasoon, J. Keane, D. Young, M. Romero, W. Metzger, R. Noufi, J. Ward and A. Duda, Prog. Photovoltaics, 2003, 11, 225–230 CAS
.
- R. Klenk, J. Klaer, R. Scheer, M. C. Lux-Steiner, I. Luck, N. Meyer and U. Ruhle, Thin Solid Films, 2005, 480, 509–514 CrossRef
.
- I. Repins, M. A. Contreras, B. Egaas, C. De Hart, J. Scharf, C. L. Perkins, B. To and R. Noufi, Prog. Photovoltaics, 2008, 16, 235–239 CAS
.
- E. Cassette, T. Pons, C. Bouet, M. Helle, L. Bezdetnaya, F. Marchal and B. Dubertret, Chem. Mater., 2010, 22, 6117–6124 CrossRef CAS
.
- W. A. Tisdale, K. J. Williams, B. A. Timp, D. J. Norris, E. S. Aydil and X. Y. Zhu, Science, 2010, 328, 1543–1547 CrossRef CAS PubMed
.
- V. Sukhovatkin, S. Hinds, L. Brzozowski and E. H. Sargent, Science, 2009, 324, 1542–1544 CrossRef CAS PubMed
.
- H. Zhong, Z. Wang, E. Bovero, Z. Lu, F. C. J. M. van Veggel and G. D. Scholes, J. Phys. Chem. C, 2011, 115, 12396–12402 CAS
.
- K. Sanderson, Nature, 2009, 459, 760–761 CrossRef PubMed
.
- A. Martelli, E. Rousselet, C. Dycke, A. Bouron and J.-M. Moulis, Biochimie, 2006, 88, 1807–1814 CrossRef CAS PubMed
.
- L. Stolt, J. Hedstrom, J. Kessler, M. Ruckh, K. O. Velthaus and H. W. Schock, Appl. Phys. Lett., 1993, 62, 597–599 CrossRef CAS
.
- J. AbuShama, S. Johnston, T. Moriarty, G. Teeter, K. Ramanathan and R. Noufi, Prog. Photovoltaics, 2004, 12, 39–45 CAS
.
-
(a) A. F. da Cunha, F. Kurdzesau and P. M. P. Salom, Mater. Sci. Forum, 2006, 514, 93–97 CrossRef
; (b) D. R. Hollars, R. Dorn, P. D. Paulson, J. Titus and R. Zubeck, Mater. Res. Soc. Symp. Proc., 2005, 865, F14.34.1 CrossRef
.
- W. Liu, D. B. Mitzi, M. Yuan, A. J. Kellock, S. J. Chey and O. Gunawan, Chem. Mater., 2010, 22, 1010–1014 CrossRef CAS
.
- W. Zhao, Y. Cui and D. Pan, Energ. Tech., 2013, 1, 131–134 CrossRef CAS
.
- Y. S. Lim, H.-S. Kwon, J. Jeong, J. Y. Kim, H. Kim, M. J. Ko, U. Jeong and D.-K. Lee, ACS Appl. Mater. Interfaces, 2014, 6(1), 259–267 CAS
.
- S. Jeong, B.-S. Lee, S. J. Ahn, K. H. Yoon, Y.-H. Seo and Y. Choia, Energy Environ. Sci., 2012, 5, 7539–7542 CAS
.
- S. Kim, M. Kang, S. Kim, J.-H. Heo, J. H. Noh, S. H. Im, S. I. Seok, S.-W. Kim and B.-H. Ryu, ACS Nano, 2013, 7, 4756–4763 CrossRef CAS PubMed
.
- M. Buffiere, A. E. Zaghi, N. Lenaers, M. Batuk, S. Khelifi, J. Drijkoningen, J. H. Stesmans, J. Kepa, V. V. Afanas’ev, J. Hadermann, J. D'Haen, J. Manca, J. Vleugels, M. Meuris and J. Poortmans, J. Phys. Chem. C, 2014, 118, 27201–27209 CAS
.
- Y. H. Yang and Y. T. Chen, J. Phys. Chem. B, 2006, 110, 17370–17374 CrossRef CAS PubMed
.
- C. C. Landry and A. R. Barron, Science, 1993, 260, 1653–1655 CAS
.
- H. Grisaru, O. Palchik, A. Gedanken, V. Palchik, M. A. Slifkin and A. M. Weiss, Inorg. Chem., 2003, 42, 7148–7155 CrossRef CAS PubMed
.
- B. Li, Y. Xie, J. X. Huang and Y. T. Qian, Adv. Mater., 1999, 11, 1456–1459 CrossRef CAS
.
- J. Yang, J.-Y. Kim, J. H. Yu, T.-Y. Ahn, H. Lee, T.-S. Choi, Y.-W. Kim, J. Joo, M. J. Ko and T. Hyeon, Phys. Chem. Chem. Phys., 2013, 15, 20517–20525 RSC
.
- A. M. Gabor, J. R. Tuttle, D. S. Albin, M. A. Contreras, R. Noufi and A. M. Hermann, Appl. Phys. Lett., 1994, 65, 198–200 CrossRef CAS
.
- Q. J. Guo, S. J. Kim, M. Kar, W. N. Shafarman, R. W. Birkmire, E. A. Stach, R. Agrawal and H. W. Hillhouse, Nano Lett., 2008, 8, 2982–2987 CrossRef CAS PubMed
.
- M. G. Panthani, V. Akhavan, B. Goodfellow, J. P. Schmidtke, L. Dunn, A. Dodabalapur, P. F. Barbara and B. A. Korgel, J. Am. Chem. Soc., 2008, 130, 16770–16777 CrossRef CAS PubMed
.
- H. Z. Zhong, Y. C. Li, M. F. Ye, Z. Z. Zhu, Y. Zhou, C. H. Yang and Y. F. Li, Nanotechnology, 2007, 18, 025602 CrossRef
.
- J. Tang, S. Hinds, S. O. Kelley and E. H. Sargent, Chem. Mater., 2008, 20, 6906–6910 CrossRef CAS
.
- P. R. Figueroa, T. Painchaud, T. Lepetit, S. Harel, L. Arzel, J. Yi, N. Barreau and S. Velumani, Thin Solid Films, 2015, 587, 112–116 CrossRef
.
- S. Phok, S. Rajaputra and V. P. Singh, Nanotechnology, 2007, 18, 475601–475608 CrossRef
.
- H. Peng, D. T. Schoen, S. Meister, X. F. Zhang and Y. Cui, J. Am. Chem. Soc., 2007, 129, 34–35 CrossRef CAS PubMed
.
- A. J. Wooten, D. J. Werder, D. J. Williams, J. L. Casson and J. A. Hollingsworth, J. Am. Chem. Soc., 2009, 131, 16177–16188 CrossRef CAS PubMed
.
- J.-J. Wang, Y.-Q. Wang, F.-F. Cao, Y.-G. Guo and L.-J. Wan, J. Am. Chem. Soc., 2010, 132, 12218–12221 CrossRef CAS PubMed
.
- K. Nose, T. Omata and S. O.-Y. Matsuo, J. Phys. Chem. C, 2009, 113, 3455–3460 CAS
.
- W.-L. Liu, M.-Q. Wu, R.-C. Zhou, L.-D. Yan, S.-R. Zhang and Q.-Y. Zhang, Bull. Korean Chem. Soc., 2011, 32, 4332–4336 CrossRef CAS
.
- O. Yarema, D. Bozyigit, I. Rousseau, L. Nowack, M. Yarema, W. Heiss and V. Wood, Chem. Mater., 2013, 25, 3753–3757 CrossRef CAS PubMed
.
- R. L. Brutchey, Acc. Chem. Res., 2015, 48, 2918–2926 CrossRef CAS PubMed
.
- S. L. Castro, S. G. Bailey, R. F. Rafello, K. K. Banger and A. F. Hepp, Chem. Mater., 2003, 15, 3142–3147 CrossRef CAS
.
-
(a) P. M. Allen and M. G. Bawendi, J. Am. Chem. Soc., 2008, 130(29), 9240–9241 CrossRef CAS PubMed
; (b) C. B. Murray, D. J. Norris and M. G. Bawendi, J. Am. Chem. Soc., 1993, 115, 8706–8715 CrossRef CAS
.
-
(a) B. Koo, R. N. Patel and B. A. Korgel, J. Am. Chem. Soc., 2009, 131, 3134–3135 CrossRef CAS PubMed
; (b) R. K. Sharma and V. K. Jain, Synthesis and Characterization of Single Source Molecular Precursors for Binary and Ternary Materials, PhD Thesis, University of Mumbai, India, October 2013
; (c) A. Jadhav, P. V. More and P. K. Khanna, RSC Adv., 2015, 5, 76733–76742 RSC
.
-
(a) M. E. Norako and R. L. Brutchey, Chem. Mater., 2010, 22, 1613–1615 CrossRef CAS
; (b) J.-J. Wang, J.-S. Hu, Y.-G. Guo and L.-J. Wan, NPG Asia Mater., 2012, 4, e2 CrossRef
; (c) Y. Guo, S. R. Alvarado, J. D. Barclay and J. Vela, ACS Nano, 2013, 7, 3616–3626 CrossRef CAS PubMed
.
-
(a) B. Sreenu, P. V. More, A. Jadhav and P. K. Khanna, RSC Adv., 2014, 4, 17526–17532 RSC
; (b) P. K. Khanna, R. K. Beri, P. V. More and B. G. Bharate, Curr. Appl. Phys., 2010, 10, 553–556 CrossRef
; (c) P. K. Khanna, P. V. More, R. Shewate and R. K. Beri, Chem. Lett., 2009, 38, 676–677 CrossRef CAS
.
- P. K. Khanna, R. M. Gorte and R. Gokhale, Mater. Lett., 2004, 58, 966–969 CrossRef CAS
.
-
(a) M. Kar, R. Agrawal and H. W. Hillhouse, J. Am. Chem. Soc., 2011, 133, 17239–17247 CrossRef CAS PubMed
; (b) K. K. Jang, P. Prabhakaran, D. Chandran, J.-J. Park and K.-S. Lee, Opt. Mater. Express, 2012, 2, 519–525 CrossRef CAS
.
-
(a) K.-L. Lei, C.-F. Chow, K.-C. Tsang, E. N. Y. Lei, V. A. L. Roy, M. H. W. Lam, C. S. Lee, E. Y. B. Pun and J. Li, J. Mater. Chem., 2010, 20, 7526–7529 RSC
; (b) M. Sun, H. Yu, W. Yang, L. Qi, F. Yang and X. Yang, Colloids Surf., A, 2009, 350, 91–100 CrossRef CAS
.
- R. P. Oleksak, B. T. Flynn, D. M. Schut and G. S. Herman, Phys. Status Solidi A, 2014, 211(1), 219–225 CrossRef CAS
.
- Z. Han, D. Zhang, Q. Chen, T. Mei and S. Zhuang, Powder Technol., 2013, 249, 119–125 CrossRef CAS
.
-
(a) V. D. Mote, Y. Purushotham and B. N. Dole, Journal of Theoretical and Applied Physics, 2012, 6, 1–8 CrossRef
; (b) A. K. Zak, W. H. A. Majid, M. E. Abrishami and R. Yousefi, Solid State Sci., 2011, 13, 251–256 CrossRef
; (c) N. S. Gonçalves, J. A. Carvalho, Z. M. Lima and J. M. Sasaki, Mater. Lett., 2012, 72, 36–38 CrossRef
.
Footnote |
| † Electronic supplementary information (ESI) available: Calculated particle size and other values, FTIR, Raman, EDAX, Williamson–Hall plots, particle size, XRD of CuSe and TGA of CISe. See DOI: 10.1039/c6ra16933c |
| This journal is © The Royal Society of Chemistry 2016 |

