 Open Access Article
Creative Commons Attribution 3.0 Unported Licence
Effectiveness and mechanisms of ammonium adsorption on biochars derived from biogas residues
Qiangqiang
Yu
ab,
Dong
Xia
a,
Heng
Li
a,
Lanting
Ke
a,
Yuanpeng
Wang
a,
Haitao
Wang
a,
Yanmei
Zheng
*a and
Qingbiao
Li
*ac
aDepartment of Chemical and Biochemical Engineering, College of Chemistry and Chemical Engineering, Xiamen University, Xiamen 361005, P. R. China. E-mail: zym@xmu.edu.cn; kelqb@xmu.edu.cn
bZhejiang Provincial Key Laboratory of Water Science and Technology, Department of Environment in Yangtze Delta Region Institute of Tsinghua University, Zhejiang, Jiaxing 314006, P. R. China
cCollege of Chemistry and Life Science, Quanzhou Normal University, Quanzhou 362000, P. R. China
First published on 30th August 2016
Abstract
The solid by-product of anaerobic digestion derived biochar has been used as an adsorbent for the liquid by-product and is a viable and environmental friendly way to control waste. In this study, two biochars (BC-PM, BC-ST) from pig manure biogas residue (BR-PM) and straw biogas residue (BR-ST) were assessed for ammonium adsorption. The ammonium adsorption on both BC-PM and BC-ST followed the Elovich kinetic model and fit well with the Langmuir isotherm, whereas BC-PM was better than BC-ST at absorbing ammonium. In addition, the adsorption mechanism was elucidated by analysing the physicochemical properties of the biochars. The Brunauer–Emmett–Teller (BET) surface area, pore structure and micromorphology, which are mainly related to the carbon in the biochars, had no direct correlation with the ammonium adsorption capacity. However, the ash in the biochars played an important role in ammonium adsorption. The metal elements in biochar ash significantly decreased after adsorption, especially potassium, which nearly disappeared as a result of ion exchange with ammonium. However, the quartz and carbonate mineral in biochar ash also functioned as ammonium adsorption sites according to Fourier transform infrared spectroscopy (FT-IR) and X-ray diffraction (XRD) analysis. This study revealed the irreplaceable role of ash in biochars for ammonium adsorption, which will guide the preparation of biochars from different types of feedstocks for ammonium adsorption.
1. Introduction
Anaerobic digestion for waste management and renewable energy production contributes considerably to environmental protection and the attention on energy recovery has grown in recent years.1,2 However, biogas digestate, the inevitable by-product is produced in large quantities and must be handled and utilized appropriately because of its potential risk of repeated pollution.3–5 In particular, solid, biogas residue that contains high proportions of hemicellulose, lignin and ash etc., is also a good precursor of biochar which is a carbon-rich solid product generated from pyrolyzing biomass, including rice husk, sugarcane bagasse, manure and biogas residues with the exclusion of oxygen.6–9 Biochars have good stability and physicochemical properties and have been developed as absorbents to remove pollutants such as aromatic contaminants, heavy metals, dyestuff and ammonium.10–13Ammonium is one of the most abundant contaminants in the liquid by-product (biogas slurry) after anaerobic digestion and is also a common nutrient in wastewater from industrial, agricultural and household activities. It contributes to the eutrophication of rivers and lakes,14,15 and even 0.2 mg L−1 can be toxic to aquatic life.16 Adsorption is a feasible process for ammonium removal and has been well documented by many researchers. Meanwhile, numerous types of absorbents such as zeolite, fly ash and sepiolite, among others, have been developed, with a key production point being low-cost and high-efficiency.17–20
As low-grade biomass, biogas residue derived biochars are inexpensive. More importantly, biochars possess particular advantageous properties. For example, some studies note the cost advantage of biochars derived from fermentation residue,21–23 and revealed that these biochars had better adsorption properties than undigested feedstocks used directly.24 Although there is little information on the ammonium absorption properties of biochars derived from biogas residues, the studies of biochars produced from other biomass also provide a wealth of inspiration. Biochars prepared from plant biomass,25 corn cob,13 giant reed,26 exhibit good ammonium adsorption performance. Additionally, many studies generally concluded that the BET surface area and pore structure of biochars are the main contributions to the adsorption system.27–29 However, the highest ammonium adsorption capacity among biochars dose not correlate with the biggest BET surface area, which indicates that biochar properties, such as BET surface area and pore structure have no direct correlation with the ammonium adsorption capacity.13,25,26 Therefore, there must be factors influencing biochar ammonium adsorption capacity other than the above properties. In fact, biochar, consists of two main composites, carbon and ash. The former determines the BET surface area and pore structure, whereas the effect of ash has not been studied systematically. Although there are several studies reported on biochars, there are few in-depth studies on the ammonium absorption of biochars derived from biogas residues. Furthermore, although there are some preliminary experiment examining the adsorption mechanism of ion exchange in ash,30,31 the specific contribution from SiO2 and minerals in biochar ash are usually neglected, which might be a crucial factor in biochar ammonium adsorption.
Therefore, this study aimed to assess the value of low-cost biochars derived from biogas residues, as efficient alternative absorbents for ammonium removal. Furthermore, the structural properties (composition, porous structure and surface chemistry) and ammonium adsorption of biochars prepared from two typical biogas residues (pig manure biogas residue and straw biogas residue) were compared. More importantly, the effect of ash composition on ammonium adsorption was investigated, providing insight into different the ammonium adsorption mechanism of biochars. This study met the requirements of low-cost and effective ammonium removal, and describes a value-added and environmentally friendly method to treat biogas residue.
2. Materials and methods
2.1 Source of raw materials
Biogas residues, the raw material for biochars, were by-products of anaerobic digestion from pig manure (PM) and straw (ST) in our own laboratory and were named BR-PM and BR-ST, respectively. All of the chemicals in this study were purchased from Sinopharm Chemical Reagent Co., Ltd. and used as received without further purification.2.2 Preparation of biochar
The biochar precursors BR-PM and BR-ST were chemically activated before being pyrolyzed. One gram of precursors were impregnated in 1 g L−1 KOH solution for 12 h, and dried at 105 °C. Then, the samples were pyrolyzed at 550 °C for 2 h with a ramp rate of 5 °C min−1 in a tube furnace (SK2-1-12, Tianye, China) under a N2 atmosphere (100 mL min−1), which was similar to a previous study.32 Then, the biochars were washed with excess deionized water and stirred with a glass rod for 5 minutes after pyrolyzation, which was repeated three times. Finally, they were dried at 80 °C in an oven for 12 h. Accordingly, the two types of biochars were named BC-PM and BC-ST.2.3 Analytical methods
X-ray diffraction (XRD) analysis was performed on an Ultima IV X-ray Diffractometer (Rigaku, Japan) operated at 35 kV and 10 mA, with a scanning rate of 20° min−1 and a 2θ angle ranging from 5° to 70° using CuKα radiation (λ = 0.15418 nm). The carbon, nitrogen, hydrogen and sulphur content of the samples were analysed with an elemental analyser (Vario EL III, Elementar, Germany). Ash content was determined by heating the samples at 600 °C for 4.0 h with a ramp rate of 10 °C min−1 in a muffle furnace. Fourier transform infrared spectroscopy (FT-IR) spectra were obtained on a Nicolet Avatar 660 (Thermo Electron, USA) using the KBr pellet method. The cation exchange capacity (CEC) of the biochar was measured using the Schollenberger and Simon method.33 The biochar was saturated with 1 mol L−1 neutralized ammonium acetate and subsequently washed with 95 v/v% alcohol. It was then transferred into a 150 mL kjeldahl flask to distill and titrate. The Brunauer–Emmett–Teller (BET) surface area and average pore size of the biochars were measured using an Automated Physisorption and Chemisorption Analyser (Tristar 3000, USA) with N2 adsorption/desorption at −196 °C. All of the samples were degassed at 300 °C for 2 h before measurement. Biochar morphology and surface composition were investigated using a scanning electron microscope (SEM) with Energy Dispersion X-ray Spectrometry (EDX) capability (ZEISS SIGMA, Germany).2.4 Adsorption of ammonium
The adsorption performance of the biochars toward ammonium was evaluated using two types of wastewater. One NH4+-containing artificial wastewater solution was prepared from NH4Cl. The concentration of NH4+–N was 100 mg L−1, and the initial pH of the solution was approximately 5.0 without adjustment. A real sample of NH4+-containing wastewater was collected from the supernatant of the biogas slurry produced from pig manure anaerobic digestion in our own laboratory. Its NH4+–N concentration was approximately 855 mg L−1 after centrifugation at approximately 10![[thin space (1/6-em)]](https://www.rsc.org/images/entities/char_2009.gif) 000g (RCF) for 5 min before use. The detailed quality parameters of the biogas slurry are listed in Table 1.
000g (RCF) for 5 min before use. The detailed quality parameters of the biogas slurry are listed in Table 1.
| Parameters | Means and standard deviations |
|---|---|
| pH | 7.20 ± 0.20 |
| COD (mg L−1) | 980 ± 12.55 |
| NH4+–N (mg L−1) | 855.73 ± 12.64 |
| PO43−–P (mg L−1) | 20.35 ± 1.84 |
| Ca (mg L−1) | 51.90 ± 0.96 |
| Mg (mg L−1) | 59.25 ± 1.22 |
| K (mg L−1) | 240.29 ± 3.44 |
| Na (mg L−1) | 121.43 ± 1.55 |
Kinetics experiments in the two types of wastewater were performed to examine how the adsorption behaviour of ammonium on biochars relate to contact time. Adsorbent (0.03 g, 1.0 g L−1) was mixed with 30 mL wastewater solution without adjusting the pH in a thermostatic shaker at 30 °C/180 rpm, and the concentration of residual ammonium at different time points was measured. The supernatant was filtered through a 0.45 μm membrane, and the residual ammonium concentration (Ct) was measured using the Nesslerization method with a Thermo scientific Evolution 220 UV-Visible spectrophotometer at 420 nm.34
The ammonium adsorption capacity of the biochar was calculated according to the mass balance equations
| qt = (C0 − Ct)V/m | (1) |
3. Results and discussion
3.1 Characterization of biogas residues and biochars
The elemental analysis and ash content of BR-PM, BR-ST, BC-PM and BC-ST, in addition to the BET surface areas, average pore size and biochar yields for both biochars are listed in Table 2. The two types of biogas residue contained similar elemental (CHNS) content. The ash content of BR-PM and BR-ST was 31.21 ± 1.53% and 17.75 ± 0.89%, respectively. However, the derived biochars exhibited a quite different carbon content, ash content and yield. The carbon content of BC-PM was 15.75 ± 0.14%, whereas that of BC-ST reached 37.59 ± 0.16%. The ash content of BC-PM (62.93 ± 2.66%) was higher than that of BC-ST (49.67 ± 2.05%). More importantly, another distinct difference was the BET surface area, which was higher for BC-ST (260.21 m2 g−1) than BC-PM (167.88 m2 g−1). The average pore radius on BC-PM and BC-ST were calculated as 4.08 and 2.57 nm, respectively, using nitrogen adsorption isotherms and classified as mesoporous according to the International Union of Pure and Applied Chemistry (IUPAC).35| Element (means and standard deviations) | Ash (%) | Yield (%) | CEC (mmol g−1) | S BET (m2 g−1) | Average pore size (nm) | ||||
|---|---|---|---|---|---|---|---|---|---|
| C/% | H/% | N/% | S/% | ||||||
| BR-PM | 33.19 ± 1.45 | 4.71 ± 0.42 | 3.75 ± 0.18 | 0.74 ± 0.07 | 31.21 ± 1.53 | ||||
| BR-ST | 33.06 ± 0.66 | 4.76 ± 0.13 | 2.64 ± 0.07 | 0.40 ± 0.02 | 17.75 ± 0.89 | ||||
| BC-PM | 15.75 ± 0.14 | 1.52 ± 0.01 | 0.83 ± 0.01 | 0.85 ± 0.01 | 62.93 ± 2.66 | 48.51 ± 1.20 | 2.18 ± 0.03 | 167.88 | 4.08 |
| BC-ST | 37.59 ± 0.16 | 1.90 ± 0.03 | 0.80 ± 0.01 | 0.42 ± 0.08 | 49.67 ± 2.05 | 35.15 ± 0.45 | 0.893 ± 0.03 | 260.21 | 2.57 |
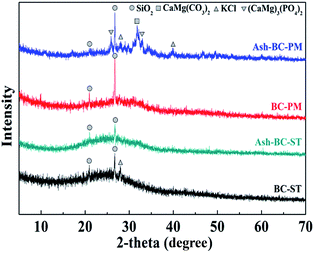
The XRD patterns of BC-PM, BC-ST and their ashes are shown in Fig. 1, which was used to probe the short range ordered biochar structures and the presence of miscellaneous crystalline minerals.36
There was a sharp peak at 20.99° and 26.74° in the two biochars confirming the presence of quartz in both of them.37,38 This finding indicated that both of the biochars were amorphous materials, lacking a distinct crystalline structure, and no other significant peaks were observed. However, a few new peaks appeared on Ash-BC-PM, the sample of BC-PM after calcination at 600 °C in air for 2 h. Specifically, peaks at 26° and 33° were assigned to (CaMg)3(PO4)2/Whitlockite; peaks at 28° and 41° were due to sylvite (KCl), and a peak at 31° confirmed the presence of CaMg(CO3)2/dolomite.37,39 These results suggested that BC-PM actually contained appreciable amounts of metals and carbonate that was absent from the XRD pattern because of the carbon coverage. The minerals might be present within the biochar pores rather than on the biochar surface, therefore, washing the biochars with water is ineffective, and these minerals are evident via XRD only after removing carbon (via calcination). The mineral XRD peaks emerged once the carbon was burnt off. Cao et al.40 also similarly reported that biochars derived from dairy manure commonly contained high levels of Ca, Mg and P. Furthermore, Herrera et al.41 reported that these minerals were from superfluous dietary intakes. As for the Ash-BC-ST XRD pattern, the BC-ST sample after calcination, only one weak peak at 28° emerged to confirm trace amounts of KCl. Based on the above analysis, KCl was present in BC-ST as well. Therefore, it can be speculated that BC-ST contained fewer minerals than BC-PM, which might affect their ammonium adsorption behaviour.
3.2 Adsorption kinetics study
The adsorption kinetics on biochars was investigated to determine the time required to reach the adsorption equilibrium and further examine the mechanisms of ammonium adsorption. Fig. 2 shows time dependent ammonium adsorption on BC-PM and BC-ST in artificial wastewater and biogas slurry. In artificial wastewater (Fig. 2a), the ammonium adsorption equilibrium for BC-PM and BC-ST was reached after approximately 4.0 h with an adsorption capacity of 13.66 mg g−1 and 11.36 mg g−1, respectively, and approximately 80% and 90% of the equilibrium adsorption capacity was reached within the first 1.0 h, respectively. In biogas slurry (Fig. 2b), equilibrium was also established in 4.0 h for BC-PM and BC-ST with an adsorption capacity of 26.82 mg g−1 and 19.16 mg g−1, respectively. The results indicated that ammonium adsorption on the two biochars was a rapid process.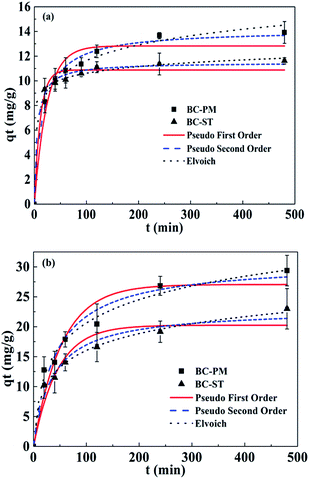 | ||
| Fig. 2 Kinetics of ammonium adsorption on BC-PM and BC-ST in artificial wastewater (a) and biogas slurry (b) with data fit to pseudo-first-order, pseudo-second-order and Elovich. | ||
In addition, the kinetics data were also analysed using pseudo-first-order, pseudo-second-order and Elovich models, and the calculated model parameters are shown in Table 3. Elovich models were suitable for describing the ammonium adsorption process in both artificial wastewater and biogas slurry.
| Models | Parameters | Artificial wastewater | Biogas slurry | ||
|---|---|---|---|---|---|
| BC-PM | BC-ST | BC-PM | BC-ST | ||
| Pseudo-first-order | q e (mg g−1) | 12.83 | 10.88 | 27.04 | 20.24 |
| k 1 (min−1) | 0.0413 | 0.0879 | 0.0188 | 0.0221 | |
| R 2 | 0.955 | 0.976 | 0.920 | 0.916 | |
| Pseudo-second-order | q e (mg g−1) | 14.14 | 11.48 | 30.77 | 22.95 |
| k 2 (g mg−1 min−1) | 0.0044 | 0.0156 | 0.0008 | 0.0012 | |
| R 2 | 0.992 | 0.994 | 0.966 | 0.967 | |
| Elovich | A (mg g−1 min−1) | 10.72 | 6880 | 2.183 | 2.092 |
| B (g mg−1) | 0.5475 | 1.2902 | 0.1774 | 0.2458 | |
| R 2 | 0.993 | 0.998 | 0.986 | 0.994 | |
3.3 Adsorption isotherms study
The adsorption isotherms for ammonium on BC-PM and BC-ST in artificial wastewater (concentration range from 0–100 mg L−1) and biogas slurry (concentration range from 0–855 mg L−1) fit to the Langmuir and Freundlich models at 30 °C are presented in Fig. 3. The Langmuir model fit the data better than the Freundlich model for BC-PM, whereas the Freundlich model described the data better for BC-ST. The simulation parameters for the two models are presented in Table 4. In particular, the Langmuir maximum capacity for BC-PM in artificial wastewater and biogas slurry were 37.26 mg g−1 and 48.89 mg g−1, respectively, which were both higher than those of BC-ST for the adsorption of ammonium from artificial wastewater and biogas slurry, respectively.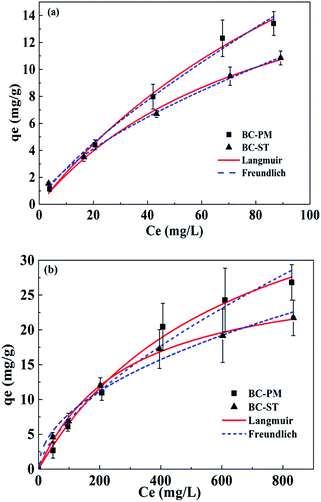 | ||
| Fig. 3 Isotherms of ammonium adsorption on BC-PM and BC-ST in artificial wastewater (a) and biogas slurry (b) with data fit to the Langmuir and Freundlich models. | ||
| Models | Parameters | Artificial wastewater | Biogas slurry | ||
|---|---|---|---|---|---|
| BC-PM | BC-ST | BC-PM | BC-ST | ||
| Langmuir | q m (mg g−1) | 37.26 | 21.17 | 48.89 | 28.86 |
| b (L mg−1) | 0.0068 | 0.0115 | 0.0016 | 0.0035 | |
| R 2 | 0.992 | 0.985 | 0.993 | 0.997 | |
| Freundlich | K f (mg g−1) | 0.4553 | 0.5833 | 0.3415 | 0.8268 |
| n | 1.3039 | 1.5338 | 1.5182 | 2.0340 | |
| R 2 | 0.988 | 0.998 | 0.976 | 0.983 | |
In general, BC-PM exhibited better ammonium adsorption than BC-ST in artificial wastewater or biogas slurry.
3.4 Adsorption performance comparison
To illustrate the potential of the BC-PM and BC-ST prepared in this study as promising biochars for ammonium adsorption with improved ammonium adsorption behaviours, the maximum adsorption capacities of various agro-based biochars in the literatures prepared in similar pyrolyzation conditions were also investigated and compared, as listed in Table 5. The maximum ammonium adsorption capacities of BC-PM and BC-ST reached 37.26/48.89 mg g−1 and 21.17/28.86 mg g−1 in artificial/real wastewater, respectively, which were much higher than biochars prepared from rice husk or hardwood in similar adsorption conditions. It also indicated that biogas residue could be an alternative precursor of the biochars for ammonium adsorption.| Raw materials | Pyrolyzation conditions | Wastewater | q m (mg g−1) | Ref. |
|---|---|---|---|---|
| a Ramp rate is not mentioned. | ||||
| Rice husk | 700 °C, 2 h, 5 °C min | Artificial wastewater (NH4Cl) | 3.24 | 30 |
| Hardwood shavings | 300 °C, 8–10 h, nma | Dairy manure effluent | 5.3 | 42 |
| Corn cob | 400 °C, 2 h, nma | Artificial wastewater (NH4Cl) | 15.3 | 13 |
| Thalia dealbata | 600 °C, 2 h, 5 °C min | Artificial wastewater (NH4Cl) | 11.2 | 25 |
| Giant reed (Arundo donaxL.) | 300 °C, 2 h, 10 °C min | Artificial wastewater (NH4Cl) | 2.10 | 26 |
| Lignite | 300 °C, 18 h, nma | Artificial wastewater (NH4Cl) | 28.43 | 43 |
| Biogas residue (pig manure) | 550 °C, 2 h, 5 °C min | Artificial wastewater (NH4Cl)/biogas slurry | 37.26/48.89 | This work |
| Biogas residue (straw) | 550 °C, 2 h, 5 °C min | Artificial wastewater (NH4Cl)/biogas slurry | 21.17/28.86 | This work |
3.5 Ammonium adsorption mechanism
The above studies showed that BC-PM and BC-ST showed excellent ammonium adsorption performance. As mentioned in the section on BET analysis, BC-PM had a lower specific surface area. However, BC-PM had a higher adsorption capacity than BC-ST, suggesting that the BET surface area is not the main factor in ammonium adsorption. Biochars contain two main components, carbon and ash, and the BET surface area and pore structure were mainly determined by carbon content, leading us to examine the composition and content of the ash in both biochars.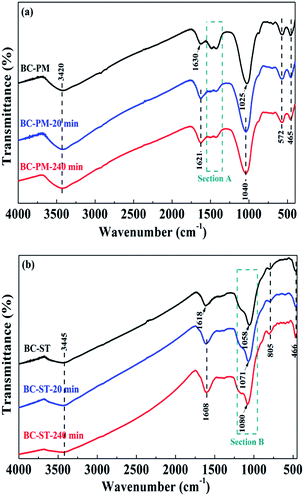 | ||
| Fig. 5 FT-IR spectra of BC-PM (a), BC-ST (b) and the same samples after ammonium adsorption at 20 min and 240 min. | ||
The broad bands at 3420 cm−1 (Fig. 5a) and 3445 cm−1 (Fig. 5b) were attributed to the O–H stretching vibration of BC-PM and BC-ST, respectively. The bands centred on 1630 (Fig. 5a) and 1618 cm−1 (Fig. 5b) were attributed to O–H bending vibrations.46 The strong bands for BC-PM and BC-ST at 1025 cm−1 and 1058 cm−1 were assigned to an asymmetric Si–O–Si stretching mode. Peaks at 572 cm−1 and 805 cm−1, neither of which split in two, were assigned to a symmetric Si–O–Si stretching mode.45,47 The above results indicated that SiO2 in both biochars was present in an amorphous state, which was also confirmed by the XRD patterns. However, the peaks for asymmetrically stretching Si–O–Si in BC-PM shifted to 1040 cm−1 after 20 min and 240 min adsorption. In addition, the peaks for asymmetrically stretching Si–O–Si were also detected to show a blue-shift after adsorption by BC-ST. Specifically, as shown in section B (Fig. 5b), 13 cm−1 was shifted in the first 20 min, and another 9 cm−1 in the later 220 min. These shifts can be attributed to electrostatic interactions between SiO2 and ammonium, and the SiO2 in the biochars may have acted as ammonium adsorption sites, playing a significant role in the process. Si–O–Si, the main functional groups on the two biochars, was from SiO2 in biochar ash. Thus, another component in biochar ash was verified to contribute to ammonium adsorption.
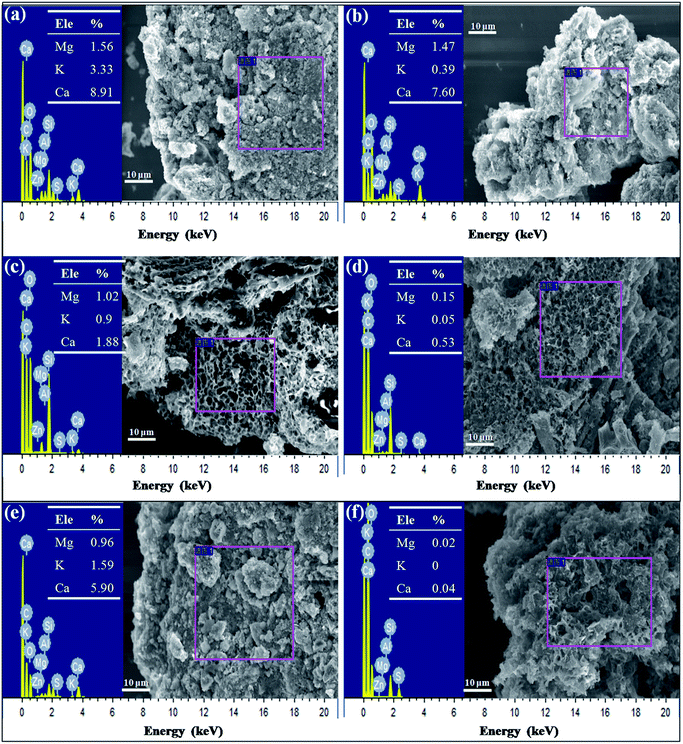
To verify their exact effect on ammonium adsorption, BC-PM was treated with water for 8 h because carbonates dissolve in water after a long treatment time. As expected, water treatment weakened the FT-IR peaks for carbonates, which is shown in section C of Fig. 6a. Furthermore, the ash content of water treated with BC-PM barely decreased, and the EDX spectra analyses of BC-PM treated by water (Fig. 4e) also showed that its metal content was barely decreased. Accordingly, BC-PM's ammonium adsorption capacity only decreased to 11.87 mg g−1 from 13.66 mg g−1 of the control as shown in Fig. 6b. Thus, the reduced ammonium adsorption capacity (1.79 mg g−1) on water treated BC-PM might be attributed to the slight dissolution of carbonate and the accompanying decreasing additional ammonium adsorption sites on mineral components.
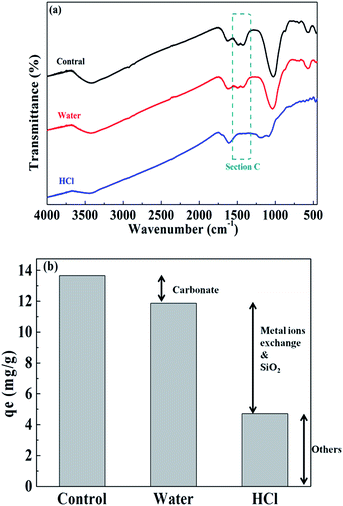 | ||
| Fig. 6 Comparison of the FT-IR spectra of BC-PM after various treatments (a) and the ammonium adsorption capacity contribution of different components (b). | ||
For HCl-treated BC-PM, the ash content fell sharply to 35.27% from 62.93%. The SEM imaging and EDX spectral analyses (Fig. 4f) showed that the structure became more porous, and the metal content (Mg, K, Ca) was nearly zero, owing to the dissolution of mineral components by HCl. The results of FT-IR (Fig. 6a) showed that the carbonates peaks disappeared and SiO2 peaks weakened after HCl treatment. Accordingly, the ammonium adsorption capacity decreased from 13.66 mg g−1 to 4.72 mg g−1. Thus, the reduced ammonium adsorption capacity (8.94 mg g−1) on HCl-treated BC-PM was not caused by the same phenomenon as water treatment, but rather by a combined action of missing metal ion exchange, carbonates and reduced SiO2. In addition, the porous structure of biochar enhanced by HCl treatment seemed to have little effect promoting ammonium adsorption capacity. In general, the effect of carbonate mineral components on additional adsorption sites in biochar for ammonium adsorption was less than metal ion exchange and SiO2 effect.
4. Conclusions
Two biochars (BC-PM and BC-ST) were prepared from pig manure and straw biogas residues through activation and then pyrolyzation. They both exhibited good ammonium adsorption in artificial wastewater and biogas slurry. The kinetics of ammonium adsorption on BC-PM and BC-ST both follow the Elovich model. Adsorption isotherm analysis indicated that BC-PM and BC-ST both fit the Langmuir model well, although BC-ST possessed a lower adsorption capacity than BC-PM. The BET surface area and biochar pore structure had no direct correlation with ammonium adsorption capacities. However, the ash in the biochars played an important role in ammonium adsorption. The metal elements in the biochars ash decreased as a result of ion exchange with ammonium. SiO2 and carbonate mineral components in biochar ash also function as ammonium adsorption sites.Acknowledgements
This work was supported by the National Basic Research Program of China (2013CB733505), the National Natural Science Foundation of China (41276101), the Zhejiang Provincial Key Research Project (2014C03022) and the Science and Technology Program of Xiamen, China (3502Z20143008).References
- S. Chen, B. Chen and D. Song, Bioresour. Technol., 2012, 114, 357–364 CrossRef CAS PubMed.
- J. Moller, A. Boldrin and T. H. Christensen, Waste Manage. Res., 2009, 27, 813–824 CrossRef PubMed.
- J. Abubaker, K. Risberg and M. Pell, Appl. Energy, 2012, 99, 126–134 CrossRef CAS.
- V. Arthurson, Energies, 2009, 2, 226–242 CrossRef CAS.
- C. E. Marcato, E. Pinelli, P. Pouech, P. Winterton and M. Guiresse, Bioresour. Technol., 2008, 99, 2340–2348 CrossRef CAS PubMed.
- S. Zhang and Y. Xiong, RSC Adv., 2016, 6, 5270–5277 RSC.
- C. Gan, Y. Liu, X. Tan, S. Wang, G. Zeng, B. Zheng, T. Li, Z. Jiang and W. Liu, RSC Adv., 2015, 5, 35107–35115 RSC.
- T. Xie, K. R. Reddy, C. Wang, E. Yargicoglu and K. Spokas, Crit. Rev. Environ. Sci. Technol., 2015, 45, 939–969 CrossRef CAS.
- H. Lu, W. Zhang, Y. Yang, X. Huang, S. Wang and R. Qiu, Water Res., 2012, 46, 854–862 CrossRef CAS PubMed.
- B. Chen, D. Zhou and L. Zhu, Environ. Sci. Technol., 2008, 42, 5137–5143 CrossRef CAS PubMed.
- X. Xu, X. Cao, L. Zhao, H. Zhou and Q. Luo, RSC Adv., 2014, 4, 44930–44937 RSC.
- D. Angın, T. E. Köse and U. Selengil, Appl. Surf. Sci., 2013, 280, 705–710 CrossRef.
- Y. Zhang, Z. Li and I. B. Mahmood, Front. Environ. Sci. Eng., 2014, 8, 825–834 CrossRef CAS.
- S. H. Lin and C. L. Wu, Water Res., 1996, 30, 1851–1857 CrossRef CAS.
- M. A. Wahab, H. Boubakri, S. Jellali and N. Jedidi, J. Hazard. Mater., 2012, 241–242, 101–109 CrossRef CAS PubMed.
- A. Haralambous, E. Maliou and M. Malamis, Water Sci. Technol., 1992, 25, 139–145 CAS.
- M. Sarioglu, Sep. Purif. Technol., 2005, 41, 1–11 CrossRef CAS.
- A. Thornton, P. Pearce and S. A. Parsons, Water Res., 2007, 41, 433–439 CrossRef CAS PubMed.
- M. Uğurlu and M. H. Karaoğlu, Microporous Mesoporous Mater., 2011, 139, 173–178 CrossRef.
- S. Balci, Water Res., 2004, 38, 1129–1138 CrossRef CAS PubMed.
- Y. Yao, B. Gao, M. Inyang, A. R. Zimmerman, X. Cao, P. Pullammanappallil and L. Yang, J. Hazard. Mater., 2011, 190, 501–507 CrossRef CAS PubMed.
- E. R. Orskov, K. Yongabi Anchang, M. Subedi and J. Smith, Biomass Bioenergy, 2014, 70, 4–16 CrossRef.
- J. Maroušek, Clean Technol. Environ. Policy, 2014, 16, 1821–1825 CrossRef.
- Y. Yao, B. Gao, M. Inyang, A. R. Zimmerman, X. Cao, P. Pullammanappallil and L. Yang, Bioresour. Technol., 2011, 102, 6273–6278 CrossRef CAS PubMed.
- Z. Zeng, S. D. Zhang, T. Q. Li, F. L. Zhao, Z. L. He, H. P. Zhao, X. E. Yang, H. L. Wang, J. Zhao and M. T. Rafiq, J. Zhejiang Univ., Sci., B, 2013, 14, 1152–1161 CrossRef CAS PubMed.
- H. Zheng, Z. Wang, X. Deng, J. Zhao, Y. Luo, J. Novak, S. Herbert and B. Xing, Bioresour. Technol., 2013, 130, 463–471 CrossRef CAS PubMed.
- A. Zielińska and P. Oleszczuk, Bioresour. Technol., 2015, 192, 618–626 CrossRef PubMed.
- L. Xiao, E. Bi, B. Du, X. Zhao and C. Xing, Environ. Earth Sci., 2014, 71, 5195–5205 CrossRef CAS.
- C. Jung, J. Park, K. Lim, S. Park, J. Heo, N. Her, J. Oh, S. Yun and Y. Yoon, J. Hazard. Mater., 2013, 263, 702–710 CrossRef CAS PubMed.
- K. Zhu, H. Fu, J. Zhang, X. Lv, J. Tang and X. Xu, Biomass Bioenergy, 2012, 43, 18–25 CrossRef CAS.
- S. E. Hale, V. Alling, V. Martinsen, J. Mulder, G. D. Breedveld and G. Cornelissen, Chemosphere, 2013, 91, 1612–1619 CrossRef CAS PubMed.
- G. H. Oh and C. R. Park, Fuel, 2002, 81, 327–336 CrossRef CAS.
- C. Schollenberger and R. Simon, Soil Sci., 1945, 59, 13–24 CrossRef CAS.
- A. M. Yusof, L. K. Keat, Z. Ibrahim, Z. A. Majid and N. A. Nizam, J. Hazard. Mater., 2010, 174, 380–385 CrossRef CAS PubMed.
- K. Sing, D. Everett, R. Haul, L. Moscou, R. Pierotti, J. Rouquerol and T. Siemieniewska, Pure Appl. Chem., 1985, 57, 603–619 CrossRef CAS.
- C. Liao, C. Wu and Y. Yan, Fuel Process. Technol., 2007, 88, 149–156 CrossRef CAS.
- R. Azargohar, S. Nanda, J. A. Kozinski, A. K. Dalai and R. Sutarto, Fuel, 2014, 125, 90–100 CrossRef CAS.
- N. V. Farinella, G. D. Matos and M. A. Z. Arruda, Bioresour. Technol., 2007, 98, 1940–1946 CrossRef CAS PubMed.
- C. Chen, W. Zhou and D. Lin, Bioresour. Technol., 2014, 179, 359–366 CrossRef PubMed.
- X. Cao and W. Harris, Bioresour. Technol., 2010, 101, 5222–5228 CrossRef CAS PubMed.
- D. Herrera, W. Harris, V. Nair, M. Josan and C. Staples, J. Dairy Sci., 2010, 93, 2598–2611 CrossRef CAS PubMed.
- D. V. Sarkhot, T. A. Ghezzehei and A. A. Berhe, J. Environ. Qual., 2013, 42, 1545–1554 CrossRef CAS PubMed.
- P. Vassileva, P. Tzvetkova and R. Nickolov, Fuel, 2009, 88, 387–390 CrossRef CAS.
- H. Huang, X. Xiao, B. Yan and L. Yang, J. Hazard. Mater., 2010, 175, 247–252 CrossRef CAS PubMed.
- V. Sricharoenchaikul, C. Pechyen, D. Aht-ong and D. Atong, Energy Fuels, 2007, 22, 31–37 CrossRef.
- M. Wang, L. Liao, X. Zhang, Z. Li, Z. Xia and W. Cao, Clays Clay Miner., 2011, 59, 459–465 CrossRef CAS.
- A. M. Yusof, N. A. Nizam and N. A. A. Rashid, J. Porous Mater., 2009, 17, 39–47 CrossRef.
- X. Xu, X. Cao, L. Zhao, H. Wang, H. Yu and B. Gao, Environ. Sci. Pollut. Res., 2013, 20, 358–368 CrossRef CAS PubMed.
| This journal is © The Royal Society of Chemistry 2016 |

