Application of Hansen solubility approach for the subcritical and supercritical selective extraction of phlorotannins from Cystoseira abies-marina

A. P. Sánchez-Camargo, L. Montero, A. Cifuentes, M. Herrero and E. Ibáñez*
Laboratory of Foodomics, Bioactivity and Food Analysis Department, Institute of Food Science Research, CIAL (UAM-CSIC), C/Nicolás Cabrera 9, Campus UAM Cantoblanco, 28049 Madrid, Spain. E-mail: elena.ibanez@csic.es

Received 30th June 2016 , Accepted 26th September 2016

First published on 28th September 2016


Abstract

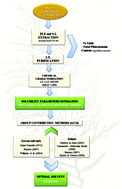
Cystoseira abies-marina is one of the most important brown algae species found in the Mediterranean Sea and Atlantic Ocean ecosystems and has been reported as a promising source of phenolic compounds, including phlorotannins, with important biological activities. In the present work, the possibility of developing new green processes to eliminate/replace the use of traditional polluting and often toxic solvents to obtain phlorotannin-enriched extracts is explored, looking for higher efficiency and compliance with the rules of green chemistry. The theoretical modelling of the Hansen solubility parameters could provide a useful and accurate estimation for the solvent selection and prediction of the solubility of these natural bioactive compounds. In order to drive the process towards the extraction of the target compounds, the chemical composition of phlorotannins from Cystoseira abies-marina was determined using a comprehensive two-dimensional liquid chromatography (LC × LC-MS/MS) method. Phlorethols, fucols or fucophlorethols containing from 3 to 14 phloroglucinol units (PGU) were tentatively identified. The estimation of Hansen solubility parameters of the most abundant phlorotannins (7 PGU) in some green solvents (ethanol, water, ethyl lactate and CO2 + ethanol) under sub- and supercritical conditions was carried out to improve their selective extraction and is presented for the first time. According to the theoretical approach, low temperatures of the extraction solvents provide the minimum Ra (difference in solubility parameter). However, this work experimentally demonstrates that pure ethanol at 100 °C showed the highest selectivity to extract phlorotannins. The Hansen approach proves to be a profitable tool to select a suitable solvent for extraction purposes.
1. Introduction

The interest in natural bioactive compounds from marine algae able to provide health benefits has intensified in the past few years in the area of functional foods/nutraceuticals.1–4 This increase is due to the fact that seaweeds are a good supply of key nutrients including carbohydrates and protein as well as soluble dietary fibers, peptides, polyphenols, carotenoids and minerals, which are amongst the most promising compounds found in macroalgae.5,6 Cystoseira is one of the most important species of brown algae found in the Atlantic Ocean and Mediterranean Sea ecosystems.7 It has been described to have pharmacological potential since its extracts exhibit high and selective antioxidant,8,9 anti-proliferative10–12 and anti-inflammatory activities.11,13 These interesting bioactive properties have mainly been related to the presence of phlorotannins, which are complex polymeric phenolic compounds based on phloroglucinol monomers, linked to each other by different bonds. Depending on the type of the bond present on their structure, phlorotannins can be classified in phlorethols and fuhalols (ether linkages), fucols (phenyl linkages), fucophlorethols (ether and phenyl linkages) and eckols (benzodioxin linkages).14 In a recent work carried out in our laboratory, we have identified more than 50 different phlorotannins in a C. abies-marina brown algae extract employing comprehensive two-dimensional liquid chromatography (HILIC × RP-DAD-MS/MS).15 Besides, employing this powerful analytical technique it was possible to identify fuhalols, hydroxyfuhalols and mainly phlorethols with different degree of polymerization from purified extracts of Sargassum muticum collected on the Norwegian coast. Furthermore, these extracts showed a prominent antiproliferative activity against HT-29 adenocarcinoma colon cancer cells (IC50 = 32.2 ± 1.7 μg mL−1).16

Considering the interest of bioactive compounds from microalgae and seaweeds from a bioeconomical perspective, our research has been focused on the development of green integrated processes (e.g. enzyme assisted extraction (EAE), pressurized liquid extraction (PLE), supercritical fluid extraction (SFE), microwave assisted extraction (MAE) and their combinations) to improve the efficiency of the extraction while replacing toxic organic solvents with environmental-friendly solvents such as water, ethanol and/or CO2.16–21 Even though some improvements have been achieved, usually it becomes necessary to carry out some purification procedures after extraction (L–L and S–L extractions) to remove lipids, carbohydrates and proteins fractions and to obtain phlorotannins-enriched extracts.11,15,16,22 In this sense, the complex interplay between thermodynamics (solubility) and kinetics (mass transfer) has to be understood to perform a selective extraction process.23 Although several models to predict the mass transfer rates for sub- and supercritical extraction from different natural matrices have been developed and discussed in detail in several recent publications,24–27 in the present work our approach was to use the solubility parameters as a design tool to select the most convenient solvents for extraction of bioactive ingredients, thus becoming an interesting alternative to achieve selective extractions.28–34 The Hildebrand solubility parameter (δ) provides a numerical estimate of the degree of interaction between materials, and as a consequence, materials with similar δ values are likely to be miscible.35 The division of the Hildebrand parameter into three components (dispersive, polar and hydrogen bonding forces) by Hansen in 1967, lastly named as Hansen solubility parameters (HSP), has been widely applied from academic labs to industrial applications to predict the solubility of polymers, bio-polymers, drugs, pigments, dyes, and some biological materials in different types of solvents.35 The estimation of the individual Hansen parameters depends greatly upon the availability of data. In cases where there is no possibility to experimentally obtain the solubility parameters by indirect measurements (i.e. solvency testing, osmotic pressure, turbidity, specific volume or intrinsic viscosity), the group contribution methods (GCM) is a good approximation to predict physicochemical properties and solubility parameters from molecular structures using additive rules. For the estimation of properties of pure compounds,36 GMC such as those given by Lydersen,37 Klincewicz and Reid38 and Joback and Reid,39 among others, have been widely used with limited applicability. However, some newer methods have introduced even second-order and third-order groups to improve the predictive capability for representing complex molecules.40,41 On the other hand, following the same Hansen approach, Hoftyzer and Van Krevelen, Small, Fedors and Hoy have developed some group contribution techniques to estimate the solubility parameters for a wide variety of compounds.35,42 Although some of these predictions are only valid at normal conditions, some methods have been developed to correct the pressure and temperature effect for supercritical and subcritical conditions.43,44 Several theoretical studies of the Hansen solubility parameters stated that under subcritical conditions, solubility parameters for water and ethanol were mainly dependent on the temperature since the pressure exerted only a minor influence on the total solubility parameter below its critical point.29,45 Nevertheless, at very high pressures under near-critical and supercritical conditions, the solubility parameter of water and other solvents, including CO2, showed a rise with increasing pressure and a drop with decreasing temperature.43,46 Some recent research works employing these solvent conditions for green processes have estimated the solubility parameter of some natural bioactive compounds. For instance, Srinivas et al.29 applied the Hansen solubility parameters approximation for the betulin–ethanol and betulin–water systems under subcritical conditions. In that work it could be verified that ethanol is a better solvent for betulin, being in agreement with the experimental data reported. A similar approach was used in predicting the extraction conditions of target solutes form natural matrices: silymarins from milk thistle, vitamins B from Brewer's yeast and anthocyanins from grape pomace.29 Also, the estimation of solubility parameters of some carotenoids (present in some selected spices) such as lutein, β-carotene, violaxanthin, zeaxanthin and curcumin in supercritical carbon dioxide (SC-CO2) at different pressure (10–100 MPa) and temperature (25–75 °C) were advantageous to optimize their extraction.47 Furthermore, the increment of the solvent power of SC-CO2 with an addition of co-solvents and the prediction of their solubility parameters have resulted in successful selective extractions of caffeine from green tea.31 Regarding the marine algal polyphenols, theoretical information about the solubility parameters in green solvents has not been described yet. Therefore, the objective of the present work was the estimation of Hansen solubility parameters of the most abundant phlorotannins found in the brown algae Cystoseira abies-marina in green subcritical and supercritical solvents in order to devise and optimize a new extraction and purification protocol for their selective isolation.

2. Materials and methods

2.1 Sample and chemicals

Thalli of Cystoseira abies-marina (S. Gmelin) C. Agardh were provided in April, 2012 by The Spanish Bank of Algae from Las Palmas, Gran Canarias. After collection, dry seaweeds were ground using a knife mill (Grindomix GM200, Retsch GmbH, Haan, Germany) at low temperature (10 °C) employing small rocks of dry ice for this purpose. The particle size was determined by sieving the ground material to appropriate size (between 999 and 500 μm). Then, the whole sample was vacuum-packed and stored at 4 °C until its use.

Phloroglucinol, acetic acid, formic acid, 2,4-dimethoxybenzaldehyde (DMBA) were purchased from Sigma-Aldrich (Madrid, Spain). Hydrochloric acid was obtained from Probus (Barcelona, Spain), whereas dichloromethane was acquired from Fluka AG (Buchs, Switzerland) and ethyl acetate from Scharlau (Barcelona, Spain). Ultrapure water was obtained from a Millipore system (Billerica, MA, USA). Acetonitrile, ethanol, methanol and acetone employed were HPLC-grade and were acquired from VWR Chemicals (Barcelona, Spain).

2.2 Extraction equipment and procedures

Initially, in order to obtain the maximum quantity of phlorotannins to be purified and subsequently characterized by comprehensive two-dimensional liquid chromatography (LC × LC-MS/MS), dry algae were submitted to pressurized liquid extraction (PLE). PLE conditions were selected according to previous research works developed in our laboratory for other brown algae species.15–17 A mixture of acetone/water (70[thin space (1/6-em)]:[thin space (1/6-em)]30, v/v) at 100 and 160 °C was tested at 10.3 MPa for 20 min. The extraction procedure was carried out employing an accelerated solvent extractor (ASE 200, Dionex, Sunnyvale, CA, USA), equipped with a solvent controller unit. For each extraction, an 11 mL stainless steel extraction cell was employed to load 1 g of sea sand, followed by 1 g of dried brown alga mixed with the same quantity of sea sand.

For comparison purposes, a conventional solid–liquid extraction was carried out using acetone/water (70[thin space (1/6-em)]:[thin space (1/6-em)]30, v/v) at 25 °C. Briefly, 3 g of dry algae were mixed with 30 mL of this solvent mixture employing a magnetic stirring during 45 min in the darkness. The supernatant was centrifuged, the remaining residue was extracted 3 more times with 10 mL of solvent mixture and finally after the extractions the supernatants were pooled. Acetone was removed using rotary evaporation and aqueous crude extracts were freeze-dried to determine the extraction yield (gravimetric method, defined as g extract per 100 g dry algae). All of the assays were carried out by triplicate.

2.3 Phlorotannins purification procedure

In order to obtain concentrated phlorotannin extracts, a liquid–liquid solvent purification protocol reported by Stiger-Pouvreau et al.22 was employed. The dry crude extract was re-diluted in a given volume of water and then, dichloromethane (1[thin space (1/6-em)]:[thin space (1/6-em)]1, v/v), acetone (3[thin space (1/6-em)]:[thin space (1/6-em)]1, v/v) and ethanol (3[thin space (1/6-em)]:[thin space (1/6-em)]1, v/v) were used to remove consecutively lipid, protein and carbohydrates fractions present in the crude extracts. Finally, phlorotannins were extracted from the water fraction with ethyl acetate (1[thin space (1/6-em)]:[thin space (1/6-em)]1, v/v). After, the extract was dried using N2.

2.4 Total phlorotannin content determination

The total phlorotannin content in the crude algae extracts and purified extracts (phlorotannins fraction) were quantified using the DMBA (dimethoxybenzaldehyde) colorimetric assay following the method described by Lopes et al.13 The working reagent was prepared mixing equal volumes of hydrochloric acid (6%, v/v) and DMBA (2%, m/v) dissolved in glacial acetic acid. Then, 50 μL of each extract (2.0–5.0 mg mL−1) or phloroglucinol standard (0.98–62.5 μg mL−1) were mixed with 250 μL of the working reagent in a 96-wells plate for 60 min, at room temperature in darkness. After the reaction time, the absorbance was measured at 515 nm in a microplate spectrophotometer reader Powerwave XS (Bio Tek Instruments, Winooski, VT). Water was used as blank and control samples without DMBA solution were also included. A calibration curve using phloroglucinol was employed to estimate of total phlorotannins content. Data were presented as the average of triplicate analyses expressed as milligram phloroglucinol equivalents (PGE) per gram of dry extract. All blanks, samples, and controls were prepared in triplicate.

2.5 Characterization of phlorotannins by comprehensive two-dimensional liquid chromatography (LC × LC-DAD-MS/MS)

In order to carry out the chemical characterization of the purified phlorotannin fraction, a comprehensive two-dimensional liquid chromatography method (LC × LC) previously developed in our laboratory15 (with some modifications) was employed. The sample was diluted at a concentration of 45 mg mL−1 in MeOH/ACN (3[thin space (1/6-em)]:[thin space (1/6-em)]7, v/v) and filtered through 0.45 μm nylon syringe filters (Análisis vínicos, Tomelloso, Spain) before injection. The separation was developed employing a HILIC column (Lichrospher diol-5 150 × 1.0 mm, 5 μm particle diameter, HiChrom, Reading, UK) with a precolumn with the same stationary phase, for the first dimension (1D). A short partially porous C18 reversed phase column (50 × 4.6 mm, 2.7 μm particle diameter, Supelco, Bellefonte, CA) with a C18 precolumn was used for the second dimension (2D). In the 1D, the flow rate and the injection volume employed were 15 μL min−1 and 20 μL, respectively. The mobile phases were (A) ACN/acetic acid (98[thin space (1/6-em)]:[thin space (1/6-em)]2, v/v) and (B) methanol/water/acetic acid (95[thin space (1/6-em)]:[thin space (1/6-em)]3[thin space (1/6-em)]:[thin space (1/6-em)]2, v/v/v) eluted according to the following gradient: 0 min, 3% B; 3 min, 10% B; 5 min, 15% B; 30 min, 35% B; 70 min, 35% B. A 2-position 10-port switching valve acted as modulator or interface between the two dimensions, with a modulation time of 1.3 min. The interface was equipped with two identical 30 μL injection loops. For the 2D, repetitive 1.3 min analysis were used, employing as mobile phases water (0.1% formic acid, (A) and ACN (B) eluted according to the following gradient: 0 min, 0% B; 0.1 min, 5% B; 0.3 min, 20% B; 0.8 min, 40% B; 0.9 min, 70% B; 1 min, 90%; 1.01 min, 0% B). The 2D flow rate employed during the whole LC × LC analysis was 3 mL min−1. The flow eluting from the 2D column was splitted before entering the MS instrument, so that the flow rate introduced in the MS detector was 600 μL min−1. The wavelength used to monitor the separations was 280 nm, although UV-Vis spectra were collected from 190 to 550 nm during the whole analysis using a sampling rate of 20 Hz in the DAD. The MS was operated under negative ESI mode and employing the following conditions: dry temperature, 350 °C; mass range, m/z 90–2200 Da; dry gas flow rate, 12 L min−1; nebulization pressure, 40 psi. LC data were elaborated and visualized in two and three dimensions using LC Image software (version 1.0, Zoex, Houston, TX, USA).

3. Solubility parameter estimation: modelling

Once the phlorotannins profile present in the purified extract was identified, the Hansen solubility parameters of the most abundant phlorotannins in different green solvents were estimated. The basic equation governing the assignment of Hansen parameters is the total cohesion energy, E, which is defined by the contribution of three energies: ED, dispersion energy (related to the van der Waals forces), EP, polarity energy (related to dipole moment), and EH, hydrogen bonding energy. Dividing this by the molar volume (V) gives the square of the total (δT2) solubility parameter as the sum of the squares of the Hansen (D, P, and H components) as defined by eqn (1) and (2):35
 
image file: c6ra16862k-t1.tif(1)
 
image file: c6ra16862k-t2.tif(2)

The Hansen three-dimensional solubility parameter model considers that the mutual solubility parameter between a solute i and a solvent j, called Ra “distance”, is based on their respective partial solubility parameter components, as follow:35

 
image file: c6ra16862k-t3.tif(3)

The particular region where solvent–solute combinations occur as a solution is named the “solubility sphere”. Through trial and error, solvents tested are plotted in Hansen space to create the solubility sphere with the radius of the sphere indicated, which is known as the “interaction radius” and denoted as R0. Thus, the ratio Ra/R0 has been called the Relative Energy Difference (RED): if RED = 0, no energy difference is found meaning a “perfect solvent”; if RED < 1.0 indicates high affinity, if RED = 1.0 indicates boundary condition; and if RED > 1.0 indicate low affinity. However, R0 is based only on experimental data of the observation of the interaction between studied solutes and well-known solvents and therefore it can only be used when solubility experiments can be carried out.35

On the other hand, in order to help visualizing the three parameters on a plane, Teas48 developed a triangular plotting technique in which the individual Hansen parameters were normalized by the sum of the three parameters, as defined by eqn (4) to (6). In each side of the triangle, the contribution of each parameter is located; the sum of these three fractional parameters should be 1.0. Teas plot can be a suitable tool to study the solubility behavior of a specific compound in untested solvents by determining the solvent's position with respect to the solute's position in Teas plot.

 
image file: c6ra16862k-t4.tif(4)
 
image file: c6ra16862k-t5.tif(5)
 
image file: c6ra16862k-t6.tif(6)

3.1 Solubility parameter of the solute

For the solutes studied in this work (phlorotannins), there are no previous theoretical or experimental data in the literature about their physical properties or solubility parameters. Moreover, standard compounds are not available. In this sense, Marrero & Gani41 group contribution method was used for the estimation of critical data (third-order group) and the Yamamoto-molecular break method using its Simplified Molecular Input Line Entry Syntax (SMILES) (HSPiP Version 5.0, Denmark) was employed for the evaluation of the molar volume. For the partial solubility parameters of the solutes (dispersion, polarity and hydrogen bonding), the Hansen35 approach was chosen to estimate them at room temperature. The total solubility parameters were calculated according to eqn (2). On the other hand, to evaluate the temperature dependence of the solute solubility parameter (since pressure does no exert a large influence on the properties of solid), the Jayasri and Yaseen44 method was employed (eqn (7)), where Tr means the reduced temperature at room temperature (1) at a given sub- or supercritical temperature (2).
 
image file: c6ra16862k-t7.tif(7)

3.2 Solubility parameter of the solvents

The green solvents selected to carry out the modelling and the solubility parameter estimation were: (a) ethanol, (b) water, (c) ethyl lactate, (d) CO2 + ethanol. Water, ethanol and ethyl lactate, were evaluated at subcritical conditions considering temperatures equal to 25, 100 and 150 °C and keeping the pressure constant at 1.0 MPa. For supercritical conditions, mixtures of CO2 + ethanol (70[thin space (1/6-em)]:[thin space (1/6-em)]30, 60[thin space (1/6-em)]:[thin space (1/6-em)]40, and 50[thin space (1/6-em)]:[thin space (1/6-em)]50%, w/w), at 10, 20, 30 MPa were studied, maintaining the temperature constant at 40 °C.

The physical properties of the subcritical solvents were taken and calculated following the Gunn–Yamada method as described by Pereira et al.45 Their three-dimensional solubility parameters at room temperature were obtained from Hansen.35 For supercritical conditions, the solvent densities at the specified pressure and temperature were obtained from NIST REFPROP database 2015.49 The effect of pressure and temperature of the sub- and supercritical solvents on their solubility parameters were estimated employing the approach provided by Williams et al.,43 as described in eqn (8)–(10):

 
image file: c6ra16862k-t8.tif(8)
 
image file: c6ra16862k-t9.tif(9)
 
image file: c6ra16862k-t10.tif(10)
where the subscript ref means the relative property at room temperature (25 °C), V is the molar volume and T the sub or supercritical temperature. For a mixture consisting of supercritical CO2 (SC-CO2) and ethanol (co-solvent), the solubility parameters for the mixed fluid, was determined as follow:
 
δMix-D,P,H = ΦSC-CO2 × δSC-CO2-D,P,H + ΦEthanol × δEthanol-D,P,H (11)
where Φ is the volume fraction of SC-CO2 and ethanol.

4. Results and discussion

4.1 Extraction of polyphenols from brown algae

As mentioned, marine algae have been considered as the “plant-based food of the future”5 because of their composition in nutrients and micronutrients.19,50 A typical class of polyphenols exclusive from brown seaweeds are phlorotannins. These compounds are derived from polymerized phloroglucinol units (1,3,5-trihydroxybenzene).51,52 Due to the relevant biological activities attributed to phlorotannins, in the last few years we have been developing different green extractions techniques for their extraction/isolation. For instance, PLE16,17,53,54 is among the most promising processes to carry out this purpose. Taking into account that the solvent most-commonly used to extract phlorotannins has been aqueous mixtures of acetone,55–57 in the present study, 3 different extraction conditions have been selected in order to obtain phlorotannins-enriched extracts to determine its chemical composition; the knowledge of their exact composition is the first step towards their selective isolation by using the Hansen solubility parameters approach.

Fig. 1 shows the results of the extraction yield (g extract per 100 g dry algae) and the total phlorotannin content (mg phloroglucinol equivalent (PGE) per g extract) (on the left and right axes, respectively) obtained under the different extraction conditions tested. Regarding solid–liquid extraction, the extraction yield, as well as the phlorotannin content, was similar to those obtained by PLE at 100 °C. A further increase of temperature up to 160 °C leads to an increase on the extraction yield from 27.0 to 41.9% (w/w); however, under those conditions the phlorotannins extraction decreases 48%, probably due to their degradation or to a change in their solubility. Taking into account these results, only PLE extract obtained at 100 °C was selected to carry out the purification procedure due to the reduced use of solvents and less time required for their extraction.


image file: c6ra16862k-f1.tif
Fig. 1 Extraction yield% and phlorotannin content of C. abies-marina extracts obtained by solid–liquid extraction and PLE before purification procedure.

4.2 Isolation of phlorotannins from algae crude extracts

As already commented, brown algae contain a wide variety of compounds including lipids, proteins and carbohydrates,6 which are present in significant amounts in the extracts. Therefore, after obtaining the extract, liquid/liquid purification is required to remove these fractions and to obtain phlorotannins-enriched extracts. These fractions were gravimetrically quantified and the results showed that dichloromethane, acetone, ethanolic and aqueous fractions represented 10.8 ± 0.5, 6.7 ± 0.3, 1.5 ± 0.1 and 74.6 ± 3.7% (w/w) of the crude extract, respectively. Regarding to the phlorotannin purified fraction (corresponding to the ethyl acetate (EA) fraction), a purification yield of 6.4 ± 0.3% was obtained. The phlorotannins content in this purified fraction was 20.5 ± 1.6 mg PGE per g, increasing the concentration of the phlorotannins 3-fold, related to the crude extract.

4.3 Chemical characterization of phlorotannins by LC × LC-ESI-MS/MS

Despite the DMBA colorimetric method is used to provide a general estimation of the phlorotannin content found in the extract, this assay is not able to provide any information about the chemical structure of these compounds. As already mentioned, from the chemical and structural point of view, phlorotannins are complex polymeric phenolic compounds of phloroglucinol units, linked to each other by different bonds. As the number of phloroglucinol units becomes bigger, the complexity of their structure and diversity greatly increases.58 This level of complexity makes the identification and chemical characterization of phlorotannins a difficult challenge. In this sense, different analytical techniques have been employed to separate and identify phlorotannins from different brown algae, such as HPLC-DAD-MS,55,57,59 UHPLC-DAD-MS,54,60 or even comprehensive two dimensional liquid chromatography coupled to MS (LC × LC-MS/MS). This technique has been successfully employed to separate phlorotannins with different chemical structure and degree of polymerization from Cystoseira abies-marina and Sargassum muticum brown algae.15,16 In this work, a HILIC separation in the first dimension (1D) was on-line coupled to a RP-based separation in the second dimension (2D). In HILIC mode, phlorotannins are eluted according to the increased degree of polymerization (DP); therefore, phlorotannins with lower DP elute at the beginning of the analysis, whereas phlorotannins with higher DP are more retained and are eluted progressively with the increase of the aqueous mobile phase in the gradient. On the other hand, the RP-based 2D allows the separation of different phlorotannins with the same DP in agreement to their relative hydrophobicity.

As it can be observed in Fig. 2, with the HILIC × RP-MS/MS method developed in this work, 35 compounds present in the purified extract of Cystoseira abies-marina were separated. Twenty-nine compounds were tentatively identified as phlorotannins with a DP from 3 to 14 phloroglucinol units (PGU). In Table SI-1(ESI), a list with the separated peaks including retention times, [M − H], main MS/MS fragments and their tentative identification is presented. Thereby, the smaller phlorotannins detected were trimers, detected at m/z 375.6 (peak 1) with typical fragments at m/z 247 (loss of 126 Da, corresponding to a phloroglucinol unit) and m/z 125 (loss of two phloroglucinol units). Then, phlorotannins with a growing DP were detected up to 14 DP (peak 35) which presented a double charged ion [M − 2H]2− at m/z 869.1.


image file: c6ra16862k-f2.tif
Fig. 2 2D plot (280 nm) of the C. abies-marina purified extracts using the HILIC × RP-MS/MS method. DP: degree of polymerization.

Besides, in Table SI-1, the relative peak area of each compound is shown. Clearly, the most abundant compounds in the Cystoseira extract are phlorotannins with 7 PGU presenting a relative area of 17.53 and 39.52% (peaks 15 and 16, respectively), followed by phlorotannins of 5 DP (peak 7 showing a relative peak area of 8.03%). These data can be also visualized in the 2D plot, where the most abundant compounds correspond with the most intense plots (peaks 7, 15 and 16).

As mentioned in the introduction, phlorotannins can be classified according to the link between the phloroglucinol units. In particular there are three phlorotannins types that are structurally very similar, namely phlorethols (phlorotannins with ether bound), fucols (phenyl linkages) or fucophlorethols (ether and phenyl linkages). Unfortunately, the differentiation between these three groups could not be established with the available analytical tools, mainly due to the fact that all of them have the same molecular weight and similar fragmentation pathway. For this reason we considered that phlorotannins detected in Cystoseira abies-marina could belong to the three groups, for instance the main compound present in this extract (phlorotannin with 7 PGU) could be heptaphlorethol, heptafucol or heptafucophlorethol. Due to the impossibility of knowing the exact molecular structure present in the purified extract, we selected heptaphlorethol and heptafucol as models for the estimation of Hansen solubility parameters because they include both type of bounds (ether and phenyl) that could be found in Cystoseira's phlorotannins.

4.4 Solubility parameters estimation

As mentioned, the Hansen solubility parameters provide a numerical estimate of the degree of interaction between materials, and can be a good indication of their solubility. The estimation of solubility should be taken into account for the selection of the critical solvent extraction since this theoretical approach is useful as a first approximation, avoiding time-consuming experimental procedures. Recent works have successfully used the solubility parameters approach for the estimation of biocompounds such as amino acids, acetamides, fatty acids, pigments, pesticides, polyphenols and volatile aroma compounds, among others, in alternative solvents like vegetable oils and CO2.28,29,61–63 In the present work, once identified the most abundant compound present in the enriched-phlorotannin extract, heptaphlorethol or heptafucol (shown in Fig. 3(a) and (b), respectively), these structures were selected as solute molecular models to estimate their solubility parameters in different green solvents. In this regard, SMILES notation is a very useful tool for entering and representing molecules and reactions, which allows representing a string from a 2D or 3D chemical drawing, precise enough to be a unique identifier. It is essentially a language which employs characters-encoding based on ASCII (American Standard Code for Information Interchange). By entering the SMILES values of the target molecular in HSPiP software, the Y-MB method provides a whole range of predicted values. Following this approach, selected phlorotannins chemical structures were transformed to their SMILE notation (heptaphlorethol, Oc\7c\c\(O)c\(Oc\6c\c\(O)c\c\(O)c\6(Oc\5c\c\(O)c\(Oc\4c\c\(O)c\c\(O)c\4(Oc\3c\c\(O)c\(Oc\2c\c\(O)c\c\(O)c\2(Oc\1c\c\(O)c\c\(O)c\1))c\(O)c\3))c\(O)c\5))c\(O)c\7 and heptafucol, Oc\1c\c\(O)c\(c\(O)c\1)c\2c\(O)c\c\(O)c\(c\2(O))c\3c\(O)c\c\(O)c\(c\3(O))c\4c\(O)c\c\(O)c\(c\4(O))c\5c\(O)c\c\(O)c\(c\5(O))c\6c\(O)c\c\(O)c\(c\6(O))c\7c\(O)c\c\(O)c\c\7(O)) in order to calculate their cohesion energy (E) using the group contribution method and their molar volume using Yamamoto-Molecular Break (Y-MB). Results on the calculation of E in terms of dispersion, polar and hydrogen bonding energies for both solutes are shown in Table 1. Furthermore, using the Hansen group contribution method, it was possible to calculate the solubility parameters of heptaphlorethol and heptafucol. Results of HSP for both solutes and the different green solvents tested are given in Table 2.
image file: c6ra16862k-f3.tif
Fig. 3 The structures of phlorotannins, (a) heptaphlorethol and (b) heptafucol.
Table 1 Calculation of the cohesion energy (E) of heptaphlorethol and heptafucol using the group contribution method
Phlorotannin Functional groups Number of functional groups Dispersion energy ED (cal mol−1) Polar energy EP (cal mol−1) Hydrogen bonding energy EH (cal mol−1)
Heptaphlorethol Phenyl (trisubstituted) 1 7530 50 50
Phenyl (tetrasubstituted) 6 7530 50 50
–O– ether 6 0 500 450
OH– (aromatic) 15 1870 800 4650
Heptafucol Phenyl (tetrasubstituted) 2 7530 50 50
Phenyl (pentasubstituted) 5 7530 50 50
OH– (aromatic) 21 1870 800 4650


Table 2 Hansen solubility parameters consisting of dispersive interactions (δD), polar interactions (δP), and hydrogen bonds (δT) for solutes and green solvents selected
Compound/solvent Molar volume (cm3 mol−1) Temperature (°C) Pressure (MPa) δD (MPa1/2) δP (MPa1/2) δH (MPa1/2) δT (MPa1/2)
a Data taken using ethanol under subcritical conditions. NC: not calculated.
Solutes selected
Heptaphlorethol 521.6 25 1.0 25.45 11.10 24.17 36.81
40 1.0 25.32 11.04 24.04 36.61
100 1.0 24.77 10.80 23.51 35.82
150 1.0 24.29 10.59 23.06 35.12
Heptafucol 488.2 25 1.0 28.08 12.12 28.98 42.13
40 1.0 27.94 12.06 28.84 41.92
100 1.0 27.36 11.81 28.24 41.06
150 1.0 26.86 11.60 27.73 40.31
[thin space (1/6-em)]
Subcritical solvents
Water 18.05 25 1.0 15.50 16.00 42.30 47.81
20.08 100 1.0 13.56 15.17 36.32 41.63
21.68 150 1.0 12.32 14.60 32.72 37.89
Ethanol 58.17 25 1.0 15.50 8.80 19.40 26.52
69.81 100 1.0 12.34 8.03 16.04 21.91
80.53 150 1.0 10.32 7.48 13.98 19.03
Ethyl lactate 113.99 25 1.0 16.00 7.60 12.50 21.68
134.39 100 1.0 13.02 7.00 10.43 18.09
151.18 150 1.0 11.24 6.60 9.20 15.96
[thin space (1/6-em)]
Supercritical conditions
SC-CO2 70.00 40 10.0 7.50 3.89 4.34 9.50
52.39 40 20.0 10.77 4.50 4.92 12.67
50.55 40 30.0 11.27 4.58 4.14 12.85
Ethanola 60.22 40 1.0 14.84 8.65 18.69 25.56
SC-CO2 + ethanola (70[thin space (1/6-em)]:[thin space (1/6-em)]30 v/v) NC 40 10.0 9.70 5.32 8.65 14.04
NC 40 20.0 11.99 5.75 9.05 16.08
NC 40 30.0 12.34 5.80 8.51 16.07
SC-CO2 + ethanola (60[thin space (1/6-em)]:[thin space (1/6-em)]40 v/v) NC 40 10 10.55 5.79 10.08 15.62
NC 40 20 12.51 6.16 10.43 17.33
NC 40 30 12.81 6.21 9.96 17.29
SC-CO2 + ethanola (50[thin space (1/6-em)]:[thin space (1/6-em)]50 v/v) NC 40 10.0 11.17 6.27 11.52 17.22
NC 40 20.0 12.81 6.58 11.81 18.62
NC 40 30.0 13.06 6.62 11.42 18.56


As can be seen, similar results for the estimation of the solubility parameters for heptaphlorethol and heptafucol structures were obtained. In addition, it is important to remark that their HSP values varied only marginally with the temperature. The total solubility parameter is highly influenced by dispersion (δD) and hydrogen-bonding forces (δH), as was expected due to presence mainly of benzene ring and, at least, two or three hydroxyl group in each one. In the estimation of solubility parameters of solvents, considering that pressure exerts only a minor influence on the total solubility parameter below its critical point; only values at 1.0 MPa are given. On the other hand, under subcritical conditions, an increase in the temperature leads to a decrease in the partial solubility parameters and therefore, in the total solubility parameter. For ethanol and ethyl lactate, the polar interaction (δP) remains almost constant with the increase in temperature, whilst the hydrogen-bonding and dispersive interaction showed more influence. On the other hand, the decrease in the solubility parameter components of water with increasing temperature is mainly due to a reduction in hydrogen-bonding parameter. Under supercritical conditions, the solubility parameter of CO2 raised with increasing of pressure at constant temperature, due to a density effect.

One interesting and clearer way to get a better idea about the optimal solvents to be selected for the selective extraction is by calculating the difference in the solubility between the subcritical and supercritical solvent and the solutes, as defined by the eqn (3) (Ra distance). Fig. 4(a) and (b) shows the plotted Ra values for the conditions described in Table 2. The smaller the Ra, the better is the solvent for the solute. For ethyl lactate and ethanol, an increase in the extraction temperature will induce drastically a decrease in the solubility of heptaphlorethol and heptafucol. Interestingly, low temperatures improve their solubility in these solvents, implying that are “good solvents”. An opposing behavior is shown by water, where an increase in the temperature slightly decreases the Ra value, for both solutes. Water at 150 °C seems to be more efficient for extracting such polar compounds from natural matrices when compared to ethanol and ethyl lactate at the same temperature. However, when ethanol, water and ethyl lactate are used at 100 °C to extract heptaphlorethol very close values were found. A fact which is often noted in practice is that usually higher temperatures increase the rate of solubility/diffusion/permeation. However, in terms of solubility parameters, δD, δP, and δH decrease with an increase in temperature, meaning that solvents such as alcohols, phenols, glycols, and glycol ethers become better solvents for compounds of lower solubility parameters (contrary to what is observed for phlorotannins). Thus, increasing the temperature can cause a non-solvent to become a “good solvent”. Also, it is possible that a boundary solvent can be a good solvent at a given temperature, but become bad solvent with either an increase or a decrease in temperature.35 In any case, pure ethanol at low temperature (25 °C) is the most suitable solvent for the model solutes because it provides the smallest difference between the solubility parameters of both solutes and the solvent, compared to the other green solvents. These results are in accordance to the experimental results described in a previous work with the brown algae Sargassum muticum, where the highest phlorotannin extraction selectivity was observed by employing subcritical pure ethanol (50 °C, 10.3 MPa).17


image file: c6ra16862k-f4.tif
Fig. 4 Influence of the temperature and pressure in Ra value for heptaphlorethol and heptafucol and different (a) subcritical solvents at 1.0 MPa and (b) supercritical solvents at 40 °C. (●) Ethyl lactate, (▲) ethanol, (■) water, (○) CO2 + EtOH (70[thin space (1/6-em)]:[thin space (1/6-em)]30 v/v), (△) CO2 + EtOH (60[thin space (1/6-em)]:[thin space (1/6-em)]40 v/v), (□) CO2 + EtOH (50[thin space (1/6-em)]:[thin space (1/6-em)]50 v/v). Dashed line ([dash dot, graph caption]), heptaphlorethol; continuous line ([dash dash, graph caption]), heptafucol.

On the other hand, Fig. 4(b) shows the Ra values for the mixture CO2 + ethanol under supercritical conditions; as can be seen, increasing the percentage of co-solvent and pressure until 20 MPa provides smaller Ra, that is, better solubility. This increase in the solubility parameter is due to a raise in the hydrogen-bonding solubility parameter with an increasing concentration of ethanol in SC-CO2. Besides, increasing the pressure above 20 MPa do not significantly decreases the value of Ra. On the other hand, similar results using pure ethanol at 150 °C or CO2 + ethanol (50[thin space (1/6-em)]:[thin space (1/6-em)]50 v/v, 40 °C) at 20 MPa and ethyl lactate at 150 °C or CO2 + ethanol (50[thin space (1/6-em)]:[thin space (1/6-em)]50 v/v, 40 °C) at 20 MPa were obtained. In this sense, by tuning the temperature and pressure of subcritical and supercritical fluids and the percentage of co-solvent it is possible to have a change in the contribution of the various intermolecular forces which govern solute solubility.

Another approach tested to improve the solubility of phlorotannins was assessing mixtures of the selected solvents. Table SI-2 shows the theoretical optimal volume fractions Φ for the mixture of ethanol, water and ethyl lactate and the Ra value for heptaphlorethol and heptafucol. As can be seen, low temperatures induce a decrease in the Ra value, condition in which their solubility improves. Mixtures of ethanol/water (80[thin space (1/6-em)]:[thin space (1/6-em)]20 v/v) and ethyl lactate/water (63[thin space (1/6-em)]:[thin space (1/6-em)]37 v/v) present a similar value than the one obtained with pure ethanol at 25 °C. As temperature increases, the volume fraction of water also increases considerably in the solvent mixtures, due to the decrease of their partial and total solubility parameters under these conditions, thus approaching the solute solubility parameter at the respective temperature. Also, it is worth noting that the use of these mixtures can modify the extraction yield and affect the selectivity of the process.

On the other hand, by using the tool Solvent Optimizer from HSPiP (Version 5.0, Denmark) it was possible to test up to 101 organic solvents (alcohols, esters, ketones, aromatic hydrocarbons, among others) to estimate the solubility of the model phlorotannins considered in the study; results showed that other organic solvents can dissolve heptaphlorethol and heptafucol more effectively than ethanol, such as ethylene glycol (Ra = 15.01; Ra = 22.39, respectively for heptaphlorethol and heptafucol), benzyl alcohol (Ra = 18.21, Ra = 25.34) and tetrahydrofurfuryl alcohol (Ra = 19.22, Ra = 26.39). However, due their toxicity and hazardous solvent conditions, they have not been considered suitable for employing in our green processes. Also, it is worth mentioning that these values are very close to the optimal solvent (ethanol, Ra = 20.01, Ra = 26.57) found to extract those compounds.

4.4.1 Teas ternary plot. Teas ternary plot has been used in the present work to help visualizing the most-suitable solvents to extract heptaphlorethol and heptafucol; as mentioned in the introduction, the method is based on the use of the Teas fractional solubility parameters. Although this is a neat way to condense 3D data into 2D, the significance of the plotted values just provide an idea about the influence of the solvent for each individual structure.35 Fig. SI-1 shows the Teas ternary plot together with a table (at the top right) with the corresponding number of the target compounds and solvents. The analysis of the graph is based on the fact that the higher solubility of the solute in the solvent should occur when the solubility of the solute and solvent is closer to each other. Numbers 1 and 2 (red star icons) correspond to heptaphlorethol and heptafucol, respectively. The graph shows that the nearest pure solvent for the structures proposed is ethanol (at 25 °C) confirming the results obtained in the estimation of the HSP approach. Due to the high value of the hydrogen-bonding fractional parameter (Fh) for pure water (points 3, 4, 5 in the plot), this solvent seems to be the less appropriate (the farthest) to extract phlorotannins. In any case, from the theoretical approach, it can be inferred that low temperatures are necessary to get a better solubility of phlorotannins. Other solvents like CO2 + ethanol (50% v/v) (points 18, 19 and 20) seems to be also useful to extract the phlorotannins in one step.
4.4.2 Experimental assay of theoretical optimized conditions. By using the information provided by the theoretical approach the optimum solvent was selected and extractions were carried out under PLE conditions using pure ethanol at 25 °C (10.3 MPa, 20 min). Ethanol was also tested under subcritical conditions considering 100 °C and 150 °C in order to study the global effect of the increase in the temperature on the final solubility of the phlorotannins. As it was expected, the extraction yield was positively affected by an increase of temperature, obtaining values of 1.00 ± 0.02, 9.4 ± 0.1 and 14.1 ± 1.4% (w/w), respectively. As for total phlorotannins content (measured using the DMBA colorimetric assay) it was interesting to observe that the experimental behavior at high temperatures was the opposite to the theoretically expected; that is, in terms of Ra distance, an increase in temperature should increase the Ra, thus meaning a decrease in solubility of the phlorotannins. Nevertheless, as shown in Fig. 5, the increment of the temperature from 25 to 100 °C provokes an increment of 25.4% in the phlorotannins extraction (from 4.8 to 6.7 mg PGE per g extract). This increment could be due to the described effect of the temperature stimulates on the mass transfer rate that affects different parameters of the solvent such as density, viscosity or diffusivity. The differences observed between experimental and theoretical approach can be explained since the HSP are based on thermodynamic data and kinetics phenomena, which are highly influenced by temperature, are not taken into account. This can be considered as the biggest limitation of the HSP approach to study the extraction processes. On the other hand, the increment in the temperature up to 150 °C, showed a decrease in the phlorotannin extraction (4.0 mg PGE per g crude extract) following the prediction of Hansen solubility parameters. This effect can be attributed either to a drop of the solubility of the phlorotannins and/or to a degradation of these compounds with the temperature. Despite of above discussed, Hansen solubility parameters can be used a priori to evaluate the possibility to dissolve a solute in the most suitable solvent for a given application.
image file: c6ra16862k-f5.tif
Fig. 5 Ra value and phlorotannin content (mg PGE per g extract) for experimental assays using ethanol pure as solvent at different temperatures. Dashed line ([dash dot, graph caption]), phlorotannin content of crude extract (right axis); continuous line (—), theoretical Ra values for (●) heptaphlorethol, (■) heptafucol (left axis).

5. Conclusions

The chemical characterization of the purified extracts from Cystoseira abies-marina showed that the main types of phlorotannins found were phloroethols, fucols or fucophlorethols with a degree of polymerization from 3 to 14 PGU, being the 7 PGU the most abundant biopolymer. Once the profile of compounds in the extract is known, the group contribution methods and Hansen solubility parameters were interesting predicting approaches to estimate the solubility of structurally complex and biological solutes in sub- and/or supercritical fluid, optimizing theoretically the conditions for their extraction from natural matrices. By estimating the Ra distances or by calculating and constructing the Teas ternary plot, the best existing solvent (or mixture of solvents) can be found. According to this theoretical approach, temperature does not have a strong effect on the solubility parameters of the phlorotannins studied. Besides, by adjusting the subcritical fluids' temperature and supercritical fluids' pressure and percentage of co-solvent, it is possible to have a change in the contribution of various intermolecular forces which govern solute solubility. Theoretically, pure ethanol at low temperature (25 °C) was shown to be the most suitable solvent because it provided the smallest Ra, compared to the other green solvents. However, this work experimentally demonstrates that pure ethanol at 100 °C in sub-critical state (10.3 MPa) showed the highest selectivity to extract phlorotannins among different solvents studied. This difference between theoretical and experimental results could be due to the transport phenomena that take place during the extraction process and that are not considered into the HSP approach. Theoretically, green solvents such as ethyl lactate and CO2 + ethanol (50[thin space (1/6-em)]:[thin space (1/6-em)]50 v/v) could also be suitable to design a new green purification method for phlorotannins extraction.

Acknowledgements

A. P. S. C. thanks to the Administrative Department of Science, Technology and Innovation COLCIENCIAS (568-2012) (Colombia) for her PhD Scholarship. The authors want to thank Project AGL2014-53609-P (MINECO, Spain) for the financial support.

References

  1. M. L. Cornish and D. J. Garbary, Algae, 2010, 25, 155–171 CrossRef CAS.
  2. S. Gupta and N. Abu-Ghannam, Innovative Food Sci. Emerging Technol., 2011, 12, 600–609 CrossRef CAS.
  3. D. H. Ngo, I. Wijesekara, T. S. Vo, Q. Van Ta and S. K. Kim, Food Res. Int., 2011, 44, 523–529 CrossRef CAS.
  4. N. V. Thomas and S. K. Kim, Environ. Toxicol. Pharmacol., 2011, 32, 325–335 CrossRef CAS PubMed.
  5. S. M. Cardoso, O. R. Pereira, A. M. L. Seca, D. C. G. A. Pinto and A. M. S. Silva, Mar. Drugs, 2015, 13, 6838–6865 CrossRef CAS PubMed.
  6. R. F. Patarra, L. Paiva, A. I. Neto, E. Lima and J. Baptista, J. Appl. Phycol., 2011, 23, 205–208 CrossRef CAS.
  7. M. D. Guiry and G. M. Guiry, AlgaeBase., World-wide electronic publication, National University of Ireland, Galway, 2016, http://www.algaebase.org Search PubMed.
  8. L. Mhadhebi, A. Mhadhebi, J. Robert and A. Bouraoui, Iran. J. Pharm. Res., 2014, 13, 207–220 Search PubMed.
  9. E. M. Balboa, E. Conde, A. Moure, E. Falqué and H. Domínguez, Food Chem., 2013, 138, 1764–1785 CrossRef CAS PubMed.
  10. M. Zubia, M. S. Fabre, V. Kerjean and E. Deslandes, Bot. Mar., 2009, 52, 268–277 CAS.
  11. L. Mhadhebi, A. L. Clary, J. Robert, A. Bouraoui, L. De Pharmacologie, U. Victor, S. Bordeaux, I. Bergonié, C. De Argonne and B. Cedex, Afr. J. Biotechnol., 2011, 10, 16682–16690 Search PubMed.
  12. M. C. Barreto, E. Mendonça, V. Gouveia, C. Anjos, J. S. Medeiros and a M. L. Seca, Arquipelago: Life and Marine Sciences, 2012, 29, 53–58 Search PubMed.
  13. G. Lopes, C. Sousa, L. R. Silva, E. Pinto, P. B. Andrade, J. Bernardo, T. Mouga and P. Valentão, PLoS One, 2012, 7, e31145 CAS.
  14. J. H. Isaza Martínez and H. G. Torres Castañeda, J. Chromatogr. Sci., 2013, 51, 825–838 Search PubMed.
  15. L. Montero, M. Herrero, E. Ibañez and A. Cifuentes, Electrophoresis, 2014, 35, 1644–1651 CrossRef CAS PubMed.
  16. L. Montero, A. P. Sánchez-Camargo, V. García-Cañas, A. Tanniou, V. Stiger-Pouvreau, M. Russo, L. Rastrelli, A. Cifuentes, M. Herrero and E. Ibáñez, J. Chromatogr. A, 2015, 1428, 115–125 CrossRef PubMed.
  17. A. D. P. Sánchez-Camargo, L. Montero, V. Stiger-Pouvreau, A. Tanniou, A. Cifuentes, M. Herrero and E. Ibáñez, Food Chem., 2016, 192, 67–74 CrossRef PubMed.
  18. M. Plaza, M. Amigo-Benavent, M. D. del Castillo, E. Ibañez and M. Herrero, Food Res. Int., 2010, 43, 2341–2348 CrossRef CAS.
  19. M. Herrero, A. d. P. Sánchez-Camargo, A. Cifuentes and E. Ibáñez, TrAC, Trends Anal. Chem., 2015, 71, 26–38 CrossRef CAS.
  20. M. Plaza and I. Rodríguez-Meizoso, in Bioactive Compounds from Marine Foods, 2013, pp. 343–371 Search PubMed.
  21. B. Gilbert-López, J. A. Mendiola, J. Fontecha, L. A. M. van den Broek, L. Sijtsma, A. Cifuentes, M. Herrero and E. Ibáñez, Green Chem., 2015, 17, 4599–4609 RSC.
  22. V. Stiger-Pouvreau, C. Jégou, S. Cerantola, F. Guérard and K. Le Lann, Adv. Bot. Res., 2014, 71, 379–411 Search PubMed.
  23. E. Reverchon and I. De Marco, J. Supercrit. Fluids, 2006, 38, 146–166 CrossRef CAS.
  24. M. Khajenoori, A. Haghighi Asl and F. Hormozi, Chin. J. Chem. Eng., 2009, 17, 359–365 CrossRef CAS.
  25. J. Puiggené, M. A. Larrayoz and F. Recasens, Chem. Eng. Sci., 1997, 52, 195–212 CrossRef.
  26. H. Sovová, J. Supercrit. Fluids, 2012, 66, 73–79 CrossRef.
  27. H. Sovova, J. Supercrit. Fluids, 2005, 33, 35–52 CrossRef CAS.
  28. W. C. Scott and J. R. Dean, J. Environ. Monit., 2003, 5, 724–731 RSC.
  29. K. Srinivas, J. W. King, J. K. Monrad, L. R. Howard and C. M. Hansen, J. Food Sci., 2009, 74, E342–E354 CrossRef CAS PubMed.
  30. M. Savova and T. Kolusheva, J. Univ. Chem. Technol. Metall., 2007, 42, 295–300 CAS.
  31. W. Kim, J. Kim, S. Oh and Y. Lee, J. Food Eng., 2008, 89, 303–309 CrossRef CAS.
  32. M. Co, P. Koskela, P. Eklund-Akergren, K. Srinivas, J. W. King, P. J. R. Sjoberg and C. Turner, Green Chem., 2009, 11, 668–674 RSC.
  33. L. D. Kagliwal, S. C. Patil, A. S. Pol, R. S. Singhal and V. B. Patravale, Sep. Purif. Technol., 2011, 80, 533–540 CrossRef CAS.
  34. M. Khayet and V. Fernández, Theor. Biol. Med. Modell., 2012, 9, 45 CrossRef CAS PubMed.
  35. C. M. Hansen, in Hansen Solubility Parameters: A User's Handbook, 2000, pp. 1–24 Search PubMed.
  36. Z. Kolská, M. Zábranský and A. Randová, Group Contribution Methods for Estimation of Selected Physico-Chemical Properties of Organic Compounds, Thermodynamics – Fundamentals and Its Application in Science, ed. R. Morales-Rodriguez, InTech, 2012 Search PubMed.
  37. A. L. Lydersen, Estimation of Critical Properties of Organic Compounds, University of Wisconsin College of Engineering, Madison, WI, 1955 Search PubMed.
  38. K. M. Klincewicz and R. C. Reid, AIChE J., 1984, 30, 137–142 CrossRef CAS.
  39. K. G. K. G. Joback and R. C. R. C. Reid, Chem. Eng. Commun., 1987, 57, 233–243 CrossRef CAS.
  40. R. Gani and L. Constantinou, Fluid Phase Equilib., 1996, 116, 75–86 CrossRef CAS.
  41. J. Marrero and R. Gani, Fluid Phase Equilib., 2001, 183–184, 183–208 CrossRef CAS.
  42. E. A. Grulke, in Polymer Handbook, ed. J. Brandrup, E. H. Immergut and E. A. Grulke, Wiley-Interscience, 4th edn, 1999 Search PubMed.
  43. L. L. Williams, J. B. Rubin and H. W. Edwards, Ind. Eng. Chem. Res., 2004, 43, 4967–4972 CrossRef CAS.
  44. M. Jayasri and A. Yaseen, J. Coat. Technol. Res., 1980, 52, 41–45 Search PubMed.
  45. C. S. M. Pereira, V. M. T. M. Silva and A. E. Rodrigues, Green Chem., 2011, 13, 2658 RSC.
  46. Y. Marcus, J. Supercrit. Fluids, 2012, 62, 60–64 CrossRef CAS.
  47. K. Srinivas and J. W. King, in Functional Food Product Development, 2010, pp. 39–78 Search PubMed.
  48. J. P. Teas, J. Paint Technol., 1968, 40, 19–25 CAS.
  49. E. W. Lemmon, M. L. Huber and M. O. McLinden, Ref. Fluid Thermodyn. Transp. Prop. (REFPROP), Version 9.0, 2010 Search PubMed.
  50. D. B. Stengel, S. Connan and Z. A. Popper, Biotechnol. Adv., 2011, 29, 483–501 CrossRef CAS PubMed.
  51. I. Wijesekara, S. K. Kim, Y. Li and Y. X. Li, Process Biochem., 2011, 46, 2219–2224 CrossRef.
  52. S. L. Holdt and S. Kraan, J. Appl. Phycol., 2011, 23, 543–597 CrossRef CAS.
  53. L. Onofrejová, J. Vašíčková, B. Klejdus, P. Stratil, L. Mišurcová, S. Kráčmar, J. Kopecký and J. Vacek, J. Pharm. Biomed. Anal., 2010, 51, 464–470 CrossRef PubMed.
  54. M. S. Tierney, T. J. Smyth, M. Hayes, A. Soler-Vila, A. K. Croft and N. Brunton, Int. J. Food Sci. Technol., 2013, 48, 860–869 CrossRef CAS.
  55. F. Ferreres, G. Lopes, A. Gil-Izquierdo, P. B. Andrade, C. Sousa, T. Mouga and P. Valentão, Mar. Drugs, 2012, 10, 2766–2781 CrossRef PubMed.
  56. R. Koivikko, J. Loponen, T. Honkanen and V. Jormalainen, J. Chem. Ecol., 2005, 31, 195–212 CrossRef CAS PubMed.
  57. T. Wang, R. Jónsdóttir, H. Liu, L. Gu, H. G. Kristinsson, S. Raghavan and Ó. Gudrún, J. Agric. Food Chem., 2012, 60, 5874–5883 CrossRef CAS PubMed.
  58. S. M. Kim, S. W. Kang, J. S. Jeon, Y. J. Jung, W. R. Kim, C. Y. Kim and B. H. Um, Food Chem., 2013, 138, 2399–2406 CrossRef CAS PubMed.
  59. A. J. Steevensz, S. L. MacKinnon, R. Hankinson, C. Craft, S. Connan, D. B. Stengel and J. E. Melanson, Phytochem. Anal., 2012, 23, 547–553 CrossRef CAS PubMed.
  60. N. Heffernan, N. P. Brunton, R. J. FitzGerald and T. J. Smyth, Mar. Drugs, 2015, 13, 509–528 CrossRef PubMed.
  61. Y. Li, A. S. Fabiano-Tixier, C. Ginies and F. Chemat, LWT--Food Sci. Technol., 2014, 59, 724–731 CrossRef CAS.
  62. T. Fardi, E. Stefanis, C. Panayiotou, S. Abbott and S. van Loon, J. Cult. Herit., 2014, 15, 583–594 CrossRef.
  63. S. Al-Hamimi, A. Abellan Mayoral, L. P. Cunico and C. Turner, Anal. Chem., 2016, 88, 4336–4345 CrossRef CAS PubMed.

Footnote

Electronic supplementary information (ESI) available. See DOI: 10.1039/c6ra16862k

This journal is © The Royal Society of Chemistry 2016
Click here to see how this site uses Cookies. View our privacy policy here.