DOI:
10.1039/C6RA16737C
(Paper)
RSC Adv., 2016,
6, 95656-95662
Sustainable production of activated carbon spheres from ethyl cellulose†
Received
29th June 2016
, Accepted 2nd October 2016
First published on 3rd October 2016
Abstract
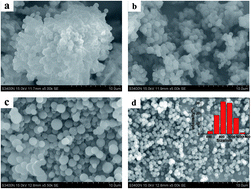
Hydrothermal carbonization (HTC) is an effective and sustainable way to covert biomass into functional carbonaceous materials. Effects of condition parameters on the morphology and particle size distributions were evaluated. However, the absence of porosity of HTC materials limits their wide applications. Activation of HTC materials could solve this problem. Traditional activation methods, which use strong base or acid as activating agent, could lead to pollutions. Here, we prepared microporous activated carbon spheres from ethyl cellulose under static air atmosphere. The resultant activated carbon spheres were characterized by scanning electron microscopy (SEM), high resolution transmission electron microscopy (HRTEM), FT-IR spectrometer, X-ray diffraction (XRD), X-ray photoelectron spectroscopy (XPS) and nitrogen adsorption. Results reveal that the obtained carbon spheres show smooth surface, good dispersion and abundant surface functional groups. In addition, the spherical carbon exhibits high adsorption abilities for different kinds of dyes, which is important for environment protection.
1 Introduction
Carbon materials have become a focus of researchers. Among all carbonaceous materials, carbon spheres (CSs), especially those with abundant porosity, are well-known. Recent reviews have summarized primary techniques of preparing porous CSs and key applications of these spheres.1,2 The attractive properties of CSs such as easy availability, good conductivity, heat resistance and abundant surface chemical functional groups make them fascinating in the fields of lithium ion batteries,3–5 catalysis,6,7 adsorbents,8,9 sensing10 and drug delivery.11 Various methods have been explored for the preparation of CSs, including high-temperature pyrolysis,12 arc-discharge13 and chemical vapor deposition.14 However, there are problems in these methods, such as easy pollution, high cost and then, restrict their applications greatly. The search for more renewable and sustainable synthetic methods with high carbon yield and low experiment cost for the production of such CSs becomes the research hotspot.
In recent years, hydrothermal carbonization (HTC) has been developed to produce CSs, which is a simple but green method. Hydrothermal carbonization (HTC) refers to heating biomass materials in an airtight system, using water as reaction medium. The HTC materials could be prepared by regulating the hydrothermal carbonization temperature (usually, in the range of 150 to 350 °C), the proportion of water and carbon source, and the carbonization time. HTC is an efficient method to produce CSs, which has been considered as a promising technology.15,16
There are a lot of materials that could be hydrothermal treated to HTC materials, such as biomass feedstock, municipal solid waste, sawdust, etc.17–19 Uniformed and monodispersed colloidal CSs were prepared by hydrothermal heating glucose with the help of a small dosage of sodium polyacrylate by Gong et al.20 and the process was facile. But such HTC materials are lack of porosity. Therefore, the solubilising technology of micelles was introduced to HTC by Wang et al.21 to prepare hierarchical porous CSs with tunable properties. In addition, in the past decades, various chemical and physical activation methods have been explored for activating carbonaceous materials, which could be used to produce porous materials. Wang et al.22 activated CSs with H3PO4, and the maximum surface area is up to 2700 m2 g−1; Zhang et al.23 activated CSs using KOH and obtained a kind of material with high surface area and porous structure; however, using chemical reagent under high temperature is dangerous. Zhao et al.24 prepared activated CSs by CO2 activation, and the maximum surface area was 2596 m2 g−1, but the yield was only 17% which was lower. There are many activating reagents could be used to activate HTC materials, such as base,25–27 acid,28 CO2 (ref. 29) and steam.30 It is unfortunately that these activating agents may create severe pollution and security risks. Therefore, the development of safe and efficient activating regents arouses much attention. Gong et al.31,32 produced CSs with hierarchically porous structure from glucose and fructose by a combination of HTC with activation under static air, supplying a sustainable, simple and efficient method to prepare CSs with high BET surface area and pore volumes.
Compared with traditional industrial chemicals, biomass-base materials have attracted considerable attention due to their environment-friendly nature and extensive sources. As a kind of cellulose derivatives, ethyl cellulose (EC) is a kind of biocompatible material with abundant surface functional groups. EC have been widely used in the fields of drug matrix, encapsulating materials and coating and so on. However, there are very few reports on the study of its carbon materials. In the present study, a simple method was conducted to convert ethyl cellulose into HTC spherical carbon which has smooth surface and narrow size distribution. Then, we prepared activated carbon using static air as active agent which is safe and efficient; these activated carbon spheres showed high specific surface area and pore volume.
2 Experimental
2.1 Chemicals and reagents
Ethyl cellulose (EC) was supplied by Aladdin Chemical. Methylene blue (MB, C.I. Basic Blue 9), methyl orange (MO, C.I. Acid Orange 52), crystal violet (CV, C.I. Basic Violet 3) and amino black 10B (AB, C.I. Acid Black 1) were purchased from Sinopharm Chemical Reagent Company. All of the chemicals are of analytical grade and used without further purification. Milli-Q water was used in all experiments.
2.2 Hydrothermal carbonization of EC
A certain amount of EC was dispersed in 180 mL of water, then the mixture was sealed in a autoclave (volume: 500 mL) and heated in range of 200–250 °C for 8–16 h. After cooling to room temperature, the black solid products were washed with deionized water and ethanol for several times and dried at 80 °C for 6 h in an oven.
2.3 Activation of HTC carbon spheres
1 g of HTC material was transferred into a crucible with a lid. Then, the crucible was placed in a muffle furnace. The HTC carbon spheres were activated at different temperatures (600, 700, 800, 900 °C) and maintained for 1 h at desired temperature. The procedure was conducted according to Gong et al.31 The obtained black powders were named as EC-T-T′ (T is the HTC temperature and T′ is the activating temperature).
2.4 Dye adsorption experiment
100 mg of methylene blue, methyl orange, crystal violet and amino black 10B were respectively dissolved in 1 L of deionized water. The pH values of dyes solution were adjusted using 0.1 M HCl or 0.1 M NaOH solutions. 10 mg of EC-250-900 powders was transferred into a glass bottle of 40 mL above-mentioned four kinds of dye solution, and then the mixture were shaken at 150 rpm at 25 °C. The absorbance was measured with UV/vis spectrophotometry at respective wavelengths of maximum absorbance (Table S1†), C0 (initial concentration) and Ce (equilibrium concentration) are calculated using Lambert–Beer's law. The qe (adsorbed amounts) is given by the following equation:
with qe, the adsorbed amounts (mg g−1); C0 and Ce, the initial and equilibrium concentration of dye solution (mg L−1), respectively; m, the weight of EC-250-900 (g); V, the volume of the solution (L).
2.5 Characterization
The morphologies of samples were characterized by 3400NI scanning electron microscopy (SEM), JSM 7600F field emission scanning electron microscopy (FESEM) and JEM-200CX transmission electron microscopy (HRTEM). The zeta potential and particle size distribution were measured by Malvern ZetaSizer Nano-ZS Zen 3600. The surface functional groups of the EC and spherical carbon were measured using a Nicolet iS10 FT-IR spectrometer by KBr method. The spectra were obtained in a spectral range of 4000–500 cm−1 at 4 cm−1 resolution and averaged over 16 scans per sample. X-ray diffraction (XRD) patterns of spherical carbon and activated carbon spheres were recorded on a Siemens D5000 rotating anode wide angle X-ray diffract meter with Cu Kα radiation (λ = 0.154 nm) at 40 kV and 30 mA. The diffraction data were collected at room temperature over the 2θ range of 10–80° at a scanning speed of 0.01° s−1. X-ray photoelectron spectroscopy (XPS) was carried out to determine the surface composition of carbon materials. XPS was performed using a Kratos Axis Ultra DLD spectrometer equipped with monochromatic Al-Kα radiation at 1486.6 eV. Charge referencing was conducted by setting binding energy of C 1s at 285.0 eV. The XPS spectra were obtained with an aperture slot of 300 × 700 μm2. The BET specific surface areas were obtained from nitrogen adsorption isotherms performed at −196 °C with a nitrogen sorption instrument (Micromeritics ASAP 2020). The pore size distribution and the pore volume of the activated CSs were estimated by the DFT model.
3 Results and discussions
3.1 Preparation and characterization of carbon spheres
3.1.1 The morphology of the carbon spheres under different temperatures. 6 g of EC was dispersed in 180 mL of water (the proportion of EC and water was 1
:
30), then the mixture was heated at (200, 220, 240, 250) °C for 8 h respectively. The morphologies of carbon spheres are shown in Fig. 1.
 |
| Fig. 1 SEM images of carbon spheres prepared under different temperatures. (a) 200 °C; (b) 220 °C; (c) 240 °C; (d) 250 °C (insert shows the corresponding size histogram of the CSs). | |
It could be clearly seen that the carbonaceous material heated under 200 °C initially had spherical structure, due to incomplete carbonization. When the temperature increased to 220 °C, even carbonaceous material possessed spherical structure, whereas they all stuck together. When the temperature continuously increases to 240 °C, there were so many carbon spheres observed, but they are stuck with each other slightly. The particle size distribution was not uniformed. Finally, as the temperature was 250 °C, it was evident that the shape of CSs becomes regular and smooth. The corresponding size distribution histogram (Fig. 1d, insert) revealed that the size of obtained CSs is uniformed and the average diameter is 1.3 μm which satisfies our needs. Thus 250 °C was selected for the optimum carbonization temperature in the following experiments.
3.1.2 The morphology of the carbon spheres under different proportion of EC and water. 9 g and 4.5 g of EC were respectively dispersed in 180 mL of water (the proportion of EC and water were 1
:
20 and 1
:
40, respectively), and the mixture was treated hydrothermally at 250 °C and maintained for 8 h. The SEM images of products are illustrated in Fig. 2.
 |
| Fig. 2 SEM images of spherical carbon prepared under different proportion of EC and water. (a) 1 : 20; (b) 1 : 40. | |
Fig. 2a shows that when the proportion of EC and water was 1
:
20, the spherical structure of carbonaceous material was not obvious, and the particles were not uniformed in size and distribution. However, when the proportion was adjusted to 1
:
40, lots of CSs were produced, and CSs were also regular and smooth. Fig. 1d (1
:
30) and Fig. 2 revealed that CSs obtained under different proportion of EC and water showed different morphology; with the proportion decreasing, the particle size decreased. If we continued to reduce EC content, the efficiency would be low, therefore the proportion of 1
:
30 (EC
:
water) was chosen as the optimum proportion.
3.1.3 The morphology of the carbon spheres under different HTC time. 6 g of EC was dispersed in 180 mL of water, the mixture was heated at 250 °C for 6 h, 10 h and 12 h respectively.In Fig. 3 it is apparent that when the HTC time was different, the morphology of the carbon spheres were not the same but the distribution of particle diameter did not change a lot. As can be seen from Fig. 3a, carbon material showed initially spherical structure when EC was heated at 250 °C and maintained for 6 h, the particle size was larger and showed a not uniformed distribution. Fig. 1d (8 h) shows that when the HTC time was 8 h, the morphologies and size distribution of HTC carbon spheres were better. Additionally, carbon materials severely stuck and the spherical structure became irregular with the extending of hydrothermal time, as shown in Fig. 3b and c (10 h, 12 h). This phenomenon may be due to dehydration condensation, 8 h was selected as the optimum HTC time.
 |
| Fig. 3 SEM images of spherical carbon prepared under different HTC time. (a) 6 h; (b) 10 h; (c) 12 h. | |
From the above analysis, one can conclude that the optimum condition is as followed: EC is hydrothermally treated at 250 °C for 8 h, and the proportion of EC and water is 1
:
30 (these materials were denoted as EC-250). In this way, the resulting material showed regular spherical structure, smooth surface and homogeneous diameter (Fig. 1d).
3.2 Characterization of activated carbon
3.2.1 Scanning electron microscopy analysis. The morphologies of EC-250 and activated CSs were characterized by FESEM. Fig. 5 revealed that EC-250 lacked of porosity (Fig. 5a), which is the characteristics of HTC materials. It is well-known that the diameters of micropore and mesopore were in the range of 0–2 nm and 2–50 nm, respectively. Therefore, it was difficult to observe the porosity on the samples of EC-250-600 and EC-250-700 (Fig. 5b and c) which belonged to microporous materials. As for EC-250-800 (Fig. 5d), it can be easily seen that a small quantity of mesopore was introduced into CSs. Compared with EC-250-800, the EC-250-900 (Fig. 5e) showed obvious mesopore which could be attributed to better calcination under high temperature. Hence activating carbon materials under static air was a simple and green method to prepare CSs with high pore volumes.
 |
| Fig. 5 FESEM images of (a) EC-250, (b) EC-250-600, (c) EC-250-700, (d) EC-250-800, (e) EC-250-900. | |
3.2.2 Transmission electron microscopy analysis. Fig. 6 showed the morphologies of EC-250 and activated CSs. HRTEM analysis could support the FESEM characterization. Visible rough edges can be seen on the surface of activated CSs (Fig. 6b–e) and it means that the porosity was caused by carbonization under high temperature. HRTEM images revealed the porous structures were greatly affected by the activation temperature. As for EC-250-600, the rough edge was inconspicuous which was resulted from lower activated temperature. However, the amount of porous structures of obtained activated CSs increased with the increase of temperature. It was easy to see that EC-250-900 possessed the most abundant porous structures. Last but not least, the shape of obtained CSs was regular after high-temperature carbonization.
 |
| Fig. 6 HRTEM images of (a) EC-250, (b) EC-250-600, (c) EC-250-700, (d) EC-250-800, (e) EC-250-900. | |
3.2.3 X-ray photoelectron spectra. The surface functionalities of EC, EC-250 and EC-250-900 were analyzed using XPS measurement which can support the FT-IR data. High-resolution C 1s XPS spectra could be deconvoluted into four categories: aromatic or alkyl aromatic groups (C1, C
C/CHx/C–C, 284.6 eV), hydroxyl groups or ethers (C2, C–O–C/C–OH, 286.7 eV), carbonyl groups (C3, C
O, 287.2 eV) and carboxylic acid or lactone (C4, O
C–O, 289.0 eV).28,35–37 There was only one peak in the XPS spectrum of EC, as shown in Fig. 7a, which refers to C–O–C/C–OH group. Fig. 7b showed that four peaks (284.6 eV, 286.7 eV, 287.2 eV and 289.0 eV) attributed to C1, C2, C3 and C4 were found in the C 1s XPS spectrum of EC-250, which indicated that there were new functional groups (–COOR and C
C) appeared after hydrothermal treatment. The results agreed well with FT-IR analysis, and further suggested the presence of aromatic and carboxylic groups which resulted from aromatization and dehydration. After activating the HTC materials at 900 °C (Fig. 7c), oxygenated functional groups decreased and two peaks centered at 284.6 eV and 286.7 eV corresponding to C
C/CHx/C–C and C–O–C/C–OH respectively narrowed down due to the high-temperature carbonization. It was worth noting that the zeta potentials of EC-250 and EC-250-900 suspension were −56 mV and −18 mV at pH 7.0, respectively, which could support the FT-IR and XPS data. In addition, the structural order of carbon materials was analyzed by X-ray diffraction (Fig. S1†).
 |
| Fig. 7 XPS spectra of EC, EC-250 and EC-250-900. | |
3.2.4 Nitrogen sorption isotherms. The porosity and specific surface area of activated carbon materials were studied under different activation temperature. The nitrogen adsorption–desorption isotherms and corresponding DFT pore size distributions of prepared samples are demonstrated in Fig. S2.† Table 1 showed that the BET surface area of obtained carbon materials increased with increasing heat treatment, and it was true for pore volume. Compared with EC-250-600, the BET surface area of EC-250-900 was significantly higher (1180 m2 g−1). What's more, the yield of carbon materials reduced with rising activation temperature. Considering lower yield at higher activation temperature, we selected 900 °C as the heat temperature.
Table 1 Textual properties of activated carbon and HTC materials
Sample |
SBET (m2 g−1) |
Vmicro (cm3 g−1) |
Vmeso (cm3 g−1) |
Vtotal (cm3 g−1) |
Yield/% |
EC-250 |
0.9 |
— |
— |
— |
— |
EC-250-600 |
466 |
0.19 |
0.03 |
0.22 |
51 |
EC-250-700 |
497 |
0.19 |
0.07 |
0.26 |
46 |
EC-250-800 |
784 |
0.27 |
0.16 |
0.43 |
40 |
EC-250-900 |
1180 |
0.40 |
0.21 |
0.62 |
34 |
3.3 The removal capacity of dyes on activated carbon at different pH
Dyes are widely used in paper, rubber, textile and printing industry, however, most of them are deeply colored and their degradation products may cause pollution in water. Table 1 demonstrated that EC-250-900 has a larger mesopore volume than EC-250-600, EC-250-700 and EC-250-800, which is more favorable to the adsorption of organic dyes. So, EC-250-900 was selected to test the adsorption capacity. Here, the removal capacity of EC-250-900 to MB, MO, CV and AB at different pH was studied, respectively, and the initial concentration of dyes was 100 mg L−1. The initial pH of the dye solution was adjusted using 0.1 M HCl or 0.1 M NaOH solutions.
Fig. 8 illustrated that the adsorption of different dyes on activated carbon was quite different, from pH 2 to pH 11. This difference could be ascribed to the molecular structure, charge properties of dyes and hydrogen bond. The deprotonated groups of EC-250-900 are mostly –CO–O− (dissociation constant, pKa of 3–5) and –O− (pKa of 5–7).38 In addition, the amount of negative charge increased with the increasing of pH value. As seen in Fig. 8, the EC-250-900 had the highest adsorption capacity for MB from pH 3 to pH 11. On the one hand, MB belongs to cationic dyes, so the adsorption ratio of it by activated carbon was high due to the adsorption mechanism of electrostatic interaction;39 on the other hand, the molecular structure of MB is flatter which contributed to adsorption capacity.40 It is worth mentioning that EC-250-900 showed higher adsorption capacity for MB compared with mesoporous carbons prepared from furfuryl alcohol and sucrose.41,42 Similarly, the removal adsorption of CV (cationic dye) increased, with the increasing of the pH. Compared with cationic dyes, anionic dyes (AB and MO) showed higher removal capacity within the range pH 2–3. In this pH range the surface of CSs was positively charged, however, AB and MO were negatively charged. With the increase of pH value, the removal capacity of MO and AB decreased. It is worth mentioning that hydrogen bond between dyes and CSs could contribute to the adsorption of dyes on activated carbon.43 Above all, the adsorption ability of activated carbon samples for different dyes is influenced by many factors, all of the factors should be taken into account.
 |
| Fig. 8 Effect of pH on adsorption of dyes. | |
4 Conclusions
In summary, using ethyl cellulose as carbon source, HTC spherical carbons was successfully prepared. And activated carbon spheres were obtained by activating the HTC spherical carbon via static air under high temperature; then the removal capacity of these activated carbon spheres for four dyes at different pH was investigated. By using single-factor test, preparation technology of carbon spheres was optimized. The condition is as followed: the temperature and time of HTC are 250 °C and 8 h, respectively, and the proportion of EC and water is 1
:
30. FT-IR and XPS analysis revealed that there were new functional groups such as carboxyl and aromatic ring appeared during HTC process. In addition, activated carbon spheres with a high specific surface area and abundant micropore at 900 °C were prepared. The superficial analysis by nitrogen-adsorption demonstrated that the specific surface area and pore volume increasing when the temperature increases. Finally, the activated carbon spheres were applied to the adsorption of methylene blue (MB), methyl orange (MO), crystal violet (CV) and amino black 10B (AB). Adsorption experiments reflected that the activated carbons prepared show remarkable adsorption capacity for MB, and they also have certain adsorption properties with MO, CV and AB. All in all, we provide a straightforward and facile way to produce porous activated carbon sphere materials, which not only broadens the application of cellulose derivative, but also has contribution to the sewage treatment industry.
Acknowledgements
The authors express their gratitude for the financial support provided by the National “Twelfth Five-Year” Plan for Science & Technology Support of China (2015BAD14B06), Special Funds Projects for Basic Scientific Research Business Expenses of Central Public Welfare Research Institutes in Chinese Academy of Forestry (CAFINT2015C01), National Science Foundation of China (31170540) and Natural Science Foundation of Jiangsu Province of China (BK20150071).
References
- J. Liu, N. P. Wickramaratne, S. Z. Qiao and M. Jaroniec, Nat. Mater., 2015, 14, 763–774 CrossRef CAS PubMed
. - P. F. Zhang, Z. A. Qiao and S. Dai, Chem. Commun., 2015, 51, 9246–9256 RSC
. - Y. S. Hu, R. Demir-Cakan, M. M. Titirici, J. O. Muller, R. Schlogl, M. Antonietti and J. Maier, Angew. Chem., Int. Ed., 2008, 47, 1645–1649 CrossRef CAS PubMed
. - A. D. Roberts, X. Li and H. Zhang, Chem. Soc. Rev., 2014, 43, 4341–4356 RSC
. - G. Y. Zhao, L. Zhang, Y. F. Meng, N. Q. Zhang and K. N. Sun, Mater. Lett., 2013, 96, 170–173 CrossRef CAS
. - C. Song, J. Du, J. Zhao, S. Feng, G. Du and Z. Zhu, Chem. Mater., 2009, 21, 1524–1530 CrossRef CAS
. - R. Z. Yang, X. P. Qiu, H. R. Zhang, J. Q. Li, W. T. Zhu, Z. X. Wang, X. J. Huang and L. Q. Chen, Carbon, 2005, 43, 11–16 CrossRef CAS
. - R. Demir-Cakan, N. Baccile, M. Antonietti and M.-M. Titirici, Chem. Mater., 2009, 21, 484–490 CrossRef CAS
. - Z.-b. Zhang, Y.-h. Liu, X.-h. Cao and P. Liang, J. Radioanal. Nucl. Chem., 2013, 295, 1775–1782 CrossRef CAS
. - Y. Yi, G. Zhu, H. Sun, J. Sun and X. Wu, Biosens. Bioelectron., 2016, 86, 62–67 CrossRef CAS PubMed
. - S. Zhong, W. Huang, Y. Tian and X. Wang, Mater. Lett., 2016, 179, 86–89 CrossRef CAS
. - L. Gherghel, C. Kubel, G. Lieser, H. J. Rader and K. Mullen, J. Am. Chem. Soc., 2002, 124, 13130–13138 CrossRef CAS PubMed
. - W. M. Qiao, Y. Song, S. Y. Lim, S. H. Hong, S. H. Yoon, I. Mochida and T. Imaoka, Carbon, 2006, 44, 187–190 CrossRef CAS
. - P. Serp, R. Feurer, P. Kalck, Y. Kihn, J. L. Faria and J. L. Figueiredo, Carbon, 2001, 39, 621–626 CrossRef CAS
. - C. He, A. Giannis and J. Y. Wang, Appl. Energy, 2013, 111, 257–266 CrossRef CAS
. - G. K. Parshetti, Z. Liu, A. Jain, M. P. Srinivasan and R. Balasubramanian, Fuel, 2013, 111, 201–210 CrossRef CAS
. - N. D. Berge, K. S. Ro, J. Mao, J. R. Flora, M. A. Chappell and S. Bae, Environ. Sci. Technol., 2011, 45, 5696–5703 CrossRef CAS PubMed
. - M. Sevilla and A. B. Fuertes, Carbon, 2009, 47, 2281–2289 CrossRef CAS
. - Z. Liu, A. Quek, S. Kent Hoekman, M. P. Srinivasan and R. Balasubramanian, Bioresour. Technol., 2012, 123, 646–652 CrossRef CAS PubMed
. - Y. T. Gong, L. Xie, H. R. Li and Y. Wang, Chem. Commun., 2014, 50, 12633–12636 RSC
. - S. P. Wang, R. H. Liu, C. L. Han, J. Wang, M. M. Li, J. Yao, H. R. Li and Y. Wang, Nanoscale, 2014, 6, 13510–13517 RSC
. - L. Wang, Y. Guo, B. Zou, C. Rong, X. Ma, Y. Qu, Y. Li and Z. Wang, Bioresour. Technol., 2011, 102, 1947–1950 CrossRef CAS PubMed
. - X. Yang, D. Jin, M. Zhang, P. Wu, H. Jin, J. Li, X. Wang, H. Ge, Z. Wang and H. Lou, Mater. Chem. Phys., 2016, 174, 179–186 CrossRef CAS
. - S. Zhao, J. Xiang, C.-Y. Wang and M.-M. Chen, J. Porous Mater., 2012, 20, 15–20 CrossRef
. - X. Song, P. Gunawan, R. Jiang, S. S. Leong, K. Wang and R. Xu, J. Hazard. Mater., 2011, 194, 162–168 CrossRef CAS PubMed
. - M. Sevilla and A. B. Fuertes, Energy Environ. Sci., 2011, 4, 1765–1771 CAS
. - C. Falco, J. P. Marco-Lozar, D. Salinas-Torres, E. Morallon, D. Cazorla-Amoros, M. M. Titirici and D. Lozano-Castello, Carbon, 2013, 62, 346–355 CrossRef CAS
. - A. J. Romero-Anaya, M. A. Lillo-Rodenas, C. Salinas-Martinez de Lecea and A. Linares-Solano, Carbon, 2012, 50, 3158–3169 CrossRef CAS
. - A. Singh and D. Lal, J. Appl. Polym. Sci., 2010, 115, 2409–2415 CrossRef CAS
. - A. J. Romero-Anaya, M. A. Lillo-Ródenas and A. Linares-Solano, Carbon, 2010, 48, 2625–2633 CrossRef CAS
. - Y. Gong, H. Wang, Z. Wei, L. Xie and Y. Wang, ACS Sustainable Chem. Eng., 2014, 2, 2435–2441 CrossRef CAS
. - Y. T. Gong, Z. Z. Wei, J. Wang, P. F. Zhang, H. R. Li and Y. Wang, Sci. Rep., 2014, 4, 1–6 Search PubMed
. - I. Novák, P. Sysel, J. Zemek, M. Špírková, D. Velič, M. Aranyosiová, Š. Florián, V. Pollák, A. Kleinová, F. Lednický and I. Janigová, Eur. Polym. J., 2009, 45, 57–69 CrossRef
. - X. M. Sun and Y. D. Li, Angew. Chem., Int. Ed., 2004, 43, 597–601 CrossRef PubMed
. - M. Sevilla and A. B. Fuertes, Chem.–Eur. J., 2009, 15, 4195–4203 CrossRef CAS PubMed
. - M. M. Titirici, A. Thomas, S.-H. Yu, J.-O. Mueller and M. Antonietti, Chem. Mater., 2007, 19, 4205–4212 CrossRef CAS
. - S. Kubo, I. Tan, R. J. White, M. Antonietti and M.-M. Titirici, Chem. Mater., 2010, 22, 6590–6597 CrossRef CAS
. - D. C. W. Tsang, J. Hu, M. Y. Liu, W. H. Zhang, K. C. K. Lai and I. M. C. Lo, Water, Air, Soil Pollut., 2007, 184, 141–155 CrossRef CAS
. - K. Mahmoudi, K. Hosni, N. Hamdi and E. Srasra, Korean J. Chem. Eng., 2014, 32, 274–283 CrossRef
. - C. A. Demarchi, A. Debrassi and C. A. Rodrigues, Color. Technol., 2012, 128, 208–217 CAS
. - C. Yan, C. Wang, J. Yao, L. Zhang and X. Liu, Colloids Surf., A, 2009, 333, 115–119 CrossRef CAS
. - X. Yuan, S.-P. Zhuo, W. Xing, H.-Y. Cui, X.-D. Dai, X.-M. Liu and Z.-F. Yan, J. Colloid Interface Sci., 2007, 310, 83–89 CrossRef CAS PubMed
. - L. Huang, Y. Sun, W. Wang, Q. Yue and T. Yang, Chem. Eng. J., 2011, 171, 1446–1453 CrossRef CAS
.
Footnote |
† Electronic supplementary information (ESI) available. See DOI: 10.1039/c6ra16737c |
|
This journal is © The Royal Society of Chemistry 2016 |
Click here to see how this site uses Cookies. View our privacy policy here.