Rutile nanotubes by electrochemical anodization

Rangasamy Savitha, Ravikrishna Raghunathan and Raghuram Chetty*
Department of Chemical Engineering, Indian Institute of Technology Madras, Chennai, Tamil Nadu, India. E-mail: raghuc@iitm.ac.in; Fax: +91 44 2257 4152; Tel: +91 44 2257 4178

Received 28th June 2016 , Accepted 1st August 2016

First published on 1st August 2016


Abstract

We present a facile method to synthesize rutile titanium dioxide nanotubes (R-TiNT), directly in powder form through rapid breakdown electrochemical anodization by modifying the post anodization processing and annealing temperature. Photocatalytic activity of the R-TiNT was examined by evaluating the degradation of rhodamine B dye in visible light.

Titania (TiO2) is a widely studied semiconducting material for its potential application in photocatalytic degradation of organic pollutants.1,2 The current research trend is focused on increasing the overall activity of titania by (a) tailoring the size/morphology for higher surface area/volume ratio and (b) making it more amenable to utilizing visible radiation for photocatalysis.3,4 TiO2 naturally occurs in three crystalline forms – anatase, rutile and brookite. A large fraction of the titania used in the current photocatalytic applications is in the form of anatase nanoparticles, which display superior reactivity over other crystalline forms mainly in the UV region.5 Though it has been reported that the rutile form of titania has a lower band gap and is more suitable to utilize visible radiation,6 kinetically it is less active compared to the anatase form.3 However, rutile nanostructures displayed higher performance for harvesting sunlight in Dye Sensitized Solar Cells (DSSC)7,8 and in oxygen evolution from water splitting.9 In order to efficiently utilize solar radiation for photocatalytic activity, the use of nanostructured rutile phase mixed titania is preferred, since a significant portion of sunlight is in the visible region.

Recently, one dimensional titania nanotubes have attracted much interest because of its high surface to volume ratio, lesser number of grain boundaries and lower recombination of electron–hole on the surface compared to titania nanoparticles.10,11 Among the different methods available for the synthesis of titania nanotubes, electrochemical anodization is considered to be economical and effective way to synthesize homogeneously arrayed nanotubes on metal surface.12–16 In this method, the metal is exposed to sufficient anodic potential resulting in the formation of a metal oxide layer which is partially soluble (etchable) in an electrolyte solution containing fluoride ions. With the combined effect of electric field and chemical etching with the fluoride ions, the tubular structure deepens in length etching into the metal surface depending on the anodization conditions.15 However, the process of separating the nanotubes from the metal surface requires mechanical scrapping, which results in significant damage to the nanotubes structure and it is difficult to obtain in large quantities. Replacing the fluoride ions in electrolyte solution with aqueous chloride ions resulted in the formation of nanotube bundles that are detached and suspended in the electrolyte.17 In this case, sudden volume expansion and vigorous reaction environment on the metal surface provides breakdown condition for nanotubes, resulting in the detachment of the nanotube bundles from the metal surface.18,19 This method of electrochemical anodization, known as Rapid Breakdown Anodization (RBA)20 is extremely rapid since nanotubes of few micrometers can be formed within few seconds.20,21 Compared to highly ordered nanotubes attached to the metal surface, free standing disordered nanotubes in bundles produced through RBA have been reported for better photocatalytic performance.11

A commonly used method for the synthesis of rutile phase titania in nanoparticle form is the high temperature (>600 °C) sintering of anatase nanoparticles.22 However, in case of TiO2 nanotubes, high temperature sintering will result in crumbling of the tubular structure due to its low thermal stability. Eder et al.,23 reported synthesis of unattached rutile nanotubes using carbon nanotubes (CNT) as sacrificial template in sol–gel method, where crystalline rutile phase was achieved from consecutive heat treatment of TiO2 coated CNT. Kar et al.24 reported fabrication of rutile TiO2 nanotubes attached to Ti metal surface synthesized via anodization by direct propane flame annealing.

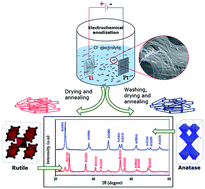
In this study, we present a facile method to synthesize unattached free TiO2 nanotubes in rutile phase and also with different phase ratio of anatase to rutile without using any sacrificial template. In our method, a nanotube suspension was obtained from the dissolution of titanium foil using the RBA process (ESI Fig. S1) in perchloric acid (100 mM) electrolyte with an applied potential of 20 V. Then, two different drying routines were attempted. In the first routine, amorphous nanotube suspension (with the chloride ions) was left to dry with residual electrolyte solution (denoted as WW-TiNT). In the second routine, the amorphous nanotubes were washed with de-ionised water to remove chloride ions and then dried (denoted as TiNT).

Fig. 1a shows the SEM image of the bundled amorphous nanotubes obtained after drying of the anodized suspension (WW-TiNT). Fig. 1b shows the corresponding TEM image of amorphous nanotubes clearly outlining the inner and outer walls. TiO2 nanotubes of 15 nm outer diameter and 4 nm wall thickness with varying lengths in the order of several micrometers were obtained in this process. These amorphous nanotubes were then annealed to 500 °C for three hours. Fig. 1c shows the transformation of the amorphous nanotubes to crystalline form during the heat treatment. Retention of the tubular morphology after heat treatment (up to 500 °C) is evident from the representative SEM and TEM micrographs shown in Fig. 1c and d, respectively (SEM and TEM micrographs of TiNT are also shown in ESI Fig. S2 and S3). Increasing the calcination temperature beyond 500 °C resulted in the collapse of the nanotube morphology for both WW-TiNT and TiNT (shown in ESI Fig. S4). Hence, the threshold heating temperature to retain tubular structure was set at 500 °C for the nanotubes obtained by this process.


image file: c6ra16708j-f1.tif
Fig. 1 Electron micrographs of TiO2 nanotubes before and after heat treatment at 500 °C. (a) SEM showing smooth bundled amorphous TiNT, (b) TEM of amorphous bundle TiNT with clear outer and inner wall confirming tubular morphology, (c) SEM and (d) TEM images showing nanotubes structure after heat treatment. TEM of A-TiNT (e) and R-TiNT (f) with insets showing the corresponding SAED images.

Heat treatment of TiNT (nanotubes from anodization process washed with DI water) resulted in the nanotubes with phase pure anatase crystallinity (annealed sample is referred as A-TiNT) as expected, whereas annealing WW-TiNT (nanotubes with residual chloride ions) resulted in dominant rutile phase evolution (annealed sample is referred as R-TiNT). The lattice spacing of 0.349 nm shown in TEM micrograph (Fig. 1e) corresponds to inter planar distance for anatase 101 phase and the micrograph in Fig. 1f signifies the co-existence of rutile 101 (lattice spacing 0.249 nm) and anatase 101 (lattice spacing 0.346 nm), revealing mixed phase titania. The selected area diffraction pattern shown in upper half of the insets in Fig. 1e and f outlines the experimental crystallographic pattern of A-TiNT and R-TiNT samples, whereas lower half of the corresponding images show the calculated rings for anatase represented by A (phase) and rutile represented by R (phase). Fig. 2a and b shows the XRD pattern of A-TiNT and R-TiNT. The peaks seen in A-TiNT at 2θ 25.210, 37.527 and 47.875 corresponds to anatase phase (khl), 101, 004 and 200 plane respectively, whereas the dominant peaks of R-TiNT at 2θ 27.434, 36.076 and 54.316 is the reflection from rutile phase (khl), 110, 101 and 211 plane, respectively. This confirms the formation of rutile crystallinity from WW-TiNT. The Raman spectroscopy measurement of A-TiNT shows the anatase specific bands at 147, 198, 396, 515 and 640 cm−1 which is attributed to the vibrational modes of A1g, B1g and Eg, whereas in R-TiNT, additional bands were observed at 446 cm−1 and 615 cm−1 representing the Eg and A1g vibrational modes of rutile crystallinity (Raman spectrum in ESI Fig. S5). The phase ratio between rutile to anatase was evaluated using Spurr Myers' equation25 by substituting the corresponding intensities of anatase (101) and rutile (110) peaks from the XRD pattern (details in ESI). The R-TiNT obtained in this process showed 70% rutile and 30% anatase phase composition.


image file: c6ra16708j-f2.tif
Fig. 2 (a) XRD pattern of annealed TiNT (A-TiNT), (b) XRD pattern of annealed without washing TiNT (R-TiNT), (c) phase ratio calculated using Spurr Myer's equation from XRD peak intensity (with anatase-101 and rutile-110 planes) for the calcined samples.

It is evident from the literature that the critical particle size for rutile phase can be obtained by sintering of the primary anatase particles.22 Alternatively, Luan et al.,26 synthesized TiO2 nanoparticles in rutile phase by incorporating chloride ions (in the form of hydrochloric acid) during synthesis process. High sensitivity of HCl concentration on phase formation with different reaction pathways was also reported by Coronado et al.,27 using amorphous titania nanoparticle as a common starting material. Based on these literature, it is likely that in the case of WW-TiNT, presence of chloride ions could have accelerated the sintering of anatase crystallites resulting in rutile phase growth (XRD pattern for various heat treatment is given in ESI Fig. S6 for TiNT and S7 for WW-TiNT).

Zhang et al., studied the influence of electrophilic and nucleophilic property of proton and perchlorate ions from HClO4 (added in the precursor solution) on crystalline phase of nanosized TiO2 formed by reverse micelles method.28 In an attempt to explore the influence of chloride ions availability (in any form) for the formation of rutile phase TiO2, two different controlled experiments were carried out. In first attempt, the anodized amorphous nanotubes (WW-TiNT) obtained were dried with different amount of residual electrolyte (∼2 gram of nanotubes with 2, 3.5, 5 and 6.5 mL of residual electrolyte) followed by annealing at 500 °C. The crystallographic XRD pattern of these nanotubes revealed the different ratios of anatase to rutile crystallinity (samples are referred as RE-x, where x denotes the corresponding volume of residual electrolyte used for drying). In the second attempt, TiNT (nanotubes obtained by RBA process where the chloride ions were washed with DI water and dried) was mixed with different concentrations of HClO4 and HCl solution. The different treatment conditions with TiNT were: (a) PA-25 → TiNT mixed with 25 mM of HClO4, (b) PA-50 → TiNT mixed with 50 mM of HClO4, (c) PA-100 → TiNT mixed with 100 mM of HClO4, (d) HA-100 → TiNT mixed with 100 mM of HCl and (e) HA-300 → TiNT mixed with 300 mM of HCl. Then these samples were dried at room temperature, and annealed at 500 °C. Fig. 2c shows the percentage comparison of rutile to anatase phase formed for the WW-TiNT samples which were dried with different residual electrolytes, along with TiNT samples treated with known chloride ion concentrations and heat treated at 500 °C. The corresponding XRD patterns are shown in Fig. S8 to S10 in ESI. For comparison, commercial Degussa P25 and R-TiNT is also presented in Fig. 2c. There is 20% increase in rutile content with every 1.5 mL increase in residual electrolyte (100 mM HClO4) volume. As mentioned earlier, the presence of chloride ions have resulted in rutile crystallinity. Salari et al.,29 have reported an enhancement in anatase to rutile phase transition by the influence of oxygen deficient environment during heat treatment. In our case, an increase in electrolyte volume, have increased the accessibility of Ti ions towards Cl ions thereby creating oxygen deficient environment (as evident from the EDX results in ESI Table S1). Thus, the percentage of rutile phase increased with the increase in HClO4 or HCl concentrations, though the increase was much more pronounced in the case of HClO4. The source of chloride ions seems to influence the percentage of rutile phase formation, as the samples treated with 100 mM HClO4 (PA-100) and 100 mM HCl (HA-100) showed 80% and 36% rutile phase, respectively. Increasing the HClO4 concentration from 25 mM to 50 mM and further to 100 mM resulted in 30% increase in rutile content at each step for PA-25, PA-50, and PA-100. Another control experiment to confirm the role of chloride ions for rutile phase formation was performed by treating TiNT with 100 mM H2SO4; as expected, only anatase phase was observed after drying and heat treatment at 500 °C (ESI Fig. S11).

In both the above observations, increasing the residual electrolyte volume beyond 6.5 mL and acid concentration beyond 100 mM also showed higher rutile phase evolution however, the nanotube morphology was completely lost. Even RE-6.5 (obtained by drying WW-TiNT with 6.5 mL residual electrolyte) showed chain like morphology instead of the usual tubular structure. From these results, it seems that replacing HCl with HClO4 favored higher rutile crystallinity without compromising the tubular morphology. The above observations suggest that precise control over phase ratio between anatase and rutile could be achieved by choosing appropriate chloride ion source and amount with optimal heat treatment temperature.

Measurement of the diffusive reflectance spectrum of the samples showed that the presence of rutile phase in TiO2 nanotubes has significantly lowered the band gap from 3.102 eV for pure anatase phase (A-TiNT) to 2.900 eV for R-TiNT (ESI Fig. S12). The red shift in the reflectance spectrum of R-TiNT was inferred to its visible light absorbance compared to A-TiNT and commercial P25. Hence, the visible light activity of the catalyst was investigated for its degradation performance using rhodamine-B (RhB) as a model compound.

Rhodamine-B (RhB) is identified as highly toxic and potentially carcinogenic molecule. Removal of RhB is an important aspect in dye effluent treatment30,31 and has been used in several degradation studies using different forms of pristine and modified TiO2.32–35 Luan et al.,26 reported TiO2 nanoparticles with rutile phase showing better degradation of RhB than pure anatase. Here, we have studied the photocatalytic activity of TiO2 nanotubes (A-TiNT and R-TiNT) under visible light (80 W LED lamp, the spectrum of the LED lamp is given in ESI Fig. S13) on RhB and the degradation efficiency was compared with that obtained using commercial TiO2 nanoparticle (Degussa-P25). A batch photo reactor with a volume of 100 mL was used for the degradation experiments. Aqueous solution with an initial concentration of 20.8 μM of RhB was mixed with 0.2 g of catalyst and the suspension was exposed to the light source. The reaction mixture was kept in suspension using a magnetic stirrer. The change in the aqueous concentration of RhB was monitored periodically by withdrawing samples and analyzing in UV-vis spectrophotometer.

Fig. 3 shows the comparison of RhB degradation with rutile and anatase nanotubes and P25 nanoparticles. Degradation rates were in the following order: R-TiNT > A-TiNT > P25 (Degussa) > no catalyst (photolysis). R-TiNT showed the highest degradation efficiency of 80% compared to A-TiNT with 40% and the degradation efficiency of P25 is 15% after exposure to radiation for three hours. The least performance of P25 can be attributed to the particulate nature with numerous grain boundaries hindering the free movement of electrons between catalyst-dye inter junction, whereas nanotubular morphology of A-TiNT and R-TiNT resulted in higher performance than P25.


image file: c6ra16708j-f3.tif
Fig. 3 Photodegradation of rhodamine-B with different crystalline TiO2 nanotubes phase as compared to commercial P25 nanoparticles.

Conclusion

TiO2 nanotubes with varying rutile phase were successfully prepared by exploiting the role of perchlorate ions in amorphous nanotubes followed by thermal annealing. Nanotubes with different phase ratios of anatase to rutile is possible to obtain with the manipulation of HClO4 concentration and heat treatment temperature. The presence of rutile phase has considerably improved the visible light photocatalytic activity of the catalyst on a model organic dye (rhodamine B). R-TiNT showed 60% and 30% higher degradation efficiency compared to commercial P25 nanoparticles and A-TiNT nanotubes, respectively.

References

  1. A. L. Linsebigler, J. T. Yates Jr, G. Lu, G. Lu and J. T. Yates, Chem. Rev., 1995, 95, 735–758 CrossRef CAS.
  2. A. Fujishima, T. N. Rao and D. A. Tryk, J. Photochem. Photobiol., C, 2000, 1, 1–21 CrossRef CAS.
  3. O. Carp, C. Huisman and A. Reller, Prog. Solid State Chem., 2004, 32, 33–177 CrossRef CAS.
  4. D. I. Kondarides, in Catalysis, Encyclopedia of Life Support Systems (EOLSS), UK, 2010 Search PubMed.
  5. M. A. Fox and M. T. Dulay, Chem. Rev., 1993, 93, 341–357 CrossRef CAS.
  6. T. Ohno, K. Sarukawa, K. Tokieda and M. Matsumura, J. Catal., 2001, 203, 82–86 CrossRef CAS.
  7. M. R. Subramaniam, S. Devanathan and D. Kumaresan, RSC Adv., 2014, 4, 36791–36799 RSC.
  8. H. Wang, L. Sun, H. Wang, L. Xin, Q. Wang, Y. Liu and L. Wang, RSC Adv., 2014, 4, 58615–58623 RSC.
  9. M. Salari, S. H. Aboutalebi, A. Aghassi, P. Wagner, A. J. Mozer and G. G. Wallace, Phys. Chem. Chem. Phys., 2015, 17, 5642–5649 RSC.
  10. J. Cass, A. B. Walker and L. M. Peter, J. Phys. Chem. B, 2004, 109, 5100–5107 CrossRef PubMed.
  11. R. Hahn, T. Stergiopoulus, J. M. Macak, D. Tsoukleris, A. G. Kontos, S. P. Albu, D. Kim, A. Ghicov, J. Kunze, P. Falaras and P. Schmuki, Phys. Status Solidi RRL, 2007, 1, 135–137 CrossRef CAS.
  12. D. Gong, C. A. Grimes and O. K. Varghese, J. Mater. Res., 2001, 16, 3331–3334 CrossRef CAS.
  13. J. M. Macak and P. Schmuki, Electrochim. Acta, 2006, 52, 1258–1264 CrossRef CAS.
  14. J. M. Macak, H. Tsuchiya, A. Ghicov, K. Yasuda, R. Hahn, S. Bauer and P. Schmuki, Curr. Opin. Solid State Mater. Sci., 2007, 11, 3–18 CrossRef CAS.
  15. P. Roy, S. Berger and P. Schmuki, Angew. Chem., Int. Ed. Engl., 2011, 50, 2904–2939 CrossRef CAS PubMed.
  16. M. Ye, M. Lv, C. Chen, J. Iocozzia, L. Changjian and Z. Lin, Low-cost Nanomaterials, Springer-Verlag London, 2014 Search PubMed.
  17. E. Panaitescu, C. Richter and L. Menon, J. Electrochem. Soc., 2008, 155, 7–13 CrossRef.
  18. N. F. Fahim, T. Sekino, M. F. Morks and T. Kusunose, J. Nanosci. Nanotechnol., 2009, 9, 1803–1818 CrossRef CAS PubMed.
  19. R. P. Antony, T. Mathews, A. Dasgupta, S. Dash, A. K. Tyagi and B. Raj, J. Solid State Chem., 2011, 184, 624–632 CrossRef CAS.
  20. R. Hahn, J. M. Macak and P. Schmuki, Electrochem. Commun., 2007, 9, 947–952 CrossRef CAS.
  21. R. Hahn, M. Stark, M. S. Killian and P. Schmuki, Catal. Sci. Technol., 2013, 3, 1765–1770 CAS.
  22. K. N. P. Kumar, Scr. Metall. Mater., 1995, 32, 873–877 CrossRef CAS.
  23. D. Eder, I. A. Kinloch and A. H. Windle, Chem. Commun., 2006, 30, 1448–1450 RSC.
  24. P. Kar, Y. Zhang, S. Farsinezhad, A. Mohammadpour, B. Wiltshire, H. Sharma and K. Shankar, Chem. Commun., 2015, 51, 7816–7819 RSC.
  25. R. A. Spurr and H. Myers, Anal. Chem., 1957, 29, 760–762 CrossRef CAS.
  26. Y. Luan, L. Jing, Q. Meng, H. Nan, P. Luan, M. Xie and Y. Feng, J. Phys. Chem. C, 2012, 116, 17094–17100 CAS.
  27. D. Reyes-Coronado, G. Rodríguez-Gattorno, M. E. Espinosa-Pesqueira, C. Cab, R. D. Coss and G. Oskam, Nanotechnology, 2008, 19, 1–10 CrossRef PubMed.
  28. R. B. Zhang and Y. F. Zhang, J. Chem. Res., 2003, 2003, 105–108 CrossRef.
  29. M. Salari, S. H. Aboutalebi, A. T. Chidembo, I. P. Nevirkovets, K. Konstantinov and H. K. Liu, Phys. Chem. Chem. Phys., 2012, 14, 4770–4779 RSC.
  30. L. You-ji and C. Wei, Catal. Sci. Technol., 2011, 1, 802–809 Search PubMed.
  31. A. Gautam, A. Kshirsagar, R. Biswas, S. Banerjee and P. K. Khanna, RSC Adv., 2016, 6, 2746–2759 RSC.
  32. P. Wilhelm and D. Stephan, J. Photochem. Photobiol., A, 2007, 185, 19–25 CrossRef CAS.
  33. J. Y. Li, W. H. Ma, P. X. Lei and J. C. Zhao, J. Environ. Sci., 2007, 19, 892–896 CrossRef CAS.
  34. X. Gao, B. Zhou and R. Yuan, Environ. Eng. Res., 2015, 20, 329–335 CrossRef.
  35. L. L. Lai, W. Wen and J. M. Wu, RSC Adv., 2016, 6, 25511–25518 RSC.

Footnote

Electronic supplementary information (ESI) available. See DOI: 10.1039/c6ra16708j

This journal is © The Royal Society of Chemistry 2016
Click here to see how this site uses Cookies. View our privacy policy here.