Combination of homogenous liquid–liquid extraction and dispersive liquid–liquid microextraction for extraction and preconcentration of amantadine from biological samples followed by its indirect determination by flame atomic absorption spectrometry

S. M. Sorouraddin*, M. A. Farajzadeh, A. Hassanyani and M. R. Afshar Mogaddam
Department of Analytical Chemistry, Faculty of Chemistry, University of Tabriz, Tabriz, Iran. E-mail: ssorureddin@tabrizu.ac.ir; saied_sorour@yahoo.com; Fax: +98 4133334019; Tel: +98 4133393106

Received 27th June 2016 , Accepted 1st November 2016

First published on 8th November 2016


Abstract

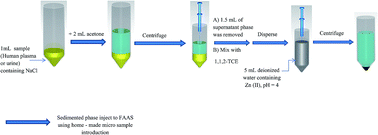
A new and simple procedure has been developed for the indirect determination of amantadine in biological samples. In this paper, a homogenous liquid–liquid extraction method followed by a dispersive liquid–liquid microextraction method has been developed for the extraction and preconcentration of amantadine from samples and its determination was performed by flame atomic absorption spectrometry. Initially, to human plasma or urine, sodium chloride and acetone were added. After manual shaking, the mixture was centrifuged and a two-phase system was formed: an upper phase of acetone containing amantadine and a lower phase containing soluble compounds in water and the precipitated proteins. The upper phase was removed, mixed with 1,1,2-trichloroethane as an extraction solvent at a microliter level and rapidly injected by a syringe into an aqueous solution containing Zn(II) with a pH of 4 placed into a test tube with a conical bottom. In this process, an amantadine–Zn complex was formed and extracted into fine droplets of the extraction solvent. After centrifugation, the fine droplets of the extractant containing the complex were sedimented in the bottom of the tube. The sedimented phase was injected to the detection system via a home-made sample introduction system. Under the optimal conditions, the linear ranges were between 3–400 ng mL−1. The limits of detection of the target analyte were obtained as 1.8 and 1.1 ng mL−1 in human plasma and urine, respectively.

1. Introduction

Amantadine (1-adamantylamine, Am) is a primary amine with an aliphatic tricyclic moiety and is an agent against influenza and is widely used for the treatment of respiratory illness caused by influenza A virus strains in adults.1–5 It can also reduce symptoms of Parkinson's disease and drug-induced extrapyramidal syndromes,6 so it is clinically used for the treatment of Parkinsonism, herpes zoster, multiple sclerosis, and hepatitis C.7–12 It has antimuscarinic activity and influences the dopamine release and reuptake balance, which cause it to reduce the symptoms of multiple sclerosis and Parkinsonism. However, the widespread use of Am has resulted in the rapid emergence of drug-resistant variants.13,14 Drug resistance will affect the effectiveness of human optional drugs against the influenza virus and may significantly enhance the risk of cross infection between animals and humans. Also, high dose Am treatment caused serious adverse events like myocardial infarction and a suicide attempt; others included impotence, confusion, alopecia, and hoarseness.12 Drug interactions and side effects should be dependent on the serum Am concentration. Assessment of these effects and testing the patient's compliance requires a reliable analysis. Therefore, the determination of Am in biological materials is of interest.

The analytical methods reported for Am are: high-performance liquid chromatography (HPLC),15–17 gas chromatography (GC),18–20 capillary electrophoresis,21 potentiometry,22 fluorimetry,23 and spectrophotometric methods.24–26 Despite remarkable improvements in the equipment used for the separation and analysis of chemical compounds, sample preparation remains a very important step in the development of the analytical methods. To achieve the necessary levels of sensitivity, enrichment and cleanup steps, some sample preparation procedures are needed before the analysis of the analytes. Current analytical methods of Am suffer from various problems, including hazardous solvents (often 2 or 3 extraction and re-extraction cycles, and/or a derivatization), emulsion formation, and lack of accuracy and precision.18,20,23–26 Therefore, current interest of the analysts is focused on the techniques that are environmentally friendly and reduce cost of analyses by reducing toxic organic solvents consumption. Hence, microextraction methods have attracted much attention. Most developed miniaturized extraction procedures have been introduced with success, which could be grouped in the so-called liquid phase microextraction (LPME) techniques. LPME has been carried out under different extraction modes, which can be classified into three main categories: single-drop microextraction (SDME),27 hollow fiber-LPME (HF-LPME),28 and dispersive liquid–liquid microextraction (DLLME).29–31 DLLME was introduced in 2006 by Assadi et al.32 It is generally based on a ternary component solvent system, in which a non-polar water immiscible solvent (extraction solvent) and a polar water miscible solvent (disperser solvent) are rapidly injected into the aqueous sample to form a cloudy solution. After centrifugation the fine droplets of the extracting solvent containing the target analytes are separated from the aqueous phase. An extraction equilibrium is quickly achieved due to the extensive surface contact between the droplets of the extraction solvent and the sample. High extraction recoveries can be reached and the extraction time can be very short.

In literature, indirect methodologies by atomic absorption spectrometry (AAS) were proposed as the developed methods to determine non-metallic elements and organic species,33–38 since atomic absorption spectrophotometer especially the flame one is available in many research laboratories because of its relatively simple and inexpensive equipment and running cost. In this study, a flame-AAS (FAAS) indirect methodology was proposed to determine Am in biological samples based on complexation reaction between Am and a metallic cation. The signal of the cation in the FAAS is proportional to the Am concentration in the sample. This sample preparation method consists of two steps: (i) extraction of Am from the samples (plasma and urine) by homogenous liquid–liquid extraction (HLLE) and (ii) performing DLLME in the presence of the cation, for the enrichment of the analyte. For this purpose, in the first step, Am is extracted into acetone in the presence of a salt (salt induced HLLE), which is used as a disperser in DLLME in the second step. The factors which affect the extraction of Am from the sample and DLLME step are investigated and the optimal conditions are selected.

2. Experimental

2.1. Chemicals and reagents

Amantadine hydrochloride was obtained from Amin Pharmaceutical Company (Isfahan, Iran). Analytical grade methanol, ethanol, acetone, and acetonitrile (as extraction/disperser solvents), carbon tetrachloride, 1,1,2,2-tetrachloroethane (1,1,2,2-TCE), 1,2-dibromoethane (1,2-DBE), 1,1,2-trichloroethane (1,1,2-TCE), and chloroform (as extraction solvents in DLLME step), hydrochloric acid, and sodium hydroxide were obtained from Merck (Darmstadt, Germany). A stock solution of Am (100 mg L−1) was prepared in methanol and stored in a refrigerator at 4 °C. Working solutions were prepared daily by appropriate dilutions of the stock solution with deionized water (Ghazi Company, Tabriz, Iran). A stock standard solution of Zn(II) with a concentration of 100 mg L−1 was prepared from analytical reagent grade ZnSO4·7H2O (Merck, Darmstadt, Germany) in deionized water. Sodium phosphate monobasic (NaH2PO4), sodium phosphate dibasic (Na2HPO4), ammonium chloride, and ammonia were also purchased from Merck.

2.2. Apparatus

A Shimadzu AA-6800 (Japan) flame atomic absorption spectrometer equipped with a 100 mm burner head, deuterium background correction, and an air-acetylene flame was used. A Zn hollow-cathode lamp (Hamamatsu Photonics, Shizuoka, Japan) was used as a radiation source operated at 20 mA with a monochromator spectral band pass of 0.7 nm. The detection wavelength was set at 307.6 nm (resonance line of zinc). The acetylene and air flow rates were 2.3 and 15.0 L min−1, respectively. A Hettich centrifuge (model ROTOFIX 32A, Germany) was used to accelerate the phase separation. The pH values were measured with a Metrohm pH-meter (Model: 691, Herisau, Switzerland) equipped with a glass-combined electrode. Two stainless steel tubes (o.d. 1.15 and 0.9 mm) were used in the home-made injection system. They were obtained from the Iran Needle Corporation (Tehran, Iran).

2.3. Samples

2.3.1. Plasma. Drug-free human plasma samples were obtained from the Iranian Blood Transfusion Organization (Tabriz, Iran) and kept frozen at −20 °C until analysis. Also two plasma samples taken from two healthy male volunteers ingested a tablet containing 100 mg of Am twice in a day (12 h interval) were used. Blood was taken 12 h after the last administration of Am and used as positive samples.
2.3.2. Urine. Blank urine sample was collected from a healthy male adult who had not taken Am. Also urine samples were obtained from the two volunteers mentioned in the previous section. The urine samples were collected within 24 h from the first oral administration.
2.3.3. Live subject statement. All experiments were performed in compliance with the relevant laws and institutional guidelines, and ethics committee of Tabriz University of Medical Science (Tabriz, Iran) has approved the experiments. The informed consents were obtained for any experimentation with human subjects. The human samples were kindly donated by the Iranian Blood Transfusion Organization (Tabriz, Iran).

2.4. Design of microsample introduction system

A volume of 1–2 mL of sample solution is generally needed for FAAS determinations. In the case of small sample volumes, as a result of high dilution, the concentration of analyte to be measured may be less than the detection limit of the apparatus. To surmount this problem, it is possible to determine the analytes by FAAS in a microliter sample volume (less than 100 μL) without dilution. For this purpose, a home-made micro sample introduction system was constructed from two stainless steel tubes with different dimensions. The first tube had a length of 4 cm and o.d. of 1.15 mm. The second one had 6 cm length and 0.9 mm o.d. The longer and thinner tube was coaxially inserted into the shorter and thicker tube. Their upper ends were placed in a horizontal equal level, while 2 cm of the second tube was located at the lower level. Then they were interconnected, so that the air could be moved from the space between the tubes (Fig. 1). The designed system was mounted at the end of the nebulizer system of FAAS. In the injection step, only the inner (longer) tube was immersed into the solution (sedimented phase). Therefore, the mixture of the sample (via inner tube) and air (from the space between the tubes) were sucked, so leading to a much less required sample volume. The preliminary experiments showed that 80 μL of sample is quite enough to obtain signals.
image file: c6ra16572a-f1.tif
Fig. 1 Schematic diagram of the home-made microsample introduction system: two stainless steel tubes were used: (I) 4 cm length and 1.15 mm o.d., and (II) 6 cm length and 0.9 mm o.d.; (A) external view, and (B) internal view.

2.5. Extraction procedure

To precipitate the proteins (in the case of plasma) and extraction of the analyte during HLLE step, 1 mL of the plasma (or urine) sample containing 50 ng mL−1 of Am was mixed with 0.2 g NaCl and 2 mL acetone. The mixture was manually shaken for 3 min and centrifuged at 5000 rpm for 8 min. Then, the resultant supernatant mainly acetone (1.5 mL) was removed and mixed with 91 μL of 1,1,2-TCE (as an extraction solvent). The solution was rapidly injected (by a 2 mL glass syringe) into 5 mL deionized water (pH adjusted at 4) containing 500 ng mL−1 Zn2+ and 6%, w/v, NaCl placed into a 10 mL glass tube with conical bottom. The cloudy solution was centrifuged for 4 min at 5000 rpm. A volume of 80 ± 2 μL of 1,1,2-TCE was settled down at the bottom of the tube and it was injected directly into the FAAS via the home-made microsample introduction system.

3. Results and discussion

The studied analyte (Am) does not strongly adsorb radiation at ultraviolet (UV) or visible wavelengths, therefore, its determination with spectrophotometric or HPLC-UV methods are rather impossible at μg L−1 level (concentration of Am in biological fluids such as plasma). Also, it is a primary amine which shows a tailing peak in GC, so a derivatization step is used before its detection to improve limit of detection (LOD). A preconcentration step is also needed due to the low concentration of Am in plasma or urine samples. In this study, the combination of microextraction and indirect determination by FAAS technique is used to overcome the above mentioned problems. In this study, initially Am is extracted from the human plasma or urine samples using an organic solvent (during an HLLE step) which acts as an extractant for the analyte and a co-precipitant for proteins (in the case of plasma) in the first step and also as a disperser in the second step (DLLME). In order to select the optimum conditions for the determination of the analyte with this method, it is required to optimize the different parameters that affect the extraction of Am from the samples. Some of these parameters are as follows: selection of a suitable extraction solvent during the HLLE for the extraction of the analyte from the samples (also disperser solvent for the following DLLME step), the volume of the extraction solvent in the first step, the amount of salt to induce phase separation in HLLE, type and volume of the extraction solvent in DLLME step, type and concentration of the cation to form a complex with Am, pH, salting out effect, and centrifugation conditions. It is important to optimize these parameters in order to obtain good performance and to improve analytical signals. They were optimized and discussed in details in the following sections. The optimization was performed using a human plasma sample (analyte-free) spiked with a 50 ng mL−1 of Am.

3.1. Optimization of parameters in the extraction of Am from human plasma sample

3.1.1. Selection of extraction solvent. In this step, the selected extraction solvent will be used as a disperser solvent in the following DLLME procedure. Therefore, the choice of appropriate extraction solvent is very important. The requirements for the selection of this solvent are: (i) its capability for the extraction of Am from plasma sample along with precipitation of proteins of the plasma, and (ii) its miscibility with aqueous phase and extraction solvent used in the following DLLME step. Also it should form a two phase system with water upon adding a salt. For this purpose, 2 mL of five solvents including acetone, acetonitrile, ethanol, and methanol along with 0.5 g NaCl were tested. In the presence of methanol and ethanol, two phase systems were not formed. According to the results, acetone has the highest analytical signal among the tested solvents. It is mentioned that acetone as a dispersive solvent in DLLME step formed a cloudy state with very fine droplets, which could be leading to high extraction efficiency.
3.1.2. Optimization of extraction solvent volume. The extraction solvent volume is another important factor that affects extraction efficiency. As mentioned above, the extraction solvent used in the first step should be acted as a dispersive solvent in the second step. Therefore, at low disperser volumes, the organic extractant droplets cannot be formed properly in DLLME step which leads to low extraction efficiency. Meanwhile, at high volumes of the disperser, the solubility of Am–cation complex and extraction solvent into the aqueous phase will increase which leads to a decreased extraction efficiency. In order to optimize the volume of acetone, different volumes of acetone in the range of 1–3 mL (at 0.25 mL intervals) were used. The obtained results showed that initially the analytical signal increases up to 2.00 mL and then decreases. At low volumes, acetone could not extract Am efficiently during HLLE step and also did not disperse completely in the following DLLME step. So the cloudy state was not formed well, which led to low extraction efficiency. At high volumes, the extraction efficiency was reduced, as a consequence of increasing the solubility of Am–cation complex into the aqueous solution. Therefore 2.00 mL was selected as the optimum volume of acetone in the further experiments, because the obtained analytical signal was high and the repeatability was good. It is mentioned that by using 2.00 mL acetone, the volume of supernatant phase was 1.5 ± 0.1 mL.
3.1.3. Optimization of salt amount. Adding a salt to the aqueous solution can reduce the amount of water available to dissolved analyte molecules due to formation of hydration spheres around the ions resulted from dissolution of the salt molecules. Therefore, to study the effect of this parameter on the extraction efficiency of Am from human plasma, different amounts of sodium chloride including 0.1, 0.2, 0.4, 0.6, 0.8, and 1 g were added to 1 mL plasma sample and extraction efficiency was investigated by the proposed method. In this study, addition of NaCl, increases extraction of the analyte from the plasma into the extractant solvent up to 0.2 g and then the analytical signals decreased by more increasing of NaCl. Regarding the absorbance increasing with the increasing of NaCl concentration, the salting-out effect is thought to be responsible, which is commonly occurred in the extraction process involving hydrophobic interactions. Therefore, 0.2 g NaCl was used in the further studies.

3.2. Optimization of parameters in DLLME step

3.2.1. Investigating the nature and concentration of cation. In order to select the suitable cation to form a complex with Am in DLLME procedure, the preconcentration and extraction of the analyte was investigated in the presence of different cations including Cu(II), Zn(II), Cd(II), Co(II), Fe(III), and Ni(II). The absorbances, as indicator of the extraction efficiency of the analyte, versus nature of cation are shown in Fig. 2. The results reveal that Zn(II) can be chosen as the optimum cation in extraction of Am. It is noted that two parameters can be affected the analytical signals in this study by using different cations. The first one is the stability of the complexes formed between the studied cations and Am and their extractability into the extraction solvent. The second one is the absorbance of the cations in FAAS at a constant concentration of the studied cations. In the following, to optimize the concentration of the cation, the various samples containing 50 ng mL−1 of Am and different concentrations of Zn(II) (20–800 ng mL−1) were prepared. The extraction efficiency of the analyte in each solution shows that extraction efficiency increased till 50 ng mL−1 and then it was constant. To construct calibration graphs, quantitative analysis of various samples containing different concentrations of Am, and to compensate the zinc content of the plasma, 500 ng mL−1 was selected as the optimum concentration of the cation in the next steps. It is noted that the concentration of zinc in human plasma is in the range of 1.2–1.6 ng mL−1,39 which is very less than the added concentration of zinc ions.
image file: c6ra16572a-f2.tif
Fig. 2 Effect of the chemical identity of cation in the extraction of Am. Extraction conditions in HLLE: human plasma volume, 1 mL, NaCl in plasma, 0.2 g, spiked with the analyte at a concentration of 50 ng mL−1; and extraction/dispersive solvent volume, 2 mL; conditions in DLLME: pH, 5; cation, Zn2+: 50 ng mL−1; salt, 0.5 g NaCl; centrifuge rate and time, 5000 rpm and 5 min; and extraction solvent, 1,2-DBE (110 μL). The error bars indicate the minimum and maximum of three independent determinations.
3.2.2. Study the nature of the extraction solvent. The selection of an appropriate extraction solvent in DLLME step is of great importance for the optimization of the proposed procedure. The extraction solvent has to fulfill some requirements: heavier or lighter than water, low volatility, low solubility in water, and high extraction efficiency towards the Am–Zn complex. For this purpose, several extracting solvents including chloroform, carbon tetrachloride, 1,2-DBE, 1,1,2-TCE, and 1,1,2,2-TCE were investigated. To obtain a constant volume ratio of aqueous phase to organic phase the volume of sedimented phase was selected the same (80 ± 2 μL). For this purpose different volumes of the selected extraction solvents were used (130, 116, 110, 104, and 124 μL for chloroform, carbon tetrachloride, 1,2-DBE, 1,1,2-TCE, and 1,1,2,2-TCE, respectively). Initial volumes of the tested solvents were different because their solubilities in water are not the same. In order to select the optimum extraction solvent, the mentioned volumes of the solvents were added to 1.5 mL acetone containing the analyte (organic phase obtained from the previous HLLE step). The obtained solutions were rapidly injected into 5 mL deionized water solutions containing 500 ng mL−1 of Zn(II) ion, and cloudy solutions were formed. The settled phases after centrifuging were injected into the FAAS system using the home-made microsample introduction system. The results (Fig. 3) show that 1,1,2-TCE is the most effective extraction solvent and gives the highest extraction efficiency for the Am–Zn complex among the five solvents investigated. Also, the consumption volume of 1,1,2-TCE compared to the other solvents is low. Therefore, it was selected as the extraction solvent for the further experiments.
image file: c6ra16572a-f3.tif
Fig. 3 Effect of the chemical identity of extraction solvent in DLLME step in the extraction of Am. Extraction conditions: extraction solvent (volume); chloroform (130 μL), carbon tetrachloride (116 μL), 1,2-DBE (110 μL), 1,1,2-TCE (104 μL), and 1,1,2,2-TCE (124 μL). The other conditions are the same as used in Fig. 2, except Zn2+: 500 ng mL−1 was used. The error bars indicate the minimum and maximum of three independent determinations.
3.2.3. Optimization of extraction solvent volume. The volume of 1,1,2-TCE is another important factor that affects the extraction efficiency. Increasing the extraction solvent volume would increase the extracted amount of Am–Zn, whereas its concentration in the sedimented phase will be diluted. To evaluate the effect of extraction solvent volume, different volumes of 1,1,2-TCE (104–125 μL) were dissolved in 1.5 mL of the organic phase obtained from HLLE step and then were subjected to exactly the same DLLME procedures. By increasing the volume of the extraction solvent volume from 104 to 125 μL, the volume of the sedimented phase increased from 80 to 100 μL. The results indicated that the absorbance decreased by increasing 1,1,2-TCE volume. To summarize, it could be stated that dilution of the settled phase reduced the absorbance. In the cases of using less than 104 μL of 1,1,2-TCE, the volumes of the sedimented phase were low, and consequently, their injection into the detection system were impossible. Therefore, 104 μL was chosen as the optimum volume of the 1,1,2-TCE.
3.2.4. Effect of pH. The most important factor with respect to the Am–Zn complex formation and hence its extraction efficiency is the acidity of the aqueous solution. The effect of the solution pH on the formation of Am–Zn complex and extraction of the complex was investigated within the pH range of 2–12. The obtained results show that, the absorbance increases up to pH 4 and then decreases. It is noticed that at high pHs, the zinc cations start to precipitate. On the other hand, at a highly acidic solution such as pH 2, protonation of Am is the main factor in reducing the complex formation and hence the reduced analytical signal is obtained. Therefore, the better extraction efficiency would be obtained at pH 4. To facilitate the pH adjustment, an acetate buffer (C = 0.05 M, pH = 4) was used instead of HCl or NaOH solution. The obtained results in both cases were similar.
3.2.5. Effect of ionic strength. Salting-out effect has been commonly used for the enhancement of extraction efficiency. Generally, salt addition can decrease the solubility of analytes in aqueous phase (and can also reduce the solubility of organic solvents in water) while enhancing their partitioning into the organic phase. Salting-out effect on the performance of DLLME step was evaluated by adding sodium chloride into aqueous phase in the range of 0–15% (w/v). In order to obtain a constant volume ratio of aqueous phase to organic phase, the experiments were performed using different volumes of 1,1,2-TCE (104, 102, 99, 95, 91, 88, 84, and 76 μL for 0, 1, 2, 4, 6, 8, 10, and 15%, w/v, NaCl, respectively) to achieve 80 μL of the sedimented organic phase volume after DLLME. The results indicate that absorbance increases up to 6% (w/v) NaCl and after that decreases. Decreasing analytical signal at >6%, w/v, NaCl, may be because of increasing the viscosity of aqueous phase by adding NaCl which leads to decrease in diffusion coefficients of the Am–Zn complex. Therefore, 6% (w/v) NaCl was selected for further experiments.
3.2.6. Optimization of centrifuge conditions. Other parameters that may affect the extraction efficiency of Am–Zn complex are centrifuging rate and time. They were studied in the ranges of 2000–8000 rpm and 2–8 min, respectively. The obtained results showed that these parameters were less effective at high centrifuging rate and time. So, 5000 rpm and 4 min were selected as centrifuge rate and time, respectively.
3.2.7. Constituent of Am–Zn complex. The constituent of the Am–Zn complex was determined by Job's method.40 The results of applying this method can be summarized as follows: the Am–Zn ratio was found to be 1[thin space (1/6-em)]:[thin space (1/6-em)]1.
3.2.8. Study of interferences. Selectivity of the developed method was evaluated by analysis of 12 plasma samples (analyte-free) obtained from different healthy volunteers and the method was performed on them. The obtained results were compared with the results of de-ionized water and no significant differences were observed. Therefore the method can be considered as a selective method for the analyte. Also, to investigate the specificity of the proposed method, the analytical signal was investigated in the presence of various amounts of the other drugs that might be prescribed with the studied drug. In these experiments, 1 mL of plasma sample containing 50 ng mL−1 of Am and various concentrations of some drugs (pramipexole, levodopa, carbidopa, and biperiden) were treated according to the recommended procedure. The given species were considered to interfere if they resulted in a ±5% variation in the obtained signal. The tolerable concentration ratios of the selected drugs to the Am were found to be more than 50[thin space (1/6-em)]:[thin space (1/6-em)]1.

3.3. Analytical approach

To determine the efficiency of the proposed method in analysis of Am in various samples, analytical characteristics of the optimized method in terms of linear range (LR), LOD, limit of quantification (LOQ), and repeatability, expressed as relative standard deviation (RSD), were investigated in two matrices (human plasma and urine). The results are summarized in Table 1. Good linearities were observed in broad concentration ranges with a coefficient of determination of >0.993 for calibration curves (n = 11). In order to obtain the precision of the method, plasma and urine samples were spiked with 30 ng mL−1 of the target analyte and they were analyzed repetitively (n = 6) according to the proposed method. The obtained RSDs were shown in Table 1.
Table 1 Analytical features of the proposed method in determination of Am
Matrix Calibration curve equation LRa (ng mL−1) R2b LODc (ng mL−1) LOQd (ng mL−1) RSDe (%)
Intra-day Inter-days
a Linear range.b Coefficient of determination.c Limit of detection, S/N = 3.d Limit of quantification, S/N = 10.e Relative standard deviation (C = 30 ng L−1, n = 6) for intra-day and (C = 30 ng L−1, n = 4) for inter-days.
Human plasma A = 1.73 × 10⁻³C + 2.11 × 10⁻⁴ 5.0–400.0 0.993 1.8 5.0 3.3 4.8
Human urine A = 2.47 × 10⁻³C + 1.15 × 10⁻⁴ 3.0–400.0 0.996 1.1 2.5 4.1 5.5


It was found that RSD values were ≤5.5% for inter-day and intra-day precisions which indicated acceptable repeatability of the developed technique. The limit of detections, defined as LOD = 3SB/m (where SB and m are the standard deviation of the blank and the slope of the calibration graph, respectively), were 1.8 and 1.1 ng mL−1 in plasma and urine, respectively. The LOQs (calculated from 10SB/m) were 5.0 and 2.5 ng mL−1 for these samples which indicate that the proposed method is enough sensitive to determine the analyte in biological samples.

3.4. Real sample analysis

The ability of the proposed method was tested by analyzing plasma and urine samples of 27 and 28 years old male volunteers after oral administration of Am (100 mg, twice in a day). The obtained concentrations of Am in plasma samples of the volunteers were 181.2 ± 5.9 and 161.8 ± 5.2 ng mL−1, respectively. Also the obtained concentrations of Am in urine samples of the volunteers were 61.4 ± 2.4 and 80.4 ± 3.4 ng mL−1, respectively. In each samples three determinations (n = 3) were performed. Also, the plasma and urine samples of the volunteers were spiked with the Am at three concentration levels to evaluate the matrices effect. Levels of Am as well as recovery data in the plasma and urine samples are summarized in Table 2. Good recoveries in the range of 78–94% show that the samples have relatively low matrix effect. Also these samples were analyzed with previously published DLLME-gas chromatography flame ionization detection (GC-FID) method19 and the results were compared with those obtained by statistical analysis with respect to the accuracy (t-test) and precision (F-test). These results showed that there are no significant differences between the two compared methods. The proposed procedure is sensitive so that drug content of plasma and urine is still detectable even after 24 h. Hence, this method can be used for the clinical testing and pharmacokinetic studies.
Table 2 The obtained concentration of amantadine in the spiked and unspiked real samples for plasma and urine of two positive cases and comparison of them with DLLME-GC-FID method
Subject Sample Added (ng mL−1) Founda (ng mL−1)
This method DLLME-GC-FID t-Staticb
a Mean of three determinations ± standard deviation.b t-Critical = 2.23 for n = 4, P = 0.05.
27 years old Plasma 0 181.3 ± 5.8 183.2 ± 4.3 0.09
25 200.9 ± 6.8 204.5 ± 4.2 0.18
50 221.5 ± 7.1 226.2 ± 3.8 0.21
100 272.6 ± 8.4 278.4 ± 5.2 0.14
Urine 0 61.4 ± 2.5 63.2 ± 3.1 0.22
25 81.2 ± 3.5 82.3 ± 2.4 0.15
50 102.5 ± 4.3 105.2 ± 3.2 0.28
100 155.5 ± 6.3 158.4 ± 4.3 0.12
28 years old Plasma 0 161.7 ± 5.2 161.5 ± 2.6 0.01
25 181.5 ± 8.2 184.6 ± 4.3 0.09
50 203.5 ± 8.3 204.6 ± 4.1 0.03
100 255.7 ± 10.5 253.7 ± 3.8 0.04
Urine 0 80.1 ± 3.2 79.3 ± 3.3 0.01
25 99.8 ± 4.3 99.1 ± 2.7 0.06
50 124.5 ± 5.1 127.1 ± 4.6 0.13
100 173.7 ± 7.4 175.3 ± 3.6 0.05


3.5. Comparison of the proposed method with other methods

Table 3 shows a comparison of the proposed HLLE-DLLME-FAAS methodology with other preconcentration and determination methods for the determination of Am in different samples. Most of the preconcentration methods listed are rather laborious and require the use of large amounts of organic solvents, which are flammable, volatile and toxic. The analytical characteristics of the proposed method are better than or comparable with those of the other proposed methods.
Table 3 Comparison of the proposed method with other methods used in preconcentration and determination of Am
Sample Method LRa (ng mL−1) R2b LODc (ng mL−1) LOQd (ng mL−1) RSDe (%) Ref.
a Linear range.b Coefficient of determination.c Limit of detection.d Limit of quantification.e Relative standard deviation.f Hollow fiber-liquid–liquid–liquid microextraction-corona discharge-ion mobility spectrometry.g Liquid–liquid extraction-micellar electrokinetic chromatography-laser-induced fluorescence detection.h Liquid–liquid extraction-gas chromatography-electron capture detection.i Solid phase extraction-high performance liquid chromatography-fluorescence detector.j Liquid–liquid extraction-liquid chromatography-mass spectrometry.k Liquid–liquid extraction-high performance liquid chromatography-ultraviolet detection.l Dispersive liquid–liquid microextraction-gas chromatography-flame ionization detection.m Liquid chromatography-tandem mass spectrometry.n Homogeneous liquid–liquid extraction-dispersive liquid–liquid microextraction-flame atomic absorption spectrometry.
Human plasma HF-LLLME-CD-IMSf 20–1000 0.990 7.2 5.8 41
Human urine 5–250 0.990 1.6 7.6
Human plasma LLE-MEKC-LIFg 2.0–60 0.999 0.5 2 1.6 42
Human plasma LLE-GC-ECDh 2.4–201.4 2.3 6.2 20
Honey SPE-HPLC-FLDi 25–1000 0.998 8 25 3.4 43
Human plasma LLE-LC-MSj 3.9–1000 0.9979 1.17 3.9 8.43 1
Rat plasma LLE-HPLC-UVk 50–5000 20 50 5.5 2
Human plasma DLLME-GC-FIDl 14–50[thin space (1/6-em)]000 0.990 4.2 14 5.1 19
Human urine 8.7–5000 0.991 2.7 4.7 4.6
Human serum LC-MS-MSm 0.02–5 0.02 6 7
Tabellae urine Fluorescent probe 4.0–900.0 0.9995 1.2 1.00 44
Capsules Spectrofluorimetry 50–1200 0.9996 21 62 1.58 23
Human plasma HLLE-DLLME-FAASn 5–400 0.993 1.8 5 3.3 This work
Human urine 3–400 0.996 1.1 2 4.1


4. Conclusion

In this study, a new analytical method based on combination of HLLE-DLLME methods followed by indirect FAAS determination has been developed for the extraction, enrichment, and determination of the Am from complex matrices such as plasma and urine. The extraction of Am and elimination of proteins were performed in one stage by acetone, which acts as a disperser in the following preconcentration step. The results indicated that the proposed method has some advantages with respect to extraction time, organic solvent consumption, simplicity, and extraction efficiency. Comparison of the presented method with other methods shows that it is simple, rapid, and inexpensive. Finally, the method was successfully applied for the determination of Am at ng mL−1 level in positive human plasma and urine samples.

Abbreviations

AmAmantadine
DLLMEDispersive liquid–liquid microextraction
FAASFlame atomic absorption spectrometry
HLLEHomogeneous liquid–liquid extraction
LODLimit of detection
LOQLimit of quantification
RSDRelative standard deviation
1,1,2-TCE1,1,2-Trichloroethane

Acknowledgements

The authors thank the Research Council of University of Tabriz for financial support.

References

  1. W. Ping, L. Yi-Zeng, C. Ben-Mei, Z. Neng, Y. Lun-Zhao, Y. Yan and Y. Zhi-Biao, J. Pharm. Biomed. Anal., 2007, 43, 1519–1525 CrossRef PubMed.
  2. C. Shuangjin, F. Fang, L. Hana and M. Ming, J. Pharm. Biomed. Anal., 2007, 44, 1100–1105 CrossRef PubMed.
  3. Y. Hsin-Hua, Y. Yuan-Han and C. Su-Hwei, Electrophoresis, 2010, 31, 1903–1911 CrossRef PubMed.
  4. T. Azuma, N. Nakada, N. Yamashita and H. Tanaka, Chemosphere, 2013, 93, 1672–1677 CrossRef CAS PubMed.
  5. X. F. Wan, M. Carrel, L. P. Long, A. P. Alker and M. Emch, Infect., Genet. Evol., 2013, 20, 298–303 CrossRef PubMed.
  6. J. H. Kim, H. W. Lee, J. Hwang, J. Kim, M. J. Lee, H. S. Han, W. H. Lee and K. Suk, Neurobiol. Aging, 2012, 33, 2145–2159 CrossRef CAS PubMed.
  7. T. Arndt, B. Guessregen, A. Hohl and J. Reis, Clin. Chim. Acta, 2005, 359, 125–131 CrossRef CAS PubMed.
  8. P. J. Blanchet, L. V. Metman and T. N. Chase, Adv. Neurol., 2003, 91, 251–257 CAS.
  9. J. Romrell, H. H. Fernandez and M. S. Okun, Expert Opin. Pharmacother., 2003, 4, 1747–1761 CrossRef CAS PubMed.
  10. P. Branas, R. Jordan, A. Fry-Smith, A. Burls and C. Hyde, Health Tech. Assess., 2000, 4, 1–61 CAS.
  11. J. S. Goff, R. M. Reveille and J. Johnson, Dig. Dis. Sci., 2000, 45, 1389–1391 CrossRef CAS PubMed.
  12. J. P. Smith, T. R. Riley 3rd, S. Bingaman and D. T. Mauger, Am. J. Gastroenterol., 2004, 99, 1099–1104 CrossRef CAS PubMed.
  13. F. G. Hayden and M. D. De Jong, J. Infect. Dis., 2003, 203, 6–10 CrossRef PubMed.
  14. K. Thorlund, T. Awad, G. Boivin and L. Thabane, BMC Infect. Dis., 2011, 11, 134–142 CrossRef CAS PubMed.
  15. F. A. Van der Horst, J. Teeuwsen, J. J. Holthuis and U. A. Brinkman, J. Pharm. Biomed. Anal., 1990, 8, 799–804 CrossRef CAS PubMed.
  16. H. Yoshida, R. Nakao, T. Matsuo, H. Nohta and M. Yamaguchi, J. Chromatogr. A, 2001, 907, 39–46 CrossRef CAS PubMed.
  17. H. Fujino, I. Ueno and S. Goya, Yakugaku Zasshi, 1993, 113, 391–395 CAS.
  18. P. Biandrate, G. Tognoni, G. Belvedere, A. Frigerio, M. Rizzo and P. L. Morselli, J. Chromatogr., 1972, 74, 31–34 CrossRef CAS PubMed.
  19. M. A. Farajzadeh, N. Nouri and A. A. Alizadeh Nabil, J. Chromatogr. B: Anal. Technol. Biomed. Life Sci., 2013, 940, 142–149 CrossRef CAS PubMed.
  20. D. Rakestraw, J. Pharm. Biomed. Anal., 1993, 11, 699–703 CrossRef CAS PubMed.
  21. N. Reichova, J. Pazourek, P. Polaskova and J. Havel, Electrophoresis, 2002, 23, 259–262 CrossRef CAS PubMed.
  22. N. T. Abdel-Ghani, A. F. Shoukry and S. H. Hussein, J. Pharm. Biomed. Anal., 2002, 30, 601–611 CrossRef CAS PubMed.
  23. I. A. Darwish, A. S. Khedr, H. F. Askal and R. M. Mahmoud, Il Farmaco, 2005, 60, 555–562 CrossRef CAS PubMed.
  24. J. Zhang and X. S. Zhang, Guangpuxue Yu Guangpu Fenxi, 2002, 22, 665–666 CAS.
  25. M. Sultan, Curr. Top. Anal. Chem., 2004, 4, 103–109 CAS.
  26. M. S. Rizk and M. Sultan, Microchim. Acta, 2003, 143, 281–285 CrossRef CAS.
  27. M. A. Jeannot, A. Przyjazny and J. M. Kokosa, J. Chromatogr. A, 2010, 1217, 2326–2336 CrossRef CAS PubMed.
  28. J. Lee, H. K. Lee, K. E. Rasmussen and S. Pedersen-Bjergaard, Anal. Chim. Acta, 2008, 624, 253–268 CrossRef CAS PubMed.
  29. M. Rezaee, Y. Yamini and M. Faraji, J. Chromatogr. A, 2010, 1217, 2342–2357 CrossRef CAS PubMed.
  30. A. N. Anthemidis and K. I. G. Ioannou, Talanta, 2009, 80, 413–421 CrossRef CAS PubMed.
  31. C. B. Ojeda and F. S. Rojas, Chromatographia, 2009, 69, 1–11 Search PubMed.
  32. S. Berijani, Y. Assadi, M. Anbia, M. R. MilaniHosseini and E. Aghaee, J. Chromatogr. A, 2006, 1123, 1–9 CrossRef CAS PubMed.
  33. P. Bermejo-Barrera, R. M. Anllo-Sendin, M. Aboal-Somoza and A. Bermejo-Barrera, Microchim. Acta, 1999, 131, 145–151 CrossRef CAS.
  34. P. Bermejo-Barrera, M. Aboal-Somoza, A. Bermejo-Barrera, M. L. Cervera and M. dela Guardia, J. Anal. At. Spectrom., 2001, 16, 382–389 RSC.
  35. M. C. Yebra and R. M. Cespón, Fresenius. J. Anal. Chem., 2000, 367, 24–28 CrossRef CAS PubMed.
  36. P. Bermejo-Barrera, L. M. Fernandez-Sanchez, M. Aboal-Somoza, R. M. Anllo-Sendin and A. Bermejo-Barrera, Microchem. J., 2001, 69, 205–211 CrossRef CAS.
  37. M. C. Yebra and R. M. Cespón, Anal. Chim. Acta, 2000, 405, 191–196 CrossRef CAS.
  38. M. C. Yebra, Trends Anal. Chem., 2000, 19, 629–641 CrossRef CAS.
  39. D. L. Bloxam, J. C. Tan and C. E. Parkinson, Clin. Chim. Acta, 1984, 144, 81–93 CrossRef CAS.
  40. W. C. Vosburgh and G. R. Cooper, J. Am. Chem. Soc., 1941, 63, 437–442 CrossRef CAS.
  41. M. Saraji, T. Khayamian, S. Mirmahdieh and A. A. Hajialiakbari Bidgoli, J. Chromatogr. B: Anal. Technol. Biomed. Life Sci., 2011, 879, 3065–3070 CrossRef CAS PubMed.
  42. H. H. Yeh, Y. H. Yang and S. H. Chen, Electrophoresis, 2010, 31, 1903–1911 CrossRef CAS PubMed.
  43. J. Zhang, J. Zhao, J. Zhou, X. Xue, Y. Li, L. Wu and C. Fang, Chin. J. Chem., 2011, 29, 1764–1768 CrossRef CAS.
  44. G. Q. Wang, Y. F. Qin, L. M. Du, J. F. Li, X. Jing, Y. X. Chang and H. Wu, Spectrochim. Acta, Part A, 2012, 98, 275–281 CrossRef CAS PubMed.

This journal is © The Royal Society of Chemistry 2016