Transporter engineering and enzyme evolution for pyruvate production from D/L-alanine with a whole-cell biocatalyst expressing L-amino acid deaminase from Proteus mirabilis

Gazi Sakir Hossainab, Hyun-dong Shinc, Jianghua Liab, Guocheng Duab, Jian Chenab and Long Liu*ab
aKey Laboratory of Industrial Biotechnology, Ministry of Education, Jiangnan University, Wuxi 214122, China. E-mail: longliu@jiangnan.edu.cn; Fax: +86-510-85918309; Tel: +86-510-85918312
bKey Laboratory of Carbohydrate Chemistry and Biotechnology, Ministry of Education, Jiangnan University, Wuxi 214122, China
cSchool of Chemical and Biomolecular Engineering, Georgia Institute of Technology, Atlanta, GA 30332, USA

Received 27th June 2016 , Accepted 24th August 2016

First published on 25th August 2016


Abstract

Pyruvate is an essential metabolite in the central metabolism of microbes, and it has been widely used in the food, pharmaceutical, and agrochemical industries. Both chemical and biological processes have been used for industrial pyruvate production. In this study, one-step pyruvate production from D/L-alanine with a whole-cell E. coli biocatalyst expressing L-amino acid deaminase (pm1) from Proteus mirabilis was investigated. Alanine uptake transporters (cycA, amaP) and a pyruvate uptake transporter (lldP) were knocked out to prevent substrate and product utilization by the biocatalyst. The pyruvate production titer from D/L-alanine increased from 1.14 g L−1 under control conditions to 5.38 g L−1 with the mutant whole-cell biocatalyst. Directed evolution was used to engineer pm1 and improve the catalytic activity with D/L-alanine. Three rounds of error-prone polymerase chain reaction generated the mutant pm1ep3, which showed improved affinity (6.76 mM for L-alanine) and catalytic efficiency (0.085 s−1 mM−1 and 0.027 s−1 mM−1 for L- and D-alanine, respectively). The final pyruvate titer was increased to 14.57 g L−1 and the conversion ratio was increased to 29.14% by using the engineered whole-cell biocatalyst containing the evolved pm1ep3.

Introduction

Pyruvate plays key roles in central carbon metabolism.1 It is currently used as a nutraceutical, antioxidant, dietary supplement, and weight-control supplement.2–4 Currently, pyruvate is produced through chemical or biotechnological processes. The chemical synthesis of pyruvate is a multistep process starting from either tartaric acid or lactate and its derivatives. In one route, the dehydration and decarboxylation of tartaric acid is required, which is energy intensive owing to the pyrolysis of tartaric acid.5 In another route, ethyl pyruvate is produced from ethyl lactate by using various MoO3-based mixed oxides. This route requires the esterification of lactic acid as well as the hydrolysis of alkyl pyruvate.6 In another chemical synthesis process, pyruvic acid is produced from lactic acid via oxidative dehydrogenation to form CO2 through C–C bond fission.7 These chemical processes are not only energy intensive but also require the use of heavy metals.

There are three processes for biotechnological pyruvate production: direct fermentation, enzymatic production, and whole-cell biocatalysis.8 In the fermentative production of pyruvate, two kinds of microorganisms—the multivitamin auxotroph Torulopsis glabrata and the lipoic acid auxotroph Escherichia coli—have been using for decades.9 A NaCl-tolerant mutant, T. glabrata RS23, can produce 94.3 g L−1 pyruvate in 82 h.10 A pyruvate decarboxylase disrupted T. glabrata strain accumulates 82.2 g L−1 pyruvate in 52 h.11 A mutant E. coli YYC202 strain, in which the conversion pathways of pyruvate to acetyl-CoA, acetate, and lactate are blocked, has been used to increase pyruvate production to 40% above that obtained with the wild-type.12 However, the recovery of pyruvate from complex fermentation broth is generally difficult and expensive.

Various enzymes, such as D-amino acid oxidase, pyruvate synthase, formaldehyde dehydrogenase, tartrate dehydratase, and glycolate oxidase, have been used for pyruvate synthesis. Among these enzymes, a D-amino acid oxidase of Rhodotorula gracilis has been used to convert D/L- or D-amino acid to pyruvate, with conversion of more than 90% of the D-alanine into pyruvate.13 In another enzymatic synthesis process, pyruvate is produced from acetaldehyde and CO2 by using pyruvate decarboxylase.14 This process does not produce pyruvate in large quantities, however.

A Pseudomonas sp. g31 whole-cell biocatalyst has also been used for pyruvate production from fumarate, producing 94 mM of pyruvate from 100 mM fumarate in 24 h under optimized conditions.15 Resuspended whole-cell biocatalysts of E. coli YYC202 produce 0.93 g of pyruvate per gram of glucose.12 A recombinant Pichia pastoris whole-cell biocatalyst containing glycolate oxidase from spinach has been used to produce pyruvate from lactate.16 However, hydrogen peroxide is a by-product of this reaction and causes the breakdown of pyruvate to acetate and CO2, drastically decreasing the final yield. Therefore, genetically modified strains of Hansenula polymorpha and P. pastoris that express both glycolate oxidase and catalase have been used to produce pyruvate from L-lactic acid.17,18 A Pseudomonas stutzeri SDM whole-cell biocatalyst has been used to produce pyruvate from D/L-lactate, with titers reaching 22.6 g L−1 within 24 h.19 Compared with these processes, the production of pyruvate at high concentrations from the cheaper substrate D/L-alanine is a more valuable process on an industrial scale because racemic alanine is much cheaper than purified L-alanine. Therefore, in this study, D/L-alanine was chosen as a substrate for pyruvate production with whole-cell biocatalysis. However, uptake transporters have considerable roles in the utilization of substrates or products by whole-cell biocatalysts. Hence, we turned to transporter engineering to improve the implemented biotechnological processes.

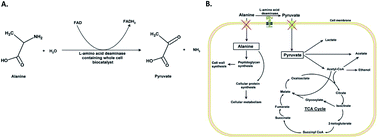
The present study investigated one-step pyruvate production from D/L-alanine with a whole-cell E. coli biocatalyst expressing L-amino acid deaminase (pm1) from Proteus mirabilis (Fig. 1A). Substrate and product utilization by the biocatalyst were initially blocked by deleting two alanine uptake transporter genes (cycA, amaP) and one pyruvate uptake transporter gene (lldP). Then, three rounds of error-prone polymerase chain reaction (ep-PCR) were performed to obtain an evolved mutant, pm1ep3. The newly evolved mutant containing the whole-cell biocatalyst increased the pyruvate titer to 14.57 g L−1 and the conversion ratio to 29.14%. To our knowledge, this study is the first to integrate a transporter engineering strategy and enzyme evolution for the improvement of pyruvate production by a whole-cell biocatalyst.


image file: c6ra16507a-f1.tif
Fig. 1 (A) The reaction for the production of pyruvate from alanine by L-amino acid deaminase containing whole cell biocatalyst. (B) Schematic representation for the substrate and product uptake and their metabolism in the bacterial cell.

Materials and methods

Microorganisms, plasmids, chemicals, and cultivation conditions

The plasmids and bacterial strains used in this study are listed in Table 1. Enzymes (PrimeSTAR HS DNA polymerase, 2× Taq PCR mix) and kits (Genomic Extraction Kit, DNA Purification Kit, and Competent Cell Preparation Kit) were supplied by TaKaRa (Dalian, China). With the exception of pyruvate (Sigma-Aldrich, Shanghai, China), all chemical reagents were purchased from Shanghai Sangon Biological Engineering Technology and Services Co. Ltd. (Shanghai, China). All microorganisms were grown at 37 °C in Luria-Bertani broth (LB; 10 g L−1 tryptone, 5 g L−1 yeast extract, 10 g L−1 NaCl) or on LB agar plates.
Table 1 Strains and plasmids used in this study
  Characteristics Reference
Strains
Escherichia coli JM109 recA1, endA1, gyrA96, thi, hsdR17, supE44, relA1, Δ(lac-proAB)/F′(traD36, proAB+, lacIq, lacZΔM 15) Takara, Otsu, Japan
Parent strain E. coli BL21(DE3) harboring the recombinant pm1 22
AlaU-mut E. coli BL21(DE3) ΔcycamaP This study
AlaPyrU-mut E. coli BL21(DE3) ΔcycamalldP This study
[thin space (1/6-em)]
Plasmids
pET20b(+)-pm1 Wild type pm1 22
pKD13 oriRγ bla+FRT-kan+-FRT 20
pKD46 oriR101 repA101(Ts) bla araC gam-bet-exo (araBp) 20
pCP20 pSC101 replicon (Ts) bla+cat+Flp(γRp)cI857 48


Deletion of alanine and pyruvate uptake transporters in E. coli

For the gene knockout, a one-step disruption protocol was followed.20 First, the cycA gene (gene accession number gi 753778409) was knocked out. A DNA fragment containing a kanamycin resistance marker (Kanr) flanked by sequences homologous to cycA genes was amplified from plasmid pKD13 using PCR with the cycA-Knock primer pair (Table S1). The cycA knockout mutant was constructed by transducing this DNA fragment into E. coli BL21 cells by electroporation and using kanamycin resistance as a positive selection. Gene knockout strains were verified by PCR using the cycA-ver primer pair (Table S1) and DNA sequencing. The resistance marker cassettes were removed from the chromosome with FLP recombinase by using the temperature-inducible plasmid pCP20. After that the other two genes amaP (gene accession number gi 753774961) and lldP (gene accession number gi 753777805) were knocked out, verified and removed the resistance marker cassettes similarly using corresponding primers (Table S1). The alanine uptake transporters (ΔcycA and ΔamaP) mutant was designated E. coli BL21 (DE3) (AlaU-mut) and the pyruvate and alanine uptake transporter (ΔlldP, ΔcycA and ΔamaP) mutant was designated E. coli BL21 (DE3) (AlaPyrU-mut). The recombinant plasmid (pm1ep3) was then transformed into the engineered strains, and whole-cell biotransformation was performed with various concentrations of D/L-alanine (5, 10, 20, and 50 g L−1) to produce pyruvate. The uptake of alanine and pyruvate by the wild-type E. coli BL21 (DE3) and its mutants was determined under the optimal biotransformation conditions of 50 g L−1 D/L-alanine, 20 g L−1 cells (dry cell weight [DCW]), pH 8.0, 40 °C, 220 rpm, and 4 h. The residual amounts of pyruvate and alanine were measured with high-performance liquid chromatography (HPLC) after the removal of cells via centrifugation to measure the uptake quantities.

Mutant library construction with ep-PCR and screening

Ep-PCR was performed by using Mutazyme II DNA polymerase and a GeneMorph II Random Mutagenesis Kit (Agilent Technologies, Santa Clara, CA, USA) as recommended by the manufacturer. Each amplification reaction (50 μL) contained 0.5 μM each of the primers pm1_F1 and pm1_R1 (see Table S1), 200 μM deoxyribonucleotide triphosphates, and 2.5 U Mutazyme II DNA polymerase in Mutazyme II reaction buffer. PCR was performed with an initial 2 min incubation at 95 °C, 30 cycles of amplification (1 min at 95 °C, 1 min at 55 °C, and 2.5 min at 72 °C), and a final 10 min elongation step at 72 °C. Two separate mutagenic amplifications were conducted. The amount of template amplicon varied in the first set of experiments (100, 10, 1, 0.1, or 0.001 ng). In the second set of experiments, 100 ng of template amplicon was used, but the number of amplification cycles varied (one, three, five, seven, 10, 15, or 20 cycles). After the process optimization, it was detected that 1.0 ng of template and 15 cycles of amplification were suitable condition for the production of two or three amino acids containing mutants. After the amplification under optimal conditions, the PCR products were digested with BamHI and XhoI, purified, and ligated into the expression vector pET20b (+), which was digested with the same enzymes.

For mutant library generation, the ligation products were used to transform competent E. coli JM109 cells via electroporation. All of the resulting colonies were washed with sterile water, and then plasmid DNA was extracted from the pooled E. coli library and subsequently transformed into the engineered E. coli (BL21) and plated on solid LB media containing kanamycin. Single colonies from the mutant library were picked with colony picker (QPix 420, Molecular Devices, Sunnyvale, CA, USA) and incubated in separate wells of a 96-deep-well, flat-bottom block containing 600 μL LB and 10 μg mL−1 kanamycin. The block was removed after overnight incubation at 37 °C and the cells were transferred to 96-well plates containing 600 μL Terrific broth media (12 g L−1 tryptone, 24 g L−1 yeast extract, and 4 mL L−1 glycerol). Then, the plates were incubated for 5 h at 28 °C with shaking at 700 rpm.

The cells were collected via centrifugation (5000 × g for 20 min), the media was removed, and the cells were washed with 20 mM Tris–HCl buffer. To start the reaction, 50 μL of 100 mM alanine in Tris–HCl buffer (pH 8.0) was added. The reaction was stopped by adding 45 μL of 20% trichloroacetic acid. Then, the mixture was kept at room temperature for 30 min, and 20 μL of 20 mM 2,4-dinitrophenylhydrazine was added. The mixture was kept at room temperature for 15 min, and the reaction was stopped by adding 400 μL of 0.8 M NaOH. Finally, the mixture was kept at room temperature for 15 min to complete the reaction and then centrifuged at 5000 × g for 20 min for clarification. The absorbance of the supernatant was measured at 520 nm with a Multiskan Spectrum spectrophotometer (Thermo Scientific, Vantaa, Finland) after appropriate dilution.

Biocatalyst preparation and assay of whole-cell biocatalytic activity

For seed preparation, recombinant E. coli cells were grown at 37 °C on a rotary shaker (200 rpm) in LB medium containing ampicillin (10 mg L−1) for 12 h. A seed culture was inoculated at a concentration of 1% (v/v) into Terrific broth containing ampicillin for cultivation. When the optical density at 600 nm (OD600) reached 0.6, 0.4 mM isopropyl β-D-1-thiogalactopyranoside was added to initiate pm1 production. The agitation speed, aeration rate, and temperature were controlled at 400 rpm, 1.0 vvm, and 28 °C, respectively, to avoid the formation of inactive inclusion bodies. After induction for 5 h, the cells were harvested via centrifugation at 8000 × g for 10 min at 4 °C and then washed twice with 20 mM Tris–HCl buffer (pH 8.0). The cell pellet was resuspended in 20 mM Tris–HCl buffer (pH 8.0) and maintained at 4 °C for further experiments. Biomass concentrations were analyzed spectrophotometrically (UV-2450 PC; Shimadzu Co., Kyoto, Japan) at OD620 and converted to DCW by using eqn (1):46
 
DCW (g L−1) = 0.4442 × OD600 − 0.021 (1)

Whole-cell biocatalytic activity was assayed by measuring the pyruvate titer in the reaction solution. For measuring the initial production rate, the reaction solution (50 g L−1 D/L-alanine and 20.0 g [DCW] per L whole-cell biocatalyst in 20 mM Tris, pH 8.0) was incubated at 40 °C on a rotary shaker for 4 h. To investigate the time profile for pyruvate production, we performed biotransformation in a 50 mL flask with 10 mL reaction solution for 36 h. The agitation speed, pH, and temperature were maintained at 220 rpm, 8.0, and 40 °C, respectively. Samples were collected at various times and centrifuged at 8000 × g for 10 min to stop the reaction, and the pyruvate concentration in the supernatant was measured with HPLC. The biotransformation ratio was determined by using following equation:

Conversion ratio (%) = M1M2/M1 × 100%
where M1 represents the moles of alanine before transformation and M2 represents the moles of alanine remaining after the conversion.

HPLC analysis of pyruvate and alanine concentration

The pyruvate concentration in the reaction mixture was determined with HPLC (Agilent 1100 series; Agilent Technologies) combined with an Aminex HPX-87H column (300 mm × 7.8 mm; Bio-Rad, Hercules, USA). The mobile phase was 5 mM sulfuric acid in distilled and deionized water, and the flow rate was 0.6 mL min−1. The column temperature was maintained at 35 °C, and the injection volume was 10 μL. Pyruvate was detected at a wavelength of 210 nm with a ultraviolet detector. Alanine was quantified by using an HPLC system (Agilent 1200 series; Agilent Technologies) after derivation with 1-fluoro-2,4-dinitrophenyl-5-L-alanine amide.21 The pure substances were used as standards.

Purification of the evolved mutants and determination of kinetic parameters

The solubilization and purification of the evolved mutants were performed as follows. The induced cells were centrifuged at 8000 × g for 10 min. Then, the cell pellets were suspended in purification buffers containing n-dodecyl-β-D-maltoside (0.01%). After disruption with ultrasonication for 20 min on ice (sonication for 1 s and intermission for 2 s) with a Vivra-Cell (Sonics, Newtown, CT), the detergent solubilization solution was filtered through a membrane (0.45 μM pore size), and the filtrate was purified on a HisTrap™ FF 5 mL column with an AKTA Explorer (GE Healthcare, Piscataway, NJ). Then, desalting was performed with an Ultra-4 Centrifugal Filter Device (Amicon, Shanghai, China). The protein concentration was determined with a BCA protein assay kit (TianGen, Beijing, China).

The kinetic analysis of pyruvate production with the evolved pm1ep1, pm1ep2, and pm1ep3 was performed by measuring pyruvate titers with various concentrations of L-alanine and D-alanine (1, 40, 80, 120, 160, 200, 240, and 280 mM) as the substrate at 40 °C for 30 min. The kinetic parameters Km and Vmax were determined with the Michaelis–Menten plotting by using the method shown in eqn (2):

 
V = {Vmax[S]/(Km + [S])} (2)
where V is the reaction rate (the amount of pyruvate produced by 1 mg of evolved mutant per minute; μmol pyruvate min−1 mg−1), Vmax is the maximum reaction rate (μmol pyruvate min−1 mg−1 protein), Km is the Michaelis constant (mM), and [S] is the concentration of L-alanine and D-alanine (mM). The activities of mutants were measured in the presence of equal amount (1.5 mg of total membrane proteins) of exogenous membranes prepared from E. coli (BL21). Paleontological statistics software (PAST) was used to analyze Michaelis–Menten graphs and non-linear curve fitting (Fig. S1 and S2).

Isothermal titration calorimetry

Isothermal titration calorimetry (ITC) was performed with iTC200 Microcalorimeter from MicroCal (GE Healthcare, MA, USA). Titrations were accomplished by injecting 2 μL aliquots of different concentrations of the alanine solution into the ITC sample cell (volume of 198 μL) containing different enzyme samples (with similar amount of membrane of E. coli DE21) at 40 °C. The stirring speed was set at 400 rpm and reference power was set at 10 μcal s−1. Similar conditions were used to measure the heat background by dropping the buffer only and no ligand was used in the cell. Data were acquired by the software supplied by MicroCal. Then, the dissociation constant (Kd) and the binding enthalpy change (ΔH) were determined and gibbs free energy change (ΔG) was calculated according to the following equation: ΔG = −RT[thin space (1/6-em)]ln[thin space (1/6-em)]Kd, where R and T represent the gas constant and the absolute temperature, respectively.

Molecular modeling and substrate docking

The hypothetical conformation of the protein was predicted by the Swiss Model Automatic Modeling Mode (http://swissmodel.expasy.org/).37 The PmaLAAD structure (PDB code: 5JMI), which showed the highest identity (55%), was used as modeling template. All the enzyme-substrate docking analyses were performed by using of Patchdock server (http://bioinfo3d.cs.tau.ac.il/PatchDock/).38 The visualization of the three dimensional model of the enzyme was performed by using PYMOL (Schrondinger, LLC, Version 1.2).41

Statistical analysis

All experiments were performed at least three times, and the results are expressed as means ± standard deviation (n = 3). Data were analyzed by using the Student's t-test. P values of less than 0.05 were considered statistically significant.

Results and discussion

Effects of transporter gene knockout on the production of pyruvate

For value-added chemical production, whole-cell biocatalysts are sustainable and superior to biocatalytic routes that use purified enzymes because purified enzymes can denature during purification as well as during incubation with the substrate. However, in whole-cell biocatalysis, substrate and product consumption by the whole cell itself is a major drawback. In addition, if the substrate or product, such as pyruvate, is more functional for the cell, then consumption has an even greater effect on yield. Therefore, this consumption must be prevented for efficient chemical production by whole-cell biocatalysts. Substrate or product consumption is usually prevented by regulating the disruption of metabolic pathways. However, L-amino acid deaminase from P. mirabilis is localized in the membrane and outwardly facing as well.22 Therefore, it can catalyze reactions when substrates are present outside of the cell. For this reason, disruption of the cell uptake system or uptake transporters (Fig. 1B) can strongly influence whether cellular utilization of a substrate or product occurs. Although membrane transporters do not involve in the chemical changes directly, but uptake type transporters contribute significantly and confirm the accumulation of product in the much greater content at the extracellular space. Therefore, different strategies for refining biotechnological processes might give greater attention to transporters and offer enormous opportunities for increasing the extracellular product formation by transporter engineering. Because D/L-alanine was used in the present study as the substrate for pyruvate production, one aim of the study was to evaluate whether uptake transporter knockout increased the production titer by minimizing uptake and subsequent utilization (see Fig. 1B).

Generally, transporters are involved not only in the efflux but also in the uptake of various metabolites and chemicals across cellular membranes. They compose an enormous protein family and are widely distributed from prokaryotic bacterial cells to eukaryotic plants and human beings.23 Three transporters in E. coli are generally responsible for the uptake of alanine and pyruvate. Among them, cycA and amaP are responsible for alanine uptake24,25,33 and lldP is responsible for pyruvate uptake.26,42,43 D-Alanine is essential for bacterial cell wall synthesis and is one of the subunits in peptidoglycan cross-linking.27 L-Alanine is used in cellular protein synthesis and other cellular metabolic processes. Knockout of alanine uptake transporters resulted in alanine uptake lower than that of the wild type (Fig. 2A), and the alanine transporter mutant (AlaU-mut) whole-cell biocatalyst containing the amino acid deaminase pm1 increased the biotransformation yield from 1.14 g L−1 to 3.67 g L−1 (Fig. 2C). Based on the transport and competition experiments with vesicles, it was found that lldP transporter is responsible lactate and pyruvate uptake.42 Knockout of this uptake transporter lower pyruvate uptake (see Fig. 2B), and the pyruvate transporter mutant (AlaPyrU-mut) whole-cell biocatalyst containing pm1 further increased the biotransformation yield from 3.67 g L−1 to 5.38 g L−1 (see Fig. 2C). Because monocarboxylate pyruvate is a key metabolite that can also serve as sole carbon source for E. coli, the knockout of these uptake transporters eventually increased pyruvate yields as well as biotransformation efficiency. Similar phenomenon was observed in case of γ-aminobutyric acid (GABA) production by using Corynebacter glutamicum, where a GABA uptake transporter (GabPCg) was knocked out.44 As a result, the uptake of GABA by the transporter engineered strain was reduced and productivity was increased by 12.5%. In another example, during the tryptophan production by a tryptophan-producing strain of C. glutamicum, three mutants with lower levels uptake of tryptophan showed improved production kinetics and accumulated about 20% more tryptophan than the wild type.45 However, bacterial cells are efficient in taking up diverse carboxylic acids from the surrounding system across the bacterial membrane via several transport mechanisms such as active transport, vectorial acylation, and facilitative diffusion.28 Therefore, the uptake of some portion of the substrate or product via other transport processes can still occur in the reaction mixture. In addition, the pyruvate concentration increases in a linear fashion initially under the highest substrate concentration (Fig. S3). Furthermore, the effect of addition of different concentration of FAD (flavin adenine dinucleotide) on the enzyme's activity was examined. As shown in Fig. S4, the addition of FAD had no effect on the enzyme's activity, indicating that the further addition of that cofactor is not essential for the reaction. It also indicates that the enzyme expressed as holoenzyme with FAD. Such deaminase enzyme has a beneficial effect from the industrial point of view, since the biotransformation will be occurred without supply of costly cofactor. In case of L-amino acid oxidase (L-AAO) of Rhodococcus opacus, similar phenomenon was also observed.47


image file: c6ra16507a-f2.tif
Fig. 2 Effect of transporter gene knockout on the uptake of alanine and pyruvate by the wild type and mutants. (A) Uptake of D/L-alanine by AlaU-mut strain; (B) uptake of pyruvate by AlaPyrU-mut strain. (C) Time profile for the biotransformation of D/L-alanine by the wild type and uptake transporter mutants. Wild type (round sign); D/L-alanine uptake mutant, AlaU-mut (rectangular sign) and D/L-alanine & pyruvate uptake mutant, AlaPyrU-mut (triangular sign). (D) Time profile for the biotransformation of D/L-alanine by the engineered whole cell biocatalyst containing epPCR mutant of L-amino acid deaminase, pm1ep3. (E) Biotransformation ration by the wild type whole cell biocatalyst containing pm1 and by the engineered whole cell biocatalyst containing evolved pm1ep3.

Ep-PCR-based directed evolution and the influence of mutation on pyruvate production

Directed evolution is useful in creating enzymes with novel specificity, enantioselectivity, and stereoselectivity. For example, combinatorial mutagenesis of galactose oxidase has been used to change the substrate specificity to glucose, and a variant with three point mutations showed activity against D-glucose.29 Directed evolution has been used to change the enantioselectivity of D-hydantoinase toward L-5-(2-methylthioethyl)hydantoin.30 The stereospecificity of tagatose-1,6-bisphosphate aldolase has been altered 100-fold via three rounds of directed evolution and screening, which resulted in an enzyme that can catalyze the formation of carbon–carbon bonds with unnatural diastereoselectivity.31

In the present study, ep-PCR was used to produce a regular mutation rate of not more than two or three amino acids changes per protein. Subsequently, a library of mutants produced by ep-PCR was screened in a 96-well plate format to identify mutants with high biotransformation efficacy. Only mutants with biotransformation efficacy from D/L-alanine to pyruvate higher than that of the wild-type enzyme were selected for further confirmation. Three rounds of ep-PCR were performed, and after the screening of approximately 3 × 10⁴ mutant clones, an evolved mutant, pm1ep3, with a considerably improved titer after the biotransformation of D/L-alanine was identified. Pm1 engineering resulted in the mutation of residues E122G, Q265G, A276V, L282R, G291N, N364D, E366K, D380N, and D423E. The mutant Pm1ep3 increased Vmax from 1.83 μM min−1 mg−1 to 3.1 μM min−1 mg−1 and from 0.50 μM min−1 mg−1 to 0.81 μM min−1 mg−1 for L- and D-alanine, respectively (Table 2). In addition, substrate affinities increased simultaneously for both D- and L-alanine (see Table 2). ITC experiments also have revealed the increased affinity (2.25-fold decrease in Kd compared to wild type) for L-alanine and a negative enthalpy changes suggesting the binding is enthalpy driven (Table S2). Interestingly, the equilibrium binding affinities for alanine (Kd values) measured by ITC for wild type and mutants are similar to the apparent kinetic affinities (Km values), suggesting that the apparent affinity approaches the binding affinity for the substrate under catalytic turnover conditions. The affinities reported in other similar enzymes are also in the mM range (Table S3), which seems very weak for an enzyme-substrate interaction. Nevertheless, the expression level of the pm1 and other mutants including pm1ep3 in the engineered whole cell biocatalyst were similar. Directed evolution usually improves the desired enzyme properties by changing the amino acid residues located close to the active center or at the substrate-binding pockets.32 Occasionally both sites are changed owing to random mutagenesis, which affects not only the active site structure but also the catalytic reaction.34 Finally, the titer had increased to 14.57 g L−1 (Fig. 2D) and biotransformation ratio was increased to 29.14% by using the engineered whole-cell biocatalyst (Fig. 2E) containing the evolved pm1ep3.

Table 2 Comparison of kinetic parameters of the wild type pm1 and its mutants, the substrates were L- and D-alaninea
Enzymes L-Alanine D-Alanine
Km (mM) Vmax (μmol min−1 mg−1) kcat (s−1) kcat/Km (s−1 mM−1) Km (mM) Vmax (μmol min−1 mg−1) kcat (s−1) kcat/Km (s−1 mM−1)
a Each value was calculated from three independent experiments.b Bold letters indicates the new mutations by the subsequent rounds of epPCR.
Wild type (pm1) 43.65 ± 0.51 1.83 ± 0.06 1.35 ± 0.04 0.031 ± 0.003 143.45 ± 2.9 0.50 ± 0.05 0.32 ± 0.03 0.002 ± 0.0006
pm1ep1 (E122G/G291N/N364D) 29.13 ± 0.39 2.17 ± 0.13 1.68 ± 0.07 0.058 ± 0.004 86.0 ± 2.6 0.60 ± 0.03 0.45 ± 0.01 0.005 ± 0.0004
pm1ep2 (E122G/G291N/N364D/A276V/D380N)b 26.34 ± 0.27 2.36 ± 0.18 1.86 ± 0.05 0.071 ± 0.002 54.9 ± 2.3 0.64 ± 0.02 0.63 ± 0.02 0.011 ± 0.0011
pm1ep3 (E122G/G291N/N364D/A276V/D380N/Q265G/L282R/E366K/D423E)b 23.33 ± 0.61 3.1 ± 0.11 1.99 ± 0.09 0.085 ± 0.002 31.49 ± 1.1 0.81 ± 0.06 0.85 ± 0.07 0.027 ± 0.0014


A docking model was constructed of the wild type pm1 and evolved mutant (pm1ep3) with alanine based on the homology model using the PatchDock software to identify the potential molecular basis for the improvement of catalytic efficiency. pm1 is a FAD-containing enzyme and produces α-keto acid and ammonia without forming hydrogen peroxide. Therefore, this enzyme is different from known oxidases. Due to its broad substrate specificity,35 the substrate-binding pocket is usually lined by hydrophobic residues. The entrance site of this type enzyme mostly occupied with negatively charged amino acids (Glu108, Glu145, Glu149, Asp156, Glu340, Asp416, & Glu417) and unusually wide (15–20 Å)36 (Fig. S5). In addition, the substrate-binding pocket of this type of enzyme is also about 20 Å deep, and mostly hydrophobic.36 In the evolved mutant, three amino acids (Q265G, A276V, and D423E) were changed in the FAD binding domain and six amino acids were changed (E122G, L282R, G291N, E364D, E366K, and D380N) in the substrate binding domain (Fig. 3A). In addition, the substrate docking showed that the atomic distances between residues 97Y/311A and the substrate alanine were increased from 21.4 Å/16.4 Å to 21.6 Å/16.5 Å, respectively (Fig. 3B and C). As a result, epPCR have changed the distances between the substrate and actives sites comparatively in a progressive manner. Consequently, substrate binding affinity and catalytic efficiency was improved in the evolved pm1ep3 (Table 2). Similar phenomena was observed in case of trehalase from Zunongwangia sp. where the shape of the binding pocket was enlarged in the epPCR mutant of the enzyme and the variant C4 with two altered sites (Y227H, and R442G) displayed a 3.3 fold increase in catalytic efficiency compared with the wild type.39 In addition, the binding affinity of that C4 variant with the substrate was improved as well as the product releasing capacity was promoted. Although random mutagenesis is targeting the entire coding sequence of the pm1, however, the distances of mutated residues form the substrate ligand were within 15 Å to 31 Å (Fig. S6). Therefore, the local environment close to the active site appeared to be significant for the improvement of the enzyme performance. It was observed that mutations near the substrate-binding site affectedly raise the success rate in many directed evolution experiments.40


image file: c6ra16507a-f3.tif
Fig. 3 (A) The model structure of evolved mutant (pm1ep3) was constructed with the crystal structure of pmaLAAD (5FJM) as a template. The colour in yellow and red are for substrate binding domain and FAD binding domain, respectively. The mutant residues are shown in a “CPK” (Corey–Pauling–Koltun) representation. Molecular distances of alanine (substrate) from the active sites: (B) in the wild type pm1; (C) in the mutant pm1ep3.

Directed evolution has produced numerous mutants that are beneficial in the manufacture of significant industrial products. Compared with applications of fermentative or enzymatic methods, those of whole-cell biocatalysts are modest owing to substrate scope, operational stability, and reproducibility. With the help of powerful enzyme discovery methods such as directed-evolution techniques, we obtained more selective and appropriate biocatalysts in this study. Moreover, our results demonstrate a pyruvate production method that is more environmentally friendly and sustainable than previously reported methods.

In conclusion, the results of our study show that transporter engineering that blocks substrate and product uptake is an effective metabolic engineering method with which to construct efficient whole-cell biocatalysts for the production of pyruvate from cheap substrate such as D/L-alanine. This approach may be used to increase the production of a variety of value-added products from relatively cheap and renewable substrates. In previous decades, numerous efforts have been made to produce pyruvate by using whole-cell biocatalysts with substrates such as lactate and fumarate. These efforts have focused primarily on the intracellular conversion of substrate to product with enzymes related to metabolic pathways. No studies have investigated transporter engineering for improved extracellular pyruvate production with whole-cell biocatalysis. Furthermore, the engineering of transporters to reduce the cellular utilization of substrate and products has great potential to enhance final yields and titers.

Acknowledgements

This work is financially supported by the Fundamental Research Funds for the Central Universities (JUSRP51612A) and 111 project (111-2-06).

Notes and references

  1. D. A. Fell and A. Wagner, Nat. Biotechnol., 2000, 18, 1121–1122 CrossRef CAS PubMed .
  2. P. K. Koh-Banerjee, M. P. Ferreira, M. Greenwood, R. G. Bowden, P. N. Cowan, A. L. Almada and R. B. Kreider, Nutrition, 2005, 21, 312–319 CrossRef CAS PubMed .
  3. M. F. McCarty, Med. Hypotheses, 2000, 54, 483–487 CrossRef CAS PubMed .
  4. X. Wang, E. Perez, R. Liu, L. J. Yan, R. T. Mallet and S. H. Yang, Brain Res., 2007, 1132, 1–9 CrossRef CAS PubMed .
  5. J. W. Howard and W. A. Fraser, Organic Syntheses, 1932, 1, 475–480 Search PubMed .
  6. H. Hayashi, N. Shigemoto, S. Sugiyama, N. Masaoka and K. Saitoh, Catal. Lett., 1993, 19, 273–277 CrossRef CAS .
  7. M. Ai and K. Ohdan, Appl. Catal., A, 1997, 150, 13–20 CrossRef CAS .
  8. H. E. Schoemaker, D. Mink and M. G. Wubbolts, Science, 2003, 299, 1694–1697 CrossRef CAS PubMed .
  9. T. B. Causey, K. T. Shanmugam, L. P. Yomano and L. O. Ingram, Proc. Natl. Acad. Sci. U. S. A., 2003, 101, 2235–2240 CrossRef .
  10. L. M. Liu, Q. L. Xu, Y. Li, Z. P. Shi, Y. Zhu, G. C. Du and J. Chen, Biotechnol. Bioeng., 2007, 97, 825–832 CrossRef CAS PubMed .
  11. Q. H. Wang, P. He, D. J. Lu, A. Shen and N. Jiang, Enzyme Microb. Technol., 2005, 36, 832–839 CrossRef CAS .
  12. B. Zelić, T. Gerharz, D. Bott, D. Vasić-Racki, C. Wandrey and R. Takors, Eng. Life Sci., 2003, 3, 299–305 CrossRef .
  13. S. Buto, L. Pollegioni, L. Angiurl and M. S. Pilone, Biotechnol. Bioeng., 1994, 44, 1288–1294 CrossRef CAS PubMed .
  14. M. Miyazaki, M. Shibue, K. Ogino, H. Nakamura and H. Maeda, Chem. Commun., 2001, 18, 1800–1801 RSC .
  15. J. Ogawa, C. L. Soong, I. Masashi and S. Shimizu, J. Mol. Catal. B: Enzym., 2001, 11, 355–359 CrossRef CAS .
  16. M. S. Payne, K. L. Petrillo, J. E. Gavagan, L. W. Wagner, R. Di Cosimo and D. L. Anton, Gene, 1995, 167, 215–219 CrossRef CAS PubMed .
  17. G. Gellissen, M. Piontek, U. Dahlems, V. Jenzelewski, J. E. Gavagan, R. DiCosimo, D. L. Anton and Z. A. Janowicz, Appl. Microbiol. Biotechnol., 1996, 46, 46–54 CrossRef CAS PubMed .
  18. M. S. Payne, K. L. Petrillo, J. E. Gavagan, R. DiCosimo, L. W. Wagner and D. L. Anton, Gene, 1997, 194, 179–182 CrossRef CAS PubMed .
  19. J. R. Hao, C. Q. Ma, C. Gao, J. H. Qiu, M. Wang, Y. N. Zhang, X. Cui and P. Xu, Biotechnol. Lett., 2007, 29, 105–110 CrossRef CAS PubMed .
  20. K. A. Datsenko and B. L. Wanner, Proc. Natl. Acad. Sci. U. S. A., 2000, 97, 6640–6645 CrossRef CAS PubMed .
  21. A. Ozaki, H. Kawasaki, M. Yagasaki and Y. Hashimoto, Biosci., Biotechnol., Biochem., 1992, 56, 1980–1984 CrossRef CAS .
  22. G. S. Hossain, J. Li, H. D. Shin, R. R. Chen, G. Du, L. Liu and J. Chen, J. Biotechnol., 2014, 169, 112–120 CrossRef CAS PubMed .
  23. C. F. Higgins, Annu. Rev. Cell Biol., 1992, 8, 67–113 CrossRef CAS PubMed .
  24. J. C. Robbins and D. L. Oxender, J. Bacteriol., 1973, 116, 12–18 CAS .
  25. F. Schneider, R. Kramer and A. Burkovski, Appl. Microbiol. Biotechnol., 2004, 65, 576–582 CrossRef CAS PubMed .
  26. V. J. Lang, C. Leystra-Lantz and R. A. Cook, J. Bacteriol., 1987, 169, 380–385 CAS .
  27. B. A. Ellsworth, N. J. Tom and P. A. Bartlett, Chem. Biol., 1996, 3, 37–44 CrossRef CAS PubMed .
  28. W. W. Kay, Bacterial transport, Marcel Dekker, Inc., New York, 1978, pp. 341–411 Search PubMed .
  29. L. Sun, T. Bulter, M. Alcalde, I. P. Petrounia and F. H. Arnold, ChemBioChem, 2002, 3, 781–783 CrossRef CAS PubMed .
  30. O. May, P. T. Nguyen and F. H. Arnold, Nat. Biotechnol., 2000, 18, 317–320 CrossRef CAS PubMed .
  31. G. J. Williams, S. Domann, A. Nelson and A. Berry, Proc. Natl. Acad. Sci. U. S. A., 2003, 100, 3143–3148 CrossRef CAS PubMed .
  32. G. S. Hossain, J. Li, H. D. Shin, L. Liu, M. Wang, G. Du and J. Chen, J. Biotechnol., 2014, 187, 71–77 CrossRef CAS PubMed .
  33. S. D. Cosloy, J. Bacteriol., 1973, 114, 679–684 CAS .
  34. M. T. Reetz, M. Bocola, J. D. Carballeira, D. Zha and A. Vogel, Angew. Chem., Int. Ed., 2005, 44, 4192–4196 CrossRef CAS PubMed .
  35. J. O. Baek, J. W. Seo, O. Kwon, S. I. Seong, I. H. Kim and C. H. Kim, J. Basic Microbiol., 2011, 51, 129–135 CrossRef CAS PubMed .
  36. P. Motta, G. Molla, L. Pollegioni and M. Nardini, J. Biol. Chem., 2016, 291, 10457–10475 CrossRef CAS PubMed .
  37. T. Schwede, J. Kopp, N. Guex and M. C. Peitsch, Nucleic Acids Res., 2003, 31, 3381–3385 CrossRef CAS PubMed .
  38. D. Schnidman-Duhovny, Y. Inbar, R. Nussinov and H. Wolfson, Nucleic Acids Res., 2005, 33, W363–W367 CrossRef PubMed .
  39. Q. Cheng, H. Gao and N. Hu, BMC Biotechnol., 2016, 16, 9 CrossRef PubMed .
  40. K. L. Morley and R. J. Kazlauskas, Trends Biotechnol., 2005, 23, 231–237 CrossRef CAS PubMed .
  41. L. L. C. Schrodinger, The PyMOL Molecular Graphics System. Version 1.3r1, 2010 Search PubMed .
  42. A. Matin and W. N. Konings, Eur. J. Biochem., 1973, 34, 58–67 CrossRef CAS PubMed .
  43. H. L. Kornberg and J. Smith, Biochim. Biophys. Acta, Gen. Subj., 1967, 148, 591–592 CrossRef CAS .
  44. Z. Zhao, J. Y. Ding, W. H. Ma, N. Y. Zhou and S. J. Liu, Appl. Environ. Microbiol., 2012, 78, 2596–2601 CrossRef CAS PubMed .
  45. M. Ikeda and R. Katsumata, Biosci., Biotechnol., Biochem., 1995, 59, 1600–1602 CrossRef CAS .
  46. G. Bratbak and I. Dundas, Appl. Environ. Microbiol., 1984, 48, 755–777 CAS .
  47. B. Geueke and W. Hummel, Protein Expression Purif., 2003, 28, 303–309 CrossRef CAS PubMed .
  48. P. P. Cherepanov and W. Wackernagel, Gene, 1995, 158, 9–14 CrossRef CAS PubMed .

Footnote

Electronic supplementary information (ESI) available. See DOI: 10.1039/c6ra16507a

This journal is © The Royal Society of Chemistry 2016
Click here to see how this site uses Cookies. View our privacy policy here.