DOI:
10.1039/C6RA16446C
(Paper)
RSC Adv., 2016,
6, 72447-72457
iTRAQ-based quantitative proteomic analysis for identification of biomarkers associated with emodin against severe acute pancreatitis in rats†
Received
25th June 2016
, Accepted 21st July 2016
First published on 22nd July 2016
Abstract
In the present work, we investigated the action of emodin against rats with severe acute pancreatitis (SAP) induced by administering 5% sodium taurocholate. The results demonstrated that emodin markedly decreased plasma amylase, lipase, IL-1β, IL-6 and TNF-α activities. Immunohistochemistry and immunofluorescence results indicated that emodin down-regulated MPO protein expression. Meanwhile, emodin improved pancreatic histopathology and acinous cell ultrastructure. In addition, real-time PCR results also proved that emodin significantly inhibited IL-1β, IL-6 and TNF-α mRNA expression. Finally, a total of 32 differentially expressed proteins from rat pancreas in response to stimulus were discovered by using iTRAQ-based quantitative proteomic analysis. These proteins were related to each other and involved in different biological processes. Among them, a new biomarker, HTRA1, was found to associate with SAP, which was validated by western blot. Further work found, for the first time, that proteins in the HTRA1/TGF-β1 signaling cascade including HTRA1, TGF-β1, IL-33, MyD88, TRAF6 and NF-κB were involved in the mechanisms of emodin against SAP. Ultimately, our results suggested that emodin had potent actions against SAP injury by inhibiting the HTRA1/TGF-β1 signaling pathway and subsequent inflammatory responses. These findings provide new insights that will aid in illuminating the action of emodin against SAP insult.
Introduction
Severe acute pancreatitis (SAP) is an inflammatory disease induced by aberrant activation of trypsin.1,2 The excessive release of inflammatory mediators spreads to multiple organs in the body and triggers a cascade of reactions. Ultimately, systemic inflammatory response syndrome (SIRS) causes multiple organ dysfunction syndromes (MODS) and even death.3,4 SAP is the most common gastrointestinal disorder that results in hospital admission.5 Recent work indicates that the incidence of SAP varies between 4.9 and 73.4 cases per 100![[thin space (1/6-em)]](https://www.rsc.org/images/entities/char_2009.gif) 000 people worldwide and is still increasing.6 In recent years, biliary disease is the main pathogenic factor of SAP in our country, accounting for approximately 50–60%, and the incidence of SAP caused by drinking and hyperlipidemia has been significantly increasing with the improvement of people's living standard and the change of eating habits.7
000 people worldwide and is still increasing.6 In recent years, biliary disease is the main pathogenic factor of SAP in our country, accounting for approximately 50–60%, and the incidence of SAP caused by drinking and hyperlipidemia has been significantly increasing with the improvement of people's living standard and the change of eating habits.7
At present, many drugs, including somatostatin and ulinastatin, show poor efficacy for the treatment of SAP in clinical trials because of its complex pathogenesis.8–10 Thus, investigating the underlying mechanisms of SAP is urgently needed in order to develop effective therapies for this disease.
Proteomic analysis has emerged as a powerful tool for high-throughput and simultaneous detection of proteins in biological samples.11 This technology also provides a large amount of information regarding the characteristic and specific changes in chemical and biochemical profiles caused by many diseases at reduced time and cost. It can reveal diagnostic biomarkers of diseases for early diagnosis and prognosis of diseases.12,13 Quantitative proteomics has become an indispensable analytical strategy for finding biomarkers in diseases in the past decade.14 However, many previous studies rely on two-dimensional differential in-gel electrophoresis (2D-DIGE), which does not effectively identify proteins of low abundance, of low (<15 kDa) or high (>150 kDa) molecular weight, and those that are excessively acidic or basic.15 A mass spectrometry-based proteomics technique, isobaric tag for relative and absolute quantitation (iTRAQ), overcomes these drawbacks. This technique has been routinely used to detect candidate biomarkers and therapeutic drugs.16–18 In this study, the iTRAQ method was used to identify the central organelle subproteome in the SAP pathogenesis that was induced by administering 5% sodium taurocholate through the biliopancreatic duct in rats.
Emodin, an anthraquinone derivative from turkey rhubarb (Rheum palmatum L.), has been reported to possess anti-inflammatory, lipid-lowering and anti-cancer activities.19–21 Previous studies have revealed that emodin plays an optimal pharmacological role in pancreatitis. However, the underlying mechanisms and drug targets remain unknown.22,23 Recent studies have been focused on blood and pancreatic juice in humans, but animal model studies for comparison and mechanistic understanding are rare.24 Therefore, in this study, we examine the effects, significant biomarkers and possible mechanisms of emodin against SAP.
Results and discussion
Emodin alleviated injury and inflammatory response of SAP rats
Experimental and clinical studies have indicated that numerous factors are involved in the local and systemic complications of SAP, including SIRS, which could result in MODS and pancreatic necrosis.25,26 Emodin is a well-known natural product that has various biological activities to prevent and treat disease.19–21 Therefore, this paper investigated the protective effects of emodin against SAP that was caused by taurocholate retrograde administered into the pancreatic duct in rats. In Atlanta classification, pancreatic digestive enzymes including amylase and lipase are the most usually obtained as biochemical markers of pancreatic disease, especially SAP.27 In this paper, we detected activities of these two enzymes by enzyme-linked immunosorbent assay (ELISA) and found that emodin (60, 30 and 15 mg kg−1) decreased amylase and lipase levels in plasma compared with the SAP group (Fig. 1A–B). The results indicated emodin could alleviate SAP injury in rats.
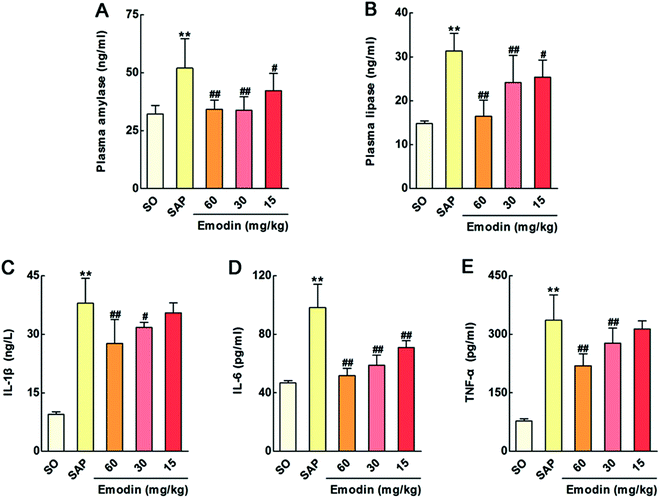 |
| | Fig. 1 Emodin alleviated injury and inflammatory response of SAP rats. Effects of emodin on the plasma levels of amylase (A), lipase (B), IL-1β (C), IL-6 (D) and TNF-α (E) in SAP rats. The data are presented as the mean ± SD, n = 6. **P < 0.01 versus SO; #P < 0.05 versus SAP, ##P < 0.01 versus SAP. | |
In addition, inflammatory response activated by overproducing proinflammatory factors and by trypsin-mediated pancreatic autodigestion is a critical risk factor.28–30 Blocking these pathogenetic chains is an important therapy for SAP. Interleukin-1β (IL-1β) and interleukin-6 (IL-6) are the main mediators in the regulation of inflammation and immunological reaction, and in the synthesis of acute-phase proteins.31 Furthermore, tumor necrosis factor-alpha (TNF-α) is a critical cytokine initiator in the inflammatory cascade.32 As shown in Fig. 1C–E, our results proved that the plasma levels of the IL-1β, IL-6 and TNF-α in SAP group were markedly increased compared with the sham operation (SO) group, which were reversed by emodin (60, 30 and 15 mg kg−1). The ELISA results proved that emodin markedly decreased SAP induced-inflammatory response.
Emodin down-regulated the myeloperoxidase (MPO) protein expression in pancreas of SAP rats
MPO level was determined as the indicator of neutrophil sequestration in the pancreas after SAP damage.32 As shown in Fig. 2A, the representative images of immunohistochemical analysis revealed the protein expression of MPO was considerably up-regulated in the SAP group. However, emodin significantly down-regulated MPO expression (brown area), thereby decreasing integrated option density (IOD) compared with the SAP group. Furthermore, as shown in Fig. 2B, immunofluorescence analysis also indicated that emodin notably decreased MPO expression (red area), thus decreasing fluorescence intensity compared with the SAP group. These results indicated that emodin could decrease neutrophil sequestration and the inflammatory reaction.
 |
| | Fig. 2 Emodin down-regulated the MPO protein expression in pancreas of SAP rats. (A) Effect of emodin on MPO-immunopositive area (brown) staining of pancreatic tissue in SAP rats by immunohistochemical detection. (B) Effect of emodin on MPO-immunopositive area (red) staining of pancreatic tissue in SAP rats by immunofluorescence detection. Images are presented at 200× magnification. The data are presented as the mean ± SD, n = 6. **P < 0.01 versus SO; #P < 0.05 versus SAP, ##P < 0.01 versus SAP. | |
Emodin improved pancreatic histopathology of SAP rats
The histopathological changes such as acinar cell vacuolization and interstitial edema in the pancreas are the most crucial alterations for evaluating pancreatic insult.33 Herein, hematoxylin/eosin (H&E) staining results indicated that pancreatic injury in SAP rats was characterized by tissue edema, leukocyte infiltration, vacuolization, acinar cell necrosis and hemorrhage, and the histological scores were significantly elevated compared with the SO group. Treatment with emodin (60, 30 and 15 mg kg−1) alleviated pancreatic injury and decreased pancreatic histological scores compared with the SAP group in a dose-dependent manner (Fig. 3).
 |
| | Fig. 3 Emodin improved pancreatic histopathology of SAP rats. Effect of emodin on H&E staining of pancreatic tissue in SAP rats. Images are presented at 200× magnification. The data are presented as the mean ± SD, n = 6. **P < 0.01 versus SO; #P < 0.05 versus SAP, ##P < 0.01 versus SAP. | |
Emodin attenuated cellular structure changes in pancreas of rats
Acinar cell vacuolization is the important alteration in pancreas of rats after SAP injury.33 In this work, we adopted transmission electron microscopy (TEM) technology in order to clearly observe the ultrastructure of acinar cells. As shown in Fig. 4A–E, acinar cells in the SO group showed regular ultrastructure with a slightly dilated endoplasmic reticulum (ER). Nevertheless, acinar cells' ER was dilated in SAP rats, with accumulation of autophagic vacuoles and dense materials. Treatment with emodin (60, 30 and 15 mg kg−1) significantly attenuated these cellular structure changes in a dose-dependent manner. These results further proved emodin possess potent protective actions on ultrastructure of acinar cells after SAP damage.
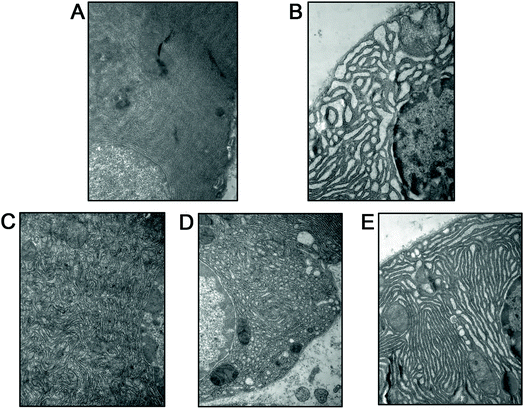 |
| | Fig. 4 Emodin attenuated cellular structure changes in pancreas of SAP rats. Representative images of the cells' ultrastructure in the SO (A), SAP (B), 60 mg kg−1 emodin (C), 30 mg kg−1 emodin (D) and 15 mg kg−1 emodin (E) groups. Images are presented at 25000× magnification. | |
Emodin attenuated IL-1β, IL-6 and TNF-α mRNA in pancreas of rats
In the present study, higher levels of IL-1β, IL-6 and TNF-α mRNA in SAP rats were found. In addition, emodin obviously decreased the mRNA levels of IL-1β, IL-6 and TNF-α (Fig. 5A–C), which suggested emodin could decrease the production of these inflammatory mediators through suppressing their mRNA expression levels in the pancreas of rats.
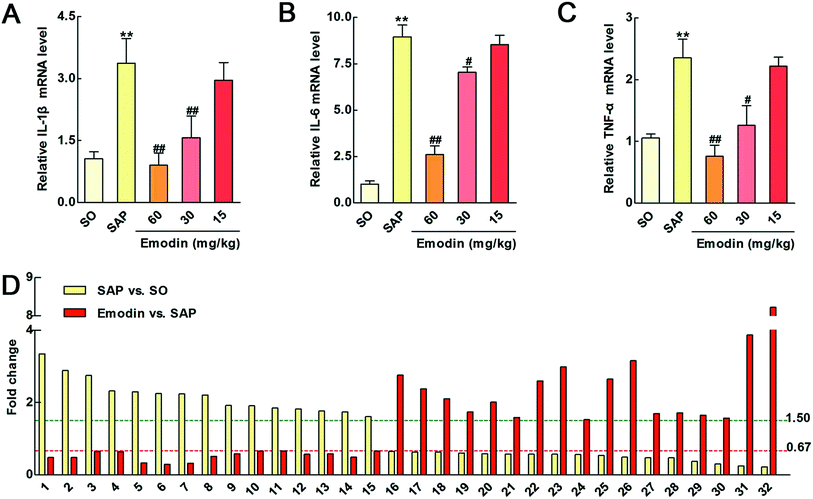 |
| | Fig. 5 The effects of emodin on IL-1β, IL-6 and TNF-α mRNA in pancreas and the potent markers of emodin against SAP in rats. Effects of emodin on the protein levels of the inflammatory mediators IL-1β (A), IL-6 (B) and TNF-α (C) in SAP rats. (D) Effects of emodin on the 32 differentially expressed proteins in SAP rats. | |
Differentially expressed proteome in SAP rats
The potential molecular mechanisms underlying SAP initiation and progression are poorly understood owing to the complexity of these biological processes. However, the illuminations of molecular events occurring are necessary steps toward a deeper understanding of SAP as well as the development of effective therapeutic strategies for this disease. Proteomics analysis is a powerful tool for identifying biological markers and estimating the complex pathogenesis and biological networks of SAP.34–36 In the present study, an iTRAQ-based proteomics method was deployed to analyze the molecular targets of emodin against SAP. A total of 10392 distinct peptides and 2974 proteins were identified (peptide FDR ≤ 0.01) in two biological replicates. Finally, a total of 355 quantified proteins were manually selected with P < 0.05 and an expression change of higher than 1.50-fold or lower than 0.67-fold in the SAP group compared with the SO group (ESI Table S1†). At the same time, 165 quantified proteins were manually selected from emodin (60 mg kg−1) treated group (ESI Table S2†). Accordingly, we found that 32 proteins might be the potent markers of emodin against SAP. Among these proteins, 17 and 15 proteins were significantly up- and down-regulated by emodin, respectively (Table 1 and Fig. 5D).
Table 1 The differentially expressed proteins from rat pancreas identified by proteomics
| No. |
Protein name |
Gene name |
Ratioa (SAP vs. SO) |
Pb value |
Ratio (emodin vs. SAP) |
P value |
| Ratio > 1.50 or <0.67. P value < 0.05. |
| 1 |
Metallothionein |
Mt1m |
3.35 |
6.34 × 10⁻⁷ |
0.48 |
3.71 × 10⁻⁷ |
| 2 |
Glucagon |
Gcg |
2.89 |
1.17 × 10⁻⁵ |
0.48 |
2.34 × 10⁻⁷ |
| 3 |
Serine protease HTRA1 |
Htra1 |
2.75 |
2.97 × 10⁻⁵ |
0.65 |
2.23 × 10⁻³ |
| 4 |
Aldehyde dehydrogenase (NAD), cytosolic (fragments) |
|
2.32 |
4.93 × 10⁻⁴ |
0.64 |
1.86 × 10⁻³ |
| 5 |
Protein Dpy19l2 |
Dpy19l2 |
2.30 |
5.68 × 10⁻⁴ |
0.33 |
1.67 × 10⁻¹⁴ |
| 6 |
Serum albumin |
Alb |
2.25 |
7.98 × 10⁻⁴ |
0.29 |
1.33 × 10⁻¹⁷ |
| 7 |
Cct-5 protein (fragment) |
Cct5 |
2.24 |
8.52 × 10⁻⁴ |
0.32 |
3.12 × 10⁻¹⁵ |
| 8 |
Creatine kinase M-type |
Ckm |
2.21 |
1.00 × 10⁻³ |
0.51 |
1.95 × 10⁻⁶ |
| 9 |
Protein Edrf1 |
Edrf1 |
1.92 |
6.76 × 10⁻³ |
0.59 |
2.58 × 10⁻⁴ |
| 10 |
Protein Sh3d19 |
Sh3d19 |
1.91 |
7.09 × 10⁻³ |
0.66 |
3.63 × 10⁻³ |
| 11 |
Protein Cobll1 |
Cobll1 |
1.85 |
1.04 × 10⁻² |
0.66 |
4.15 × 10⁻³ |
| 12 |
Charged multivesicular body protein 4c |
Chmp4c |
1.82 |
1.26 × 10⁻² |
0.57 |
1.04 × 10⁻⁴ |
| 13 |
Protein Myh1 |
Myh1 |
1.77 |
1.75 × 10⁻² |
0.59 |
2.58 × 10⁻⁴ |
| 14 |
Beta-enolase |
Eno3 |
1.74 |
2.08 × 10⁻² |
0.49 |
7.80 × 10⁻⁷ |
| 15 |
Platelet glycoprotein Ib beta chain |
Sept5 |
1.61 |
4.73 × 10⁻² |
0.66 |
3.51 × 10⁻³ |
| 16 |
Protein LOC684681 |
LOC684681 |
0.65 |
4.06 × 10⁻² |
2.76 |
1.81 × 10⁻⁹ |
| 17 |
Protein LOC681918 |
LOC686074 |
0.63 |
2.77 × 10⁻² |
2.38 |
2.95 × 10⁻⁷ |
| 18 |
60S ribosomal protein L29 |
Rpl29 |
0.63 |
2.77 × 10⁻² |
2.11 |
9.37 × 10⁻⁶ |
| 19 |
40S ribosomal protein S30 |
Fau |
0.60 |
1.48 × 10⁻² |
1.74 |
1.04 × 10⁻³ |
| 20 |
Protein LOC684828 |
LOC684828 |
0.59 |
1.22 × 10⁻² |
2.01 |
3.46 × 10⁻⁵ |
| 21 |
Protein Mms19 |
Mms19 |
0.58 |
9.45 × 10⁻³ |
1.59 |
6.53 × 10⁻³ |
| 22 |
Ena/VASP-like protein |
Evl |
0.57 |
8.78 × 10⁻³ |
2.60 |
1.53 × 10⁻⁸ |
| 23 |
Dynein heavy chain 12, axonemal |
Dnah12 |
0.57 |
7.16 × 10⁻³ |
2.99 |
8.76 × 10⁻¹¹ |
| 24 |
Hematological and neurological expressed 1 protein |
Hn1 |
0.56 |
5.65 × 10⁻³ |
1.53 |
1.17 × 10⁻² |
| 25 |
Trefoil factor 2 |
Tff2 |
0.54 |
3.18 × 10⁻³ |
2.65 |
8.09 × 10⁻⁹ |
| 26 |
GIMAP4 |
Gimap4 |
0.49 |
7.20 × 10⁻⁴ |
3.16 |
9.69 × 10⁻¹² |
| 27 |
Uncharacterized protein |
|
0.47 |
3.64 × 10⁻⁴ |
1.70 |
1.62 × 10⁻³ |
| 28 |
Transcriptional activator protein Pur-beta |
Purb |
0.47 |
3.57 × 10⁻⁴ |
1.72 |
1.30 × 10⁻³ |
| 29 |
PR domain zinc finger protein 2 |
Prdm2 |
0.37 |
1.71 × 10⁻⁶ |
1.65 |
2.92 × 10⁻³ |
| 30 |
Epidermal growth factor receptor pathway substrate 15 isoform B |
Eps15 |
0.30 |
7.58 × 10⁻⁹ |
1.57 |
8.17 × 10⁻³ |
| 31 |
Protein Slc37a1 |
Slc37a1 |
0.25 |
6.28 × 10⁻¹¹ |
3.87 |
1.10 × 10⁻¹⁵ |
| 32 |
Protein Kel |
Kel |
0.22 |
2.07 × 10⁻¹³ |
8.22 |
9.19 × 10−36 |
Classification of differentially expressed proteins
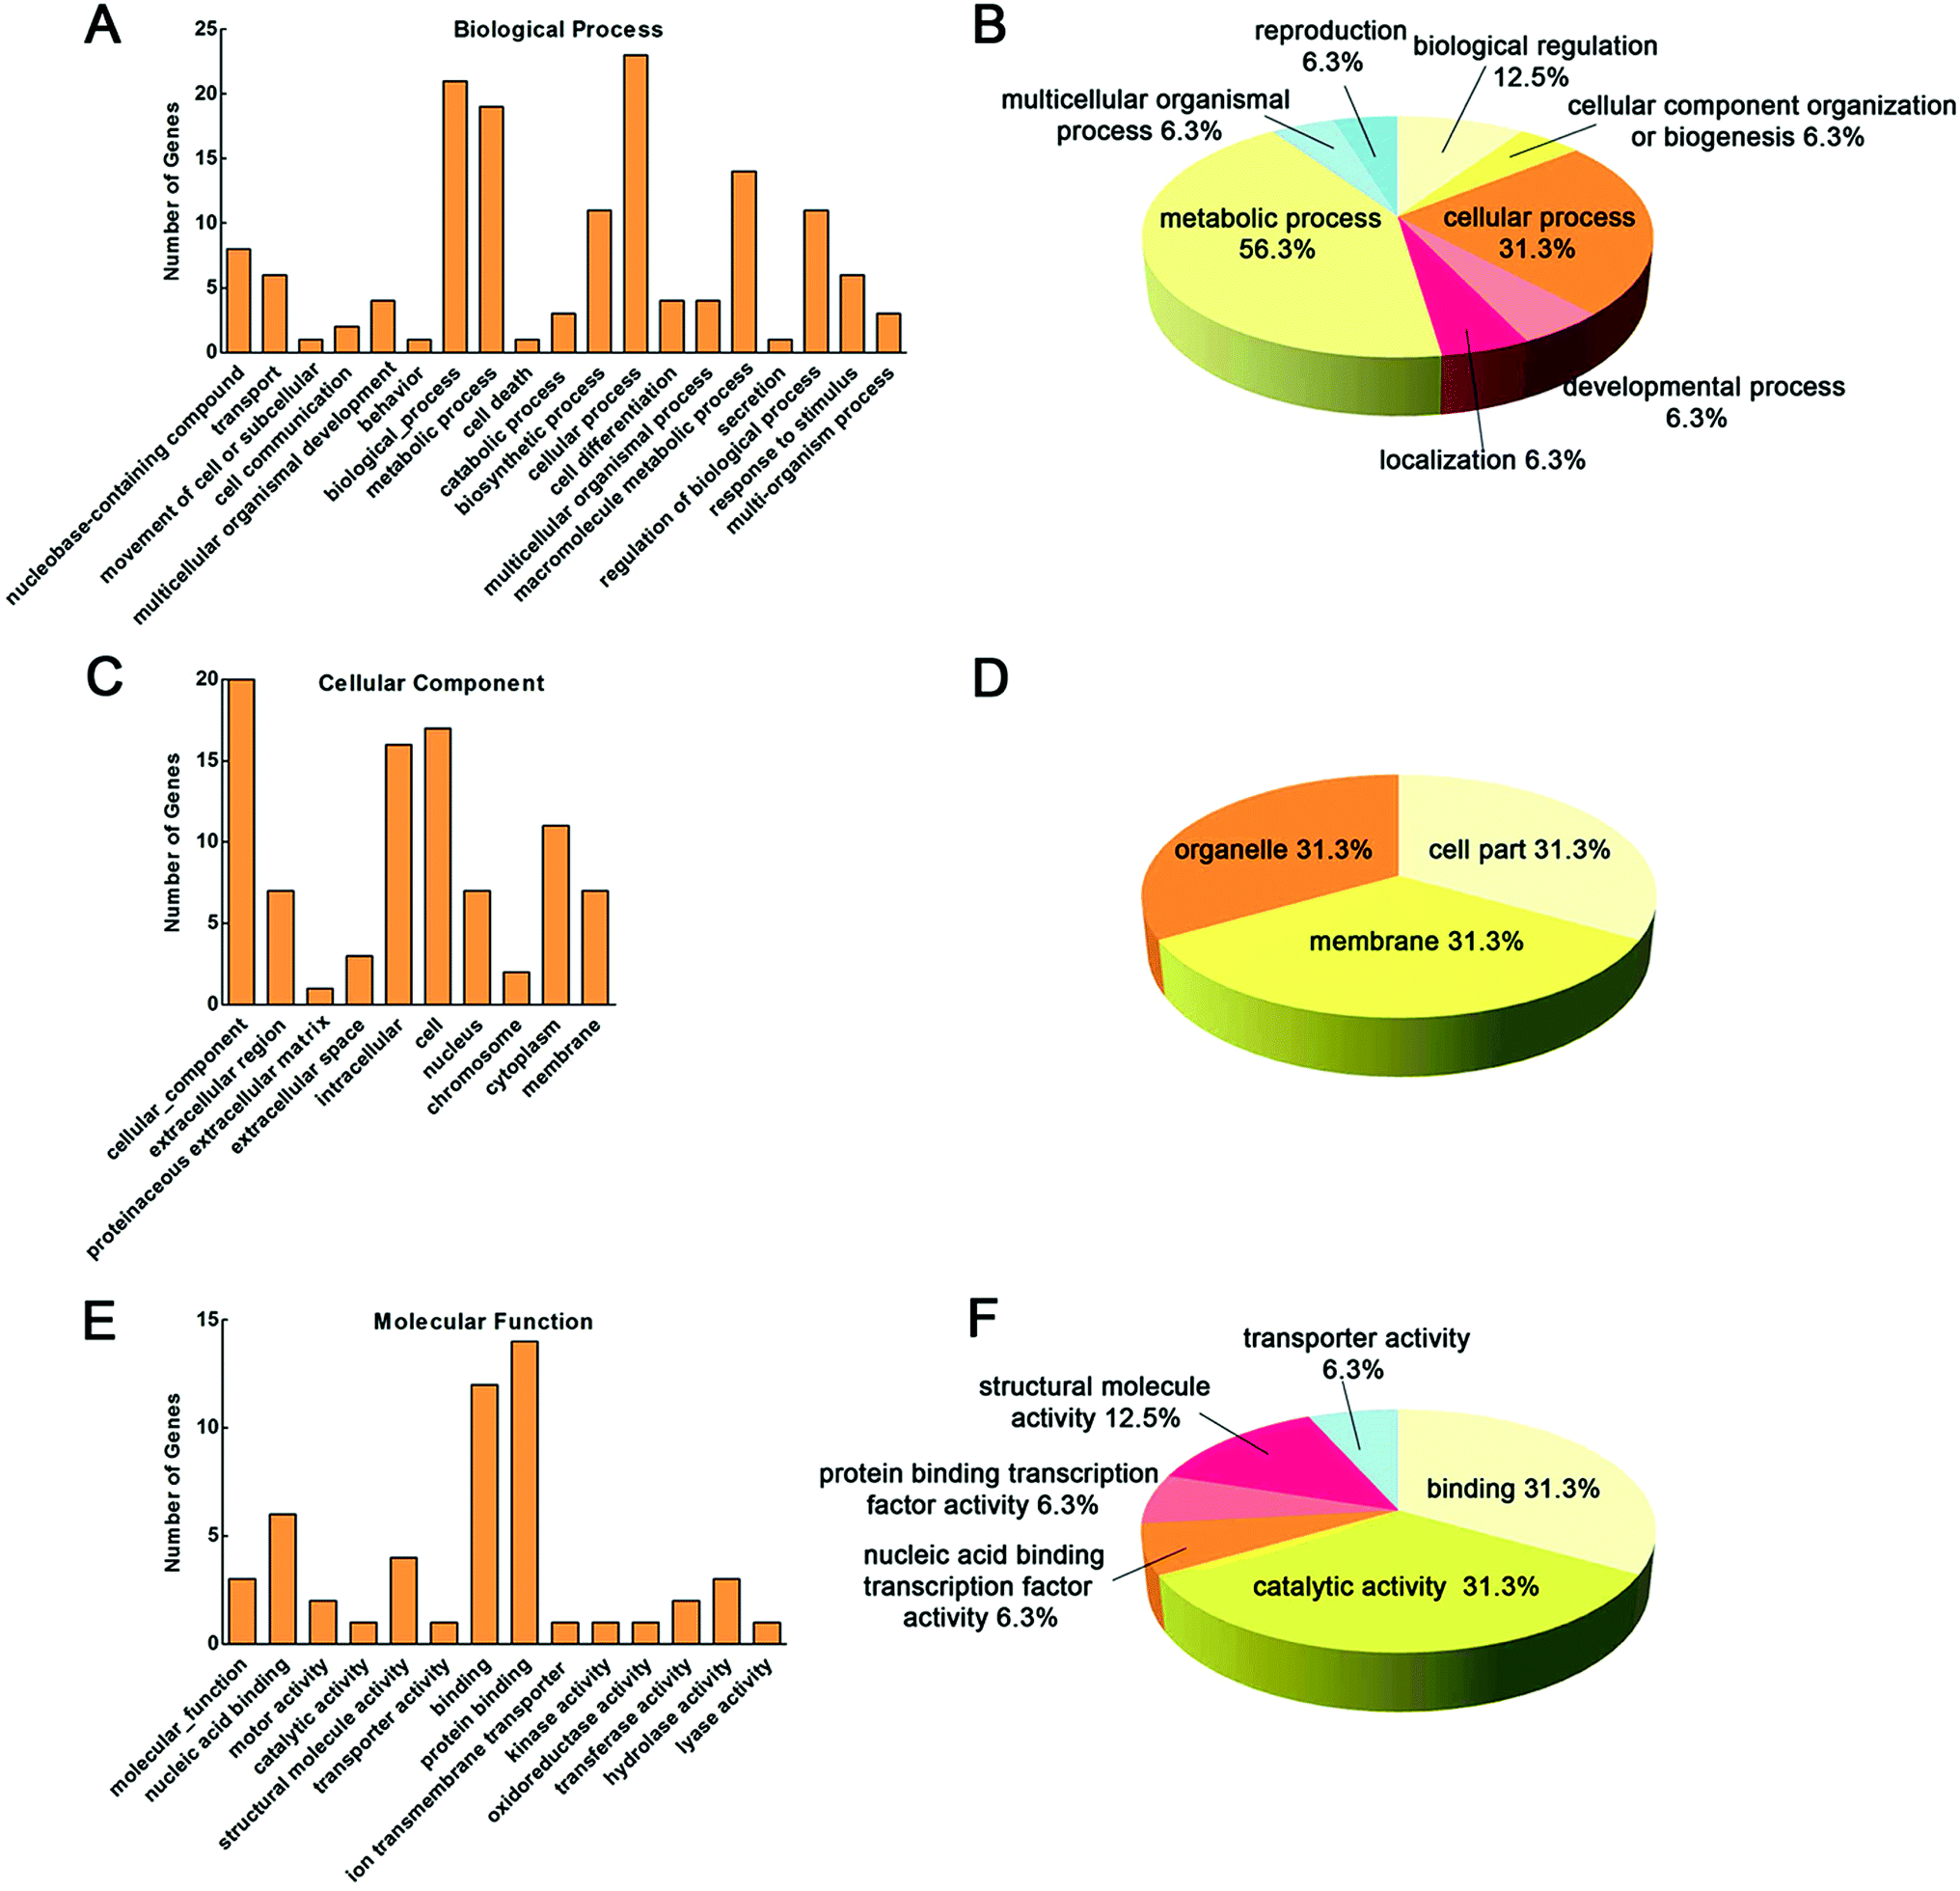
Functional classification of the 32 proteins identified above is detailed in Fig. 6. Proteins were categorized according to biological process (BP), cellular component (CC) and molecular function (MF) according to the GO database. As shown in Fig. 6A–B, the proteins involved in BP were distributed as following: metabolic process (56.3%), cellular process (31.3%), biological regulation (12.5%), cellular component organization or biogenesis (6.3%), developmental process (6.3%), localization (6.3%), multicellular organismal process (6.3%), and reproduction (6.3%). In addition, as shown in Fig. 6C–D, the CC-identified proteins were distributed as following: cell part (31.3%), membrane (31.3%) and cell (31.3%). Furthermore, as shown in Fig. 6E–F, MF of the proteins were classified, and the major groups were found to be binding (31.3%), catalytic activity (31.3%), structural molecule activity (12.5%), nucleic acid binding transcription factor activity (6.3%), protein binding transcription factor activity (6.3%), and transporter activity (6.3%).
 |
| | Fig. 6 Functional classification of the 32 identified proteins. Proteins were categorized according to BP (A and B), CC (C and D) and MF (E and F) by the GO database. | |
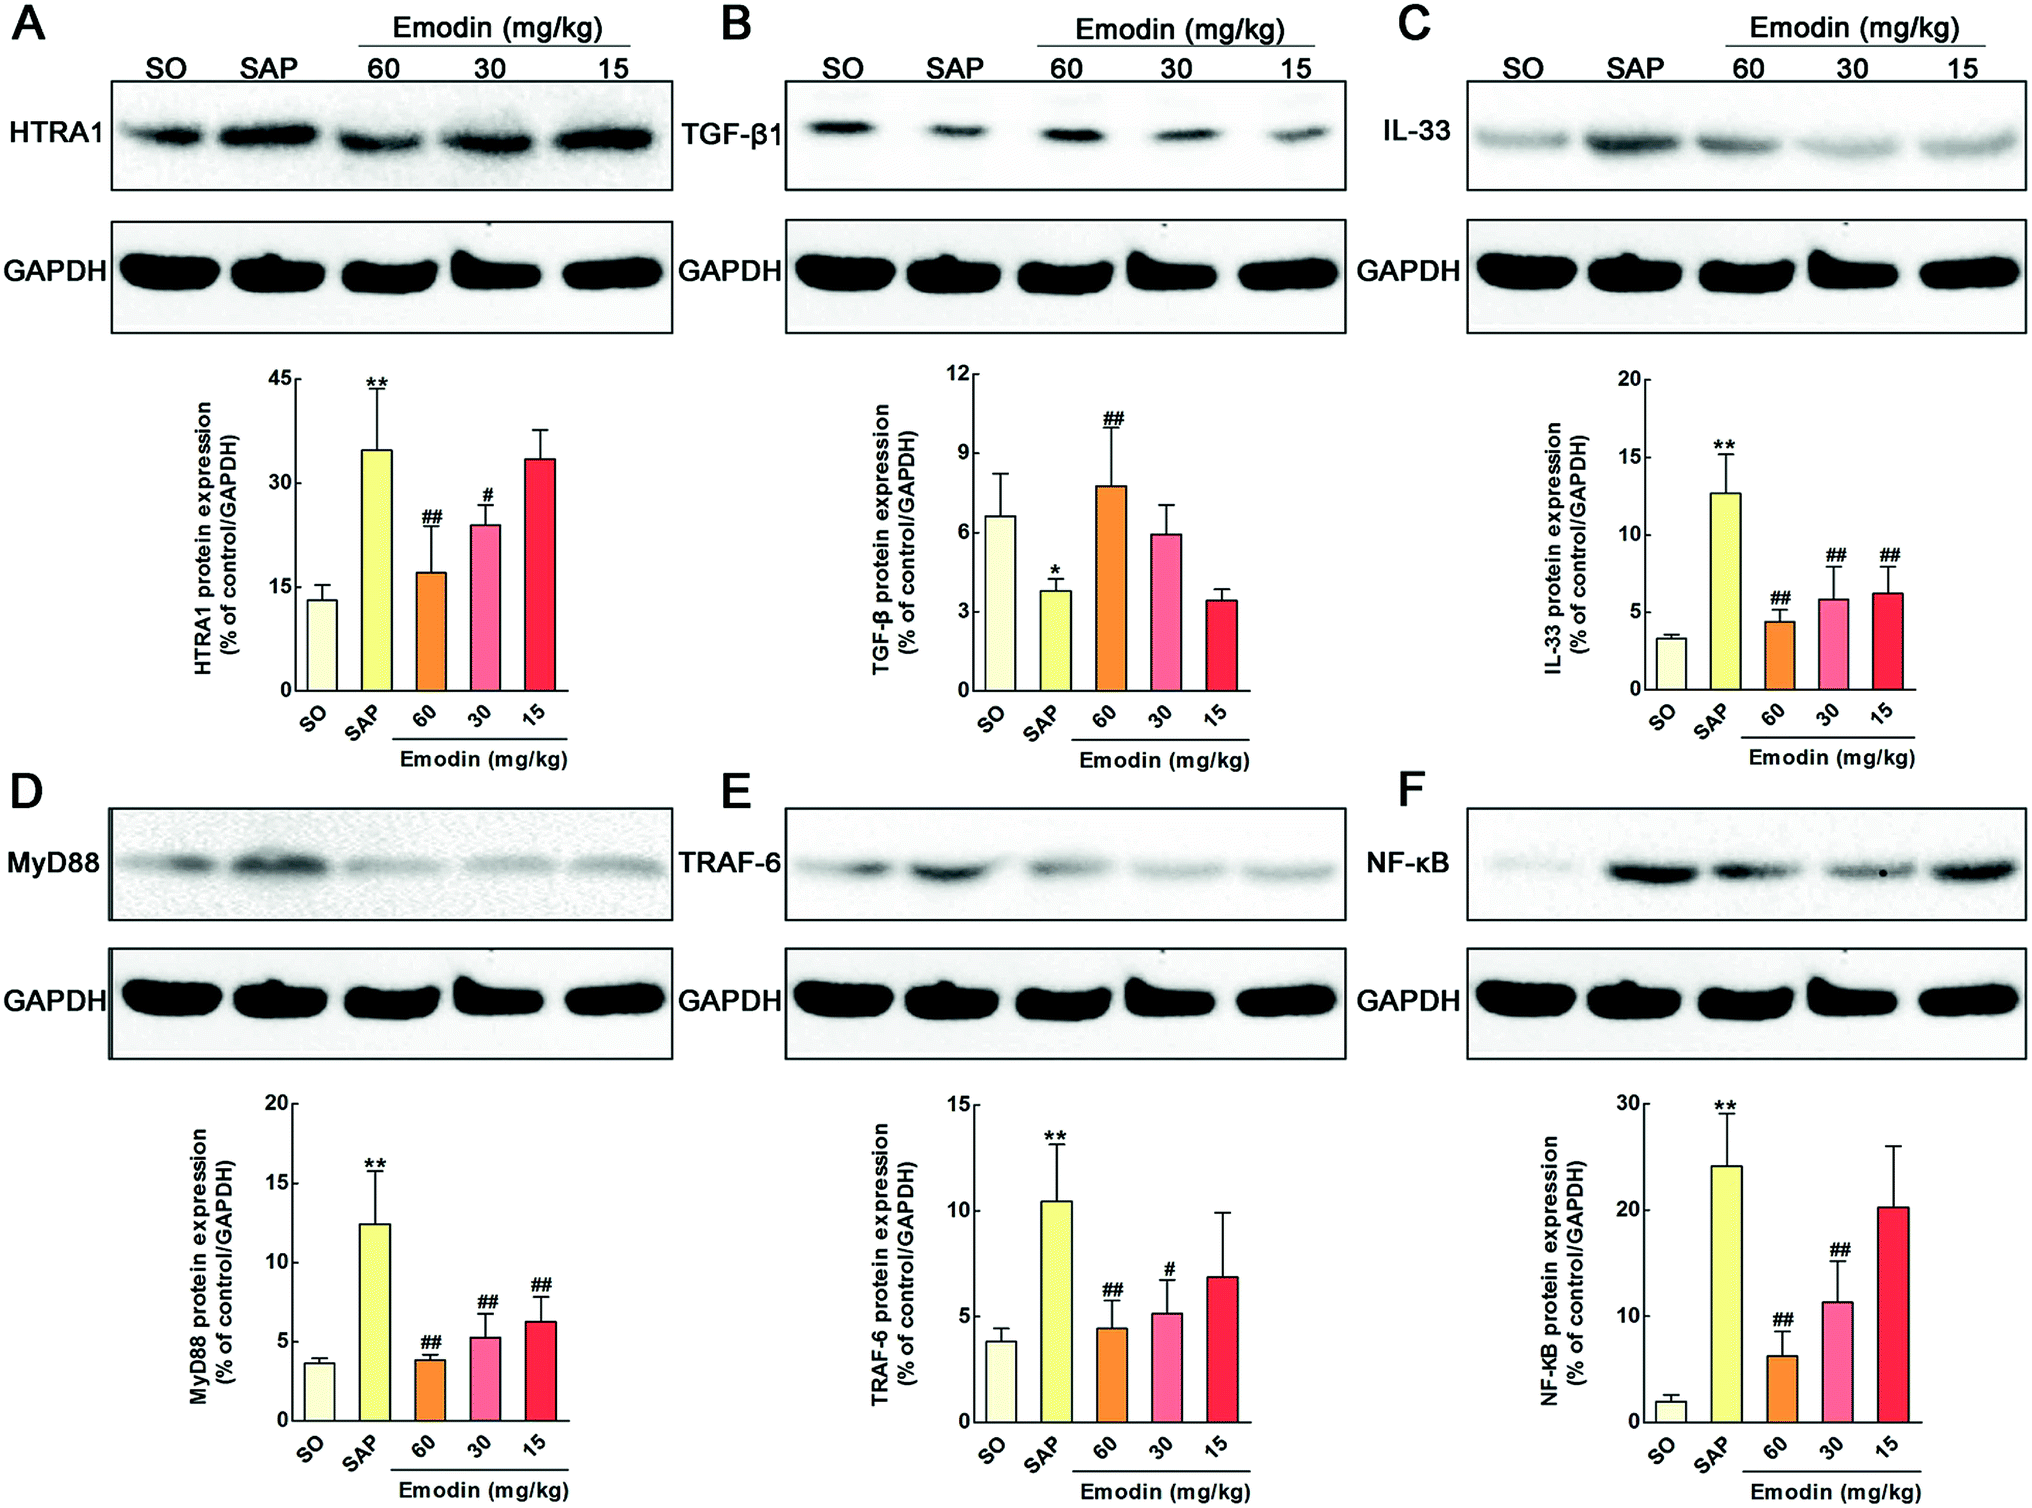
Emodin inhibited the HTRA1/TGF-β mediated signaling pathway
Among the 32 proteins, we found that emodin significantly down-regulated the expression of high-temperature requirement A1 (HTRA1) (P = 2.23 × 10⁻³). As far as we know, HTRA family proteins feature a highly conserved protease domain and one or more C-terminal PDZ protein-interaction domains.37 HTRA1, a member of this family, is a secreted serine protease reported to influence many biological processes and is involved in the process of cell signaling, skeletal development, osteogenesis and organization of the extracellular matrix.38–40 In addition, the serine protease activity of HTRA1 is need for the inhibition of TGF-β family signaling. Previous researches also proved that HTRA1 could prevent pro-TGF-β1 from maturing into TGF-β1.41 Meanwhile, TGF-β1 has multiple biological effects and serves an important role in limiting intestinal inflammation through suppression of IL-33.42,43 In detail, IL-33 binding by the ST2 receptor causes the activation and recruitment of the myeloid differentiation primary response gene (88) (MyD88) adapter protein along with TNF receptor-associated factor 6 (TRAF6). The signaling cascade further results in the activation of transcription factor NF-κB and the release of inflammatory mediators such as IL-1β, IL-6 and TNF-α.44–47 In this research, we detected whether these signal molecules involve in the protective effects of emodin on SAP in rats. As shown in Fig. 7A–F, the levels of HTRA1, IL-33, MyD88, TRAF6 and NF-κB in the pancreatic tissue were significantly increased, and TGF-β1 was markedly decreased compared with the SO group (P < 0.01). In addition, pretreatment with emodin markedly decreased the levels of HTRA1, IL-33, MyD88, TRAF6 and NF-κB and increased the level of anti-inflammatory cytokine TGF-β1 in pancreatic tissue. The western blotting results indicated that emodin inhibited the HTRA1/TGF-β1-mediated signaling pathway.
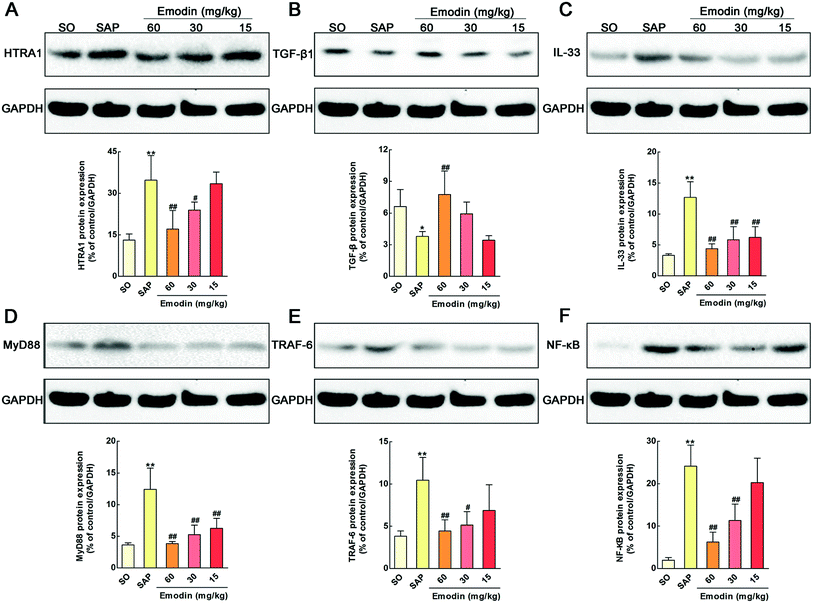 |
| | Fig. 7 Emodin inhibited the HTRA1/TGF-β1 mediated signaling pathway in pancreas of SAP rats. Effects of emodin on the HTRA1 (A), TGF-β1 (B), IL-33 (C), MyD88 (D), TRAF6 (E), and NF-κB (F) proteins expression in SAP rats. The data are presented as the mean ± SD, n = 3. **P < 0.01 versus SO; #P < 0.05 versus SAP, ##P < 0.01 versus SAP. | |
Experimental
Reagents and materials
Emodin was purchased from Solarbio Science & Technology Co (Beijing, China), which was suspended in 0.5% sodium carboxymethylcellulose (CMC-Na) before the animal experiment. Sodium taurocholate was obtained from Sigma Chemical Co. (St. Louis, MO, USA). Amylase, lipase, IL-6, IL-1β and TNF-α enzyme-linked ELISA kits were obtained from Langdun Biotech (Shanghai, China). The Power Vision Two-Step Histostaining Reagent was obtained from the Nanjing Jiancheng Institute of Biotechnology (Nanjing, China). RNAiso Plus reagent, PrimeScript®RT reagent and SYBR® PremixEx Taq™II (Tli RNaseH Plus) were purchased from TaKaRa Biotechnology Co., Ltd. (Dalian, China). Rabbit anti-HTRA1, TGF-β1, IL-33, MyD88, TRAF-6 and NF-κB, horseradish peroxidase-conjugated goat anti-rabbit IgG, and TRITC-conjugated goat anti-rabbit IgG (H + L) were purchased from Proteintech Group (Chicago, USA).
Animals
Sprague-Dawley (SD) rats weighing 250–300 g were provided by the Experimental Animal Center of Dalian Medical University with a 12 hour light–dark cycle and free access to standard laboratory feed and water. The animal experiments were approved by the ethical committee for Laboratory Animal Care and Use of Dalian Medical University, and all experimental procedures were conducted in compliance with the National Institutes of Health Criteria.
Pharmacological treatments and SAP
SD rats were randomly divided into five groups (n = 10 for each group): group I, sham operation group (SO); group II, SAP model group (SAP); groups III–V, emodin treated groups, in which the rats were administered emodin at the doses of 60, 30 and 15 mg kg−1, respectively. Both the SO and SAP groups were administered 0.5% (CMC-Na) of equivalent volume. After establishing the animal model, emodin was intragastrically administered to the rats in the emodin groups immediately and at the sixth hour. SAP models were carried out as previously reported.48 Briefly, animals were anesthetized with 10% chloral hydrate (0.3 ml/100 g body weight), and then SAP was induced by retrograde injection of 5.0% sodium taurocholate (0.1 ml/100 g body weight) into the biliopancreatic duct. Samples were obtained after 12 hours of duct infusion. Blood samples were obtained for biochemical analyses. A portion of pancreas samples were immediately frozen and maintained at −80 °C for real-time PCR, western blotting and iTRAQ analyses. The others were fixed in 10% buffered formalin and embedded in paraffin for histopathological examination and immunohistochemical detection. A small portion (<1 mm3) of tissue was excised from the pancreas and fixed in 2% glutaraldehyde for TEM assay.
Plasma amylase and inflammatory cytokine assays
The plasma was collected after the experiments. Amylase, lipase, IL-1β, IL-6 and TNF-α levels in plasma were assayed with ELISA kits according to the manufacturer's instructions.
Immunohistochemical and immunofluorescence detections of MPO
The Power Vision Two-Step Histostaining Reagent was used to detect the MPO immunohistochemical results. Briefly, pancreas sections (4 μm) were dewaxed in graded alcohol and finally washed in tap water. Endogenous peroxidase activity was blocked by 3% (v/v) H2O2, and the antigen was retrieved by microwave in 0.01 mol L−1 citrate buffer. The sections were then washed in phosphate-buffered saline (PBS, 0.1 mol L−1). Rabbit anti-rat MPO polyclonal antibody was applied at 1:100 and incubated overnight at 4 °C. These sections were washed in PBS three times for 15 minutes. Eventually, the slides were incubated with biotin labeled goat anti-rabbit IgG, horseradish peroxidase-conjugated streptavidin and DAB solution for 10 min at 37 °C. The images were acquired by a light microscope (Leica DM4000B, Germany) with 200× magnification.
Immunofluorescence localization of MPO was performed with pancreas sections using the methods just described. After the slides were treated with diluted MPO antibodies (1:100), they were incubated with TRITC-conjugated goat anti-rat IgG (H + L) for 1 h at 37 °C. Digital images were collected with an Olympus BX63 fluorescent microscope (Olympus BX63, Japan) with 200× magnification.
IOD and fluorescent intensity of the images were calculated using image-Pro Plus 6.0 software (Media Cybernetics, USA).
Histopathological examination
Formalin-fixed tissue samples from each group were stained with H&E and examined with light microscopy (Leica DM4000B, Germany) with 200× magnification. The sample images were taken, and the effects of emodin on pancreatic edema, inflammation and vacuolization were evaluated.49 We applied the scoring system as shown in ESI Table S3.†
TEM assay
The pancreas samples were harvested and fixed overnight at 4 °C in 2% glutaraldehyde. After washing three times (each for 15 min) in 0.1 M sodium cacodylate buffer, the cells were fixed in 1% osmium tetroxide for 2 h. The samples were dehydrated in gradient ethanol solutions and then treated as previously described.49 The pretreated samples were used for ultramicrotomy and collected on copper grids. The obtained sections were then stained and observed using a TEM (JEM-2000EX, JEDL, Japan) with 25000× magnification.
Quantitative real-time PCR analysis for IL-1β, IL-6 and TNF-α
Total RNA from pancreas was extracted using RNAiso Plus reagent following the manufacturer's protocol. RNA (1 μg) was reverse-transcribed using a PrimeScript®RT reagent Kit in a TC-512 PCR system (TECHNE, UK), and single-stranded cDNA was quantified using real-time PCR with SYBR® PremixEx Taq™II (TliRNaseH Plus) in an ABI 7500 Real-Time PCR System (Applied Biosystems, USA). The primers used in the present work are listed in ESI Table S4.† A no-template control was analyzed in parallel with each gene, and the GAPDH gene was used as the housekeeping gene in our study. All gene expression levels were normalized to GAPDH, and the fold changes between the different groups were calculated using the 2−ΔΔCt method.
Protein preparation and iTRAQ isobaric labeling
The tissue samples of the different groups were collected and mixed with lysis buffer including 100 mM Tris–HCl (pH = 8.0), 8 M urea, 10 mM DTT and 1X protease inhibitor. Then, the obtained supernatant protein was quantified using the Bradford Assay Kit (Bio-Rad, Hercules, CA). The proteins were reduced, alkylated, and digested by trypsin according to the protocol provided by the manufacturer (Applied Biosystems, Foster City, CA, USA). A standard pool comprising a mixture of equal amounts of protein derived from all samples including SO, SAP and emodin (60 mg kg−1) groups served as an internal control. The samples were labeled with iTRAQ reagents as follows: SO, iTRAQ reagent 114; SAP, iTRAQ reagent 115; emodin (60 mg kg−1), iTRAQ reagent 116; mixture, iTRAQ reagent 117 with two biological replicates.
Strong cation exchange chromatography separation
The labeled peptides were fractionated by strong cation exchange chromatography (SCX), and 10 fractionations were collected. The peptides were separated on a polysulfoethyl column (4.6 × 100 mm, i.d., 5 μm, 200 Å pore size) (PolyLCInc., Maryland, U.S.A.) using an AKTA Purifier 100 unit (GE Healthcare, Niskayuna, NY, USA) system. The mobile phase consisting of buffer A (10 mM KH2PO4, 25% CAN and pH = 3.0) and buffer B (10 mM KH2PO4, 25% CAN, 500 mM KCl and pH = 3.0) was set at a flow rate of 1 ml min−1 with gradient elution. Then, a second dimension separation was performed on a nanoscale HPLC system (EASY-nLC from Proxeon Biosystems, Odense, Denmark) coupled with a Q-Exactive (Thermo Fisher Scientific, MA, USA) for online mass spectrometric (MS) analysis.
Mass spectrometry analysis
Further separation of the samples was achieved by Nano-HPLC EASY-nLC system (AB SCIEX, Concord, Canada). Briefly, samples were loaded onto a Thermo scientific EASY column (2 cm × 100 μm 5 μm-C18) from an autosampler. After washing with 95% A liquid (0.1% formic acid in HPLC grade water), the system was switched into line with a analytical column (Thermo scientific EASY column, 75 μm × 100 mm 3 μm-C18). The mobile phase used for this separation was 0.1% formic acid (A) and 84% acetonitrile with 0.1% formic acid (B) and eluted at a flow rate of 250 ml min−1 using the following gradient: 0–85 min, linear gradient from 100:0 to 60:40 (A:B); 85–88 min, linear gradient from 60:40 to 0:100 (A:B); 88–90 min, 0:100 (A:B).
After separating, each samples were analysed by a mass spectrometer (Q-Exactive, Thermo Finnigan). The parameters of this mass spectrometer were as follows: parsing time, 90 min; detection mode, positive ion; parent ion scanning range, 300–1800 m/z; first order mass spectrometer resolution, 70000 at m/z 200; AGC target, 3 × 10⁶; first order maximum IT, 10 ms; number of scan ranges, 1; dynamic exclusion, 40.0 s. The mass charge ratio of polypeptide and polypeptide fragments are collected by the following methods: 10 fragments were collected after each full scan; MS2 activation type, HCD; isolation window, 2 m/z; secondary mass spectrometer resolution, 17500 at m/z 200; microscans, 1; secondary maximum IT, 60 ms; normalized collision energy, 30 eV; underfill ratio, 0.1%.
Database search and iTRAQ quantification
Protein identification were performed with Mascot 2.2 software and the database of “uniprot_rat_147897_20150902.fasta”. The peak intensity of the peptide reports were searched for protein quantification using Proteome Discoverer1.4 software. Finally, the expression was modified (fold change > 1.50 or <0.67-fold) with a P-value < 0.05 selected as statistically significance.
Western blotting assay
Total protein was extracted from the pancreas tissues using an appropriate cold lysis buffer supplemented with 1 mM phenylmethylsulfonyl fluoride (PMSF), and the protein concentration was determined using a BCA protein assay kit (Beyotime Biotechnology, China). Samples were subjected to SDS-PAGE (10–15%) and transferred onto a PVDF membrane (Millipore, USA). Membranes were blocked and incubated overnight at 4 °C with the primary antibodies including HTRA1, TGF-β1, IL-33, MyD88, TRAF-6, and NF-κB. Membranes were incubated at room temperature with an appropriate secondary antibody, and proteins were detected using an enhanced chemiluminescence (ECL) method. Protein bands were imaged using a ChemiDoc XRS bioimaging system (Bio-Rad, USA). Bands were normalized with GAPDH as an internal control.
Statistical analysis
The results are expressed as the mean ± SD. One-way repeated-measures ANOVA was used for the analysis of the differences between the groups. All statistical analyses were carried out using SPSS 18.0 software with statistical significance set at P < 0.05 or P < 0.01.
Conclusions
In summary, emodin conferred direct protective effects on SAP by inhibiting the HTRA1/TGF-β1-mediated signaling pathway and the subsequent inflammatory responses (Fig. 8). Accordingly, these findings provide new insights that will aid in illuminating the action of emodin against SAP insult and support the development of emodin as a potential treatment for SAP.
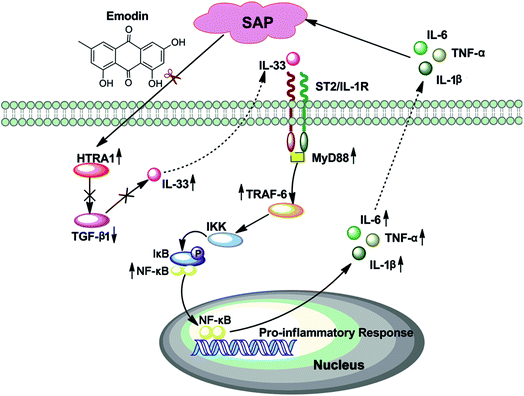 |
| | Fig. 8 Proposed model for the protective effects of emodin against SAP. Emodin inhibits the HTRA1 signal and subsequently increases TGF-β1 release to ameliorate inflammation and SAP. | |
Acknowledgements
This work was financially supported by the National Natural Science Foundation of China (No. 81373875). Thanks to the Liaoning Key Laboratory of Integrative Medicine Surgery in Rare and Critical Cases.
Notes and references
- D. C. Whitcomb, N. Engl. J. Med., 2006, 354, 2142–2150 CrossRef PubMed.
- Q. Yang, J. Sun and Y. Q. Chen, RSC Adv., 2016, 6, 25837–25849 RSC.
- O. J. Bakker, S. van Brunschot, H. C. van Santvoort, M. G. Besselink, T. L. Bollen, M. A. Boermeester, C. H. Dejong, H. van Goor, K. Bosscha, U. Ahmed Ali, S. Bouwense, W. M. van Grevenstein, J. Heisterkamp, A. P. Houdijk, J. M. Jansen, T. M. Karsten, E. R. Manusama, V. B. Nieuwenhuijs, A. F. Schaapherder, G. P. van der Schelling, M. P. Schwartz, B. W. Spanier, A. Tan, J. Vecht, B. L. Weusten, B. J. Witteman, L. M. Akkermans, M. J. Bruno, M. G. Dijkgraaf, B. van Ramshorst and H. G. Gooszen, N. Engl. J. Med., 2014, 371, 1983–1993 CrossRef CAS PubMed.
- S. Tenner, J. Baillie, J. DeWitt and S. S. Vege, Am. J. Gastroenterol., 2013, 108, 1400–1415 CrossRef CAS PubMed.
- D. Yadav and A. B. Lowenfels, Gastroenterology, 2013, 144, 1252–1261 CrossRef PubMed.
- P. G. Lankisch, M. Apte and P. A. Banks, Lancet, 2015, 386, 85–96 CrossRef.
- A. F. Peery, E. S. Dellon, J. Lund, S. D. Crockett, C. E. McGowan, W. J. Bulsiewicz, L. M. Gangarosa, M. T. Thiny, K. Stizenberg, D. R. Morgan, Y. Ringel, H. P. Kim, M. D. Dibonaventura, C. F. Carroll, J. K. Allen, S. F. Cook, R. S. Sandler, M. D. Kappelman and N. J. Shaheen, Gastroenterology, 2012, 143, 1179–1187 CrossRef PubMed.
- M. Concepcion-Martin, C. Gomez-Oliva, A. Juanes, X. Diez, D. Prieto-Alhambra, X. Torras, S. Sainz, C. Villanueva, A. Farre, C. Guarner-Argente and C. Guarner, Endoscopy, 2014, 46, 851–856 CrossRef PubMed.
- P. Katsinelos, K. Fasoulas, G. Paroutoglou, G. Chatzimavroudis, A. Beltsis, S. Terzoudis, T. Katsinelos, E. Dimou, C. Zavos, A. Kaltsa and J. Kountouras, Endoscopy, 2012, 44, 53–59 CrossRef CAS PubMed.
- R. Liu, H. Qi, J. Wang, Y. Wang, L. Cui, Y. Wen and C. Yin, J. Gastroenterol. Hepatol., 2014, 29, 1328–1337 CrossRef CAS PubMed.
- H. J. Issaq, T. J. Waybright and T. D. Veenstra, Electrophoresis, 2011, 32, 967–975 CrossRef CAS PubMed.
- G. Mermelekas, M. Makridakis, T. Koeck and A. Vlahou, Expert Rev. Proteomics, 2013, 10, 537–549 CrossRef CAS PubMed.
- X. Chen, M. D. Sans, J. R. Strahler, A. Karnovsky, S. A. Ernst, G. Michailidis, P. C. Andrews and J. A. Williams, J. Proteome Res., 2010, 9, 885–896 CrossRef CAS PubMed.
- F. Dal Piaz, R. Cotugno, L. Lepore, A. Vassallo, N. Malafronte, G. Lauro, G. Bifulco, M. A. Belisario and N. De Tommasi, J. Proteomics, 2013, 82, 14–26 CrossRef CAS PubMed.
- C. J. Martyniuk, S. Alvarez and N. D. Denslow, Ecotoxicol. Environ. Saf., 2012, 76, 3–10 CrossRef CAS PubMed.
- X. Zhang, L. Xu, L. Yin, Y. Qi, Y. Xu, X. Han and J. Peng, Chem. Commun., 2015, 51, 11064–11067 RSC.
- J. Wang, L. Gao, Y. M. Lee, K. A. Kalesh, Y. S. Ong, J. Lim, J. E. Jee, H. Sun, S. S. Lee, Z. C. Hua and Q. Lin, Pharmacol. Ther., 2016, 162, 10–22 CrossRef CAS PubMed.
- L. Xu, Y. Wei, D. Dong, L. Yin, Y. Qi, X. Han, Y. Xu, Y. Zhao, K. Liu and J. Peng, RSC Adv., 2014, 4, 30704–30711 RSC.
- X. Pang, J. Liu, Y. Li, J. Zhao and X. Zhang, PLoS One, 2015, 10, e0131295 Search PubMed.
- S. K. Mishra, S. Tiwari, A. Shrivastava, S. Srivastava, G. K. Boudh, S. K. Chourasia, U. Chaturvedi, S. S. Mir, A. K. Saxena, G. Bhatia and V. Lakshmi, J. Nat. Med., 2014, 68, 363–371 CrossRef CAS PubMed.
- Q. Tang, S. Zhao, J. Wu, F. Zheng, L. Yang, J. Hu and S. S. Hann, Cell. Signalling, 2015, 27, 1469–1477 CrossRef CAS PubMed.
- X. P. Zhang, Z. F. Li, X. G. Liu, Y. T. Wu, J. X. Wang, K. M. Wang and Y. F. Zhou, World J. Gastroenterol., 2005, 11, 2095–2100 CrossRef CAS PubMed.
- Q. Ni, W. Zhang, K. Sun, C. Yin, J. An and D. Shang, Biomed. Rep., 2014, 2, 63–68 CAS.
- G. Wang, B. Sun, Y. Gao, Q. H. Meng and H. C. Jiang, Mediators Inflammation, 2007, 2007, 29638 Search PubMed.
- D. Yadav, M. O'Connell and G. I. Papachristou, Am. J. Gastroenterol., 2012, 107, 1096–1103 CrossRef PubMed.
- B. U. Wu and P. A. Banks, Gastroenterology, 2013, 144, 1272–1281 CrossRef PubMed.
- P. A. Banks, T. L. Bollen, C. Dervenis, H. G. Gooszen, C. D. Johnson, M. G. Sarr, G. G. Tsiotos and S. S. Vege, Gut, 2013, 62, 102–111 CrossRef PubMed.
- Z. W. Yang, X. X. Meng and P. Xu, J. Cell. Mol. Med., 2015, 19, 2513–2520 CrossRef CAS PubMed.
- G. Perides, G. J. van Acker, J. M. Laukkarinen and M. L. Steer, Nat. Protoc., 2010, 5, 335–341 CrossRef CAS PubMed.
- G. Capurso, G. Zerboni, M. Signoretti, R. Valente, S. Stigliano, M. Piciucchi and G. Delle Fave, J. Clin. Gastroenterol., 2012, 46, S46–S51 CrossRef PubMed.
- G. I. Papachristou, World J. Gastroenterol., 2008, 14, 6273–6275 CrossRef PubMed.
- S. B. Choi, G. S. Bae, I. J. Jo, S. Wang, H. J. Song and S. J. Park, Mol. Immunol., 2016, 74, 27–38 CrossRef CAS PubMed.
- Y. Y. Cen, C. Liu, X. L. Li, Z. F. Yan, M. Kuang, Y. J. Su, X. C. Pan, R. X. Qin, X. Liu, J. Zheng and H. Zhou, Int. Immunopharmacol., 2016, 38, 252–260 CrossRef CAS PubMed.
- J. A. Williams, Pancreas, 2013, 42, 905–911 CrossRef CAS PubMed.
- D. Cecconi, M. Palmieri and M. Donadelli, Proteomics, 2011, 11, 816–828 CrossRef CAS PubMed.
- Z. Li, M. Lu, J. Chu, X. Qiao, X. Meng, B. Sun, W. Zhang and D. Xue, et al., Pancreatology, 2012, 12, 248–256 CrossRef CAS PubMed.
- U. Friedrich, S. Datta, T. Schubert, K. Plossl, M. Schneider, F. Grassmann, R. Fuchshofer, K. J. Tiefenbach, G. Langst and B. H. Weber, Hum. Mol. Genet., 2015, 24, 6361–6373 CrossRef CAS PubMed.
- A. N. Tiaden, G. Bahrenberg, A. Mirsaidi, S. Glanz, M. Bluher and P. J. Richards, Stem Cells, 2016, 34, 1601–1614 CrossRef CAS PubMed.
- S. Poepsel, A. Sprengel, B. Sacca, F. Kaschani, M. Kaiser, C. Gatsogiannis, S. Raunser, T. Clausen and M. Ehrmann, Nat. Chem. Biol., 2015, 11, 862–869 CrossRef CAS PubMed.
- A. N. Tiaden, M. Breiden, A. Mirsaidi, F. A. Weber, G. Bahrenberg, S. Glanz, P. Cinelli, M. Ehrmann and P. J. Richards, Stem Cells, 2012, 30, 2271–2282 CrossRef CAS PubMed.
- K. Hara, A. Shiga, T. Fukutake, H. Nozaki, A. Miyashita, A. Yokoseki, H. Kawata, A. Koyama, K. Arima, T. Takahashi, M. Ikeda, H. Shiota, M. Tamura, Y. Shimoe, M. Hirayama, T. Arisato, S. Yanagawa, A. Tanaka, I. Nakano, S. Ikeda, Y. Yoshida, T. Yamamoto, T. Ikeuchi, R. Kuwano, M. Nishizawa, S. Tsuji and O. Onodera, N. Engl. J. Med., 2009, 360, 1729–1739 CrossRef CAS PubMed.
- R. Rani, A. G. Smulian, D. R. Greaves, S. P. Hogan and D. R. Herbert, Eur. J. Immunol., 2011, 41, 2000–2009 CrossRef CAS PubMed.
- M. Li, Y. Li, X. Liu, X. Gao and Y. Wang, J. Neuroimmunol., 2012, 247, 25–31 CrossRef CAS PubMed.
- D. G. Eeles, J. M. Hodge, P. P. Singh, J. A. Schuijers, B. L. Grills, M. T. Gillespie, D. E. Myers and J. M. Quinn, Mol. Cell. Endocrinol., 2015, 399, 259–266 CrossRef CAS PubMed.
- M. Komai-Koma, E. Wang, M. Kurowska-Stolarska, D. Li, C. McSharry and D. Xu, Immunobiology, 2016, 221, 412–417 CrossRef CAS PubMed.
- R. Saluja, T. Hawro, J. Eberle, M. K. Church and M. Maurer, J. Biol. Regul. Homeostatic Agents, 2014, 28, 575–585 CAS.
- M. Funakoshi-Tago, K. Tago, M. Hayakawa, S. Tominaga, T. Ohshio, Y. Sonoda and T. Kasahara, Cell. Signalling, 2008, 20, 1679–1686 CrossRef CAS PubMed.
- L. Wu, B. Cai, S. Zheng, X. Liu, H. Cai and H. Li, Inflammation, 2013, 36, 1020–1029 CrossRef CAS PubMed.
- X. M. Xia, B. K. Li, S. M. Xing and H. L. Ruan, World J. Gastroenterol., 2012, 18, 2132–2139 CrossRef CAS PubMed.
Footnote |
| † Electronic supplementary information (ESI) available. See DOI: 10.1039/c6ra16446c |
|
| This journal is © The Royal Society of Chemistry 2016 |
Click here to see how this site uses Cookies. View our privacy policy here.