Lipid production by Yarrowia lipolytica grown on biodiesel-derived crude glycerol: optimization of growth parameters and their effects on the fermentation efficiency

Magdouli Saraa, Satinder Kaur Brarb and Jean François Blais*c
aInstitut national de la recherche scientifique (Centre Eau, Terre et Environnement), Université du Québec, 490 rue de la Couronne, Québec, Qc, Canada G1K 9A9. E-mail: magdouli.sara@ete.inrs.ca; Fax: +1 418 654 2600; Tel: +1 418 654 4677
bInstitut national de la recherche scientifique (Centre Eau, Terre et Environnement), Université du Québec, 490 rue de la Couronne, Québec, Qc, Canada G1K 9A9. E-mail: satinder.brar@ete.inrs.ca; Fax: +1 418 654 2600; Tel: +1 418 654 3116
cInstitut national de la recherche scientifique (Centre Eau, Terre et Environnement), Université du Québec, 490 rue de la Couronne, Québec, Qc, Canada G1K 9A9. E-mail: blaisjf@ete.inrs.ca; Fax: +1 418 654 2600; Tel: +1 418 654 2575

Received 24th June 2016 , Accepted 14th September 2016

First published on 15th September 2016


Abstract

Yarrowia lipolytica, a well-known oleaginous strain for single cell oil (SCO) production was grown in nitrogen-limited flask cultures. The effect of increasing the initial crude glycerol and nitrogen concentration was studied along the fermentation process. Significant biomass and SCO production was reported with a high initial glycerol concentration of 89 g L−1 and 0.54 g NH4OH per L during 6 h. Optimized culture conditions were tested using a 5 L fermenter during two-stage cultivation with a dissolved oxygen shift from 60% to 30% of dissolved oxygen corresponding to 50–80 h−1. Lipid concentration of 13.6 ± 0.8 g L−1 and lipid content 52.7 ± 1.2% (w/w of dry biomass) was obtained which is higher compared with literature values for Yarrowia species grown on crude glycerol based media. The yeast lipids contained mainly oleic, palmitic, linoleic and stearic acids which could serve as perfect precursors for the synthesis of biodiesel.

1 Introduction

Biodiesel has gained interest in recent years due to its contribution to minimizing the dependence on fossils fuels, especially in the transportation sector. Moreover, biodiesel is known to be a biodegradable, sustainable, renewable and non-toxic fuel. It is reported to reduce sulfur and carbon dioxide emissions compared to fossil fuels.1,2 Recently, it was estimated that the biodiesel market will reach 37 billion gallons by 2016 with an annual growth of 42% which is indirectly producing 4 billion gallons of crude glycerol as a by-product. Crude glycerol of 10 kg will be produced from 100 kg of biodiesel.3,4 Plants oils, e.g., jatropha, corn and canola were reported to produce biodiesel. However, these vegetable oils cannot meet the huge demand of utilization and does not contribute to global energy security. Therefore, oleaginous microorganisms that are reported to produce single cells oils in the presence of high carbon source and a low nitrogenous source represented potential candidates.5,6 These microorganisms offer advantages to grow faster than higher plants and do not require land. Likewise, a significant number of reports, appearing in most cases in the past few years, indicates the potential of heterotrophic microorganisms to convert crude glycerol into added-value products, such as microbial lipids (also called single cell oils, SCOs) citric acid, microbial mass, enzymes and polyols.7–11 Moreover, oleaginous microorganisms are efficient lipid producers in the presence of a waste (zero energy).12,13 Among natively oleaginous microorganisms, Yarrowia lipolytica, is one of the most extensively studied “non-conventional” yeasts due to its biotechnological potential and the availability of genetic tools aiming for the production and the storage of large amounts of lipid. Accordingly, wild Yarrowia lipolytica has been reported to accumulate up to 36% of dry weight from glucose and more than 50% in the presence of hydrophobic substrates.14,15 In contrast, metabolically engineered strains can achieve more than 90% of dry weight.16 In addition to SCO production, Yarrowia species are reported to secrete various secondary metabolites, such as citric acid (CA),10,11,17,18 extracellular enzymes19,20 and other functional fatty acids of commercial interest such as lipid-derived neutraceuticals and pharmaceuticals using genetically engineered strains.9

Several applied studies have focused on increasing SCO production through increasing the overflow of carbon sources. Among common substrates, glucose was widely investigated,21 however, this latter competes directly with food and feed production, which is not the case for other sources.22 Accordingly, glycerol is known to have a greater degree of reduction than other carbohydrates and is less costly and more readily available. Due to carbon rich composition.23,24 In yeast, the glycolytic pathway produces intermediate compounds from glycerol either via the phosphorylation pathway25,26 or the oxidative pathway (dehydrogenation of glycerol and the subsequent phosphorylation of the reaction product)27 and almost exclusive synthesis of reduced products during glycerol fermentation reflects the highly reducible state of glycerol. Additionally, glycerol may be readily incorporated in the core of triglycerides, which are stored in lipid bodies along with steryl esters.28 Besides, others studies focused on refining the production process by identifying optimal culture conditions and defining optimal medium composition.29–31 In this regard, physiological conditions, such as pH, temperature and oxygen concentrations, have also been shown to influence the lipid composition.32,33 Taken together, the aim of the current study was to investigate the potential of biodiesel-derived waste glycerol conversion into metabolic compounds of added-value (SCOs) by yeast strain. After an initial selection, the yeast strains were cultivated on biodiesel-derived waste glycerol utilized as a carbon source under nitrogen-limited conditions (conditions that favour the accumulation of storage lipid by microorganisms). The effect of glycerol and NH4OH concentration and fermentation time and identification of the most appropriate production conditions, and characterization of the produced lipids was carried out.

2 Materials and methods

2.1 Strain and culture conditions

Y. lipolytica SM7, isolated from woody forest (Alma, Canada) in a glycerol enriched medium (GEM) composed of 1 g of woody forest soil and 100 g pure glycerol per L, 0.3 g yeast extract per L, 1 g KH2PO4 per L, 0.5 g MgSO4·7H2O per L. Enrichment was performed at 28 °C at 180 rpm in 48 h. After that, a serial of decimal dilutions was performed to select strains having the capacity to grow on high rich carbon media. The quantitative selection was based on Nile Red staining. Strains having maximum of lipids droplets were of wide interest in the current study. The newly-isolated strain was identified by means of genetic tools. The genomic identification was based on ribosomal 5.8 s sequencing. PCR amplification yielded a 332-bp sequence and rDNA sequence data was subjected to a BLAST search tool of NCBI. Homology results showed that Y. lipolytica SM7 has around 99% sequence similarity with Yarrowia lipolytica. In this regard, Y. lipolytica SM7 (gene bank accession KF908251) was selected and its capacity to produce lipids in crude glycerol based media was optimised in the present study. The strain was grown on YEPD agar (yeast extract peptone dextrose agar) at 28 °C for 2 days, maintained at 4 °C and sub-cultured every three months.

The pre-culture was obtained by inoculating a separate colony of Y. lipolytica SM7 in yeast extract peptone dextrose (YPD) medium containing (g L−1): glucose 20, peptone 20 and yeast extract 10 and incubating it at 28 °C for 24 h prior to cultivation. Lipid production was performed in duplicates, aerobically, in 2 L Erlenmeyer flasks containing 500 mL of the designed media (crude glycerol, 1 g yeast extract per L, 3 g K2HPO4 per L, 3 g NaH2PO4·H2O per L, 0.5 g MgSO4·7H2O per L, 0.040 g ZnSO4·7H2O per L, 0.016 g FeSO4·7H2O per L, 0.25 μg L−1 biotin) and inoculated with the pre-culture (initial OD 600 = 0.01), 5% (v/v) and incubated at 28 °C in a rotary shaker incubator, under agitation of 180 rpm. Ammonium hydroxide (NH4OH, 29%, v/v) was used as nitrogenous source and pH was re-adjusted in all solutions by using NaOH and H2SO4 4 N. Crude glycerol was provided by Rothsay (Ontario, Canada), this latter was used as carbon source resulted from the transesterification of animal fats, its characterization was presented in Table 1. Its high composition of glycerol and low quantities of impurities such soap and salts makes this waste a very potential carbon source for lipid accumulation.

Table 1 Characteristics of crude glycerol waste
Parameters Method Value Unit
Moisture (Karl Fisher) D 4928 8.83 %
pH Digital pH-meter 3.53
Density at 15 °C Hydrometer 1.264 g mL−1
Glycerol concentration ASTM D7637-10 83.38 %
Methanol Rotary evaporator 1.5 %


2.2 Glycerol and metabolites analysis

For the measurement of glycerol and others organics acids in the broth, LC/MS/MS technique was employed. The technical details of the LC/MS/MS instrument used for the analysis were: (a) for sugar estimation: Thermo TSQ Quantum model, equipped with an Electrospray Ionization (ESI) in negative ion mode; Zorbax Carbohydrate (4.6 mm, 150 mm, 5 mm, Agilent) analytical column; 75% acetonitrile; 0.1% NH4OH; 25% water and 0.1% NH4OH mobile phase and 10 mL injection volume. Glycerol, citric acid, malic acid, (all from Sigma) was used as the internal standards; and (b) for phenolic compound estimation: Thermo TSQ Quantum model, equipped with an Electrospray Ionization (ESI) in negative ion mode, Thermo Scientific Beta Basic C18 LC column (100 mm, 2.1 mm, 3 mm); mobile phase of methanol and acidified water (0.1% acetic acid) at a ratio of 17.5[thin space (1/6-em)]:[thin space (1/6-em)]82.5; flow rate of 0.3 mL min−1 and 20 mL injection volume.

2.3 Biomass determination and lipid extraction

Samples were collected by centrifugation at 5000 × g for 15 min. The resulting pellet was washed once, frozen and lyophilized to a constant mass. The extraction of total cellular lipids was performed according to Folch method.34 Five hundred milligrams of lyophilized cells were suspended in methanol/chloroform (2[thin space (1/6-em)]:[thin space (1/6-em)]1, v/v). After the first extraction, the remaining cell lipids were further extracted twice with methanol/chloroform (1[thin space (1/6-em)]:[thin space (1/6-em)]1, v/v); and then with methanol/chloroform (1[thin space (1/6-em)]:[thin space (1/6-em)]2, v/v). Resulted organic phases were mixed and washed twice with 0.88% (w/v) KCl solution for 10 min and centrifuged for 5 min at 10[thin space (1/6-em)]000 × g. Solvent phase was withdrawn and transferred into a pre-weighed glass vial (W1). Lipids were recovered as dry material after the evaporation of the solvent at 60 ± 1 °C, until a constant weight was obtained (W2). The lipid quantity was calculated by the difference between two vials (W2 and W1). The lipid content in the dry biomass was reported to be the difference between two vials extracted/500 mg × 100%. Finally, the obtained lipid was stored in dark at 4 °C for further transesterification study.

2.4 Lipid analysis and fatty acid composition

Fatty acid profile of the lipid was determined by methylation for conversion of fatty acids to fatty acid methyl esters (FAMES). The lipids (0.01–0.1 g) obtained were first dissolved in hexane (50 mL hexane/g lipid), then mixed with methanol. Lipid to methanol molar ratio was 1[thin space (1/6-em)]:[thin space (1/6-em)]6 (0.3 mL methanol per gram lipid). Sodium hydroxide was used as catalyst with concentration of 1% w/w (NaOH/oil). The mixture was then heated at 55 ± 1 °C for 2 h. After reaction, 5% NaCl solution was added to 100 mL per gram lipid, and then FAMEs was extracted by two times washing with hexane (100 mL per gram lipid). After washing, the mixture was allowed to stand for phase separation, and later hexane phase (upper layer) was collected. The FAMEs in hexane was washed with 2% (w/v) sodium bicarbonate solution (20 mL per gram lipid), and the top layer was then dried at 60 ± 1 °C in an oven.35 The FAMEs in hexane were analyzed using Gas Chromatography-Mass Spectroscopy (GC-MS) (Perkin Elmer, Clarus 500). The dimensions of the column used were 30 m × 0.25 mm, with a phase thickness of 0.25 μm. The calibration curve was prepared with a mixture comprising 37 FAMEs (47885-U, 37 Component FAME Mix; Supelco, Bellefonte, PA, USA). 1,3-Dichlorobenzene was also used as an internal standard. All experiments were performed in triplicates, and average results were reported with standard deviation less than 5%.

2.5 Optimization study

Box–Behnken model was used for experimental design to optimize key process parameters for enhanced lipid production. Box–Behnken design offers advantages in requiring fewer experimental runs and is rotatable if the variance of the predicted response at any point x depends only on the distance of x from the design center point. The 3K factorial design also allows efficient estimation of second degree quadratic polynomials and obtains the combination of values that optimizes the response within the region of the three dimensional observation space.36 In developing the regression equation, the relation between the coded values and actual values can be described by the following equation: where xi is the coded value of the independent variable, Xi is the uncoded value of the its independent variable, X is the uncoded value of the independent variable at the center point, and DXi is the step change value. The levels of the variables and the experimental design are shown in Table 1. Lipid concentration was associated with simultaneous changes in glycerol concentration (75, 87.5 and 100 g L−1), ammonium hydroxide concentration (0.5, 1.0 and 1.5 g L−1) and incubation time (36, 52 and 72 h). A total of seventeen experimental runs decided by the 3K factorial Box–Behnken design were carried out, and the center point was replicated three times to estimate experimental errors. For predicting the optimal conditions, the quadratic polynomial equation was fitted to correlate the relationship between variables and response (i.e. lipid concentration), and estimated with the following eqn (1):
 
Y = β0 ± ∑βiXi ± βijXiXj ± ∑βiiXi2 (1)
where; Y is the predicted response; β0 the intercept, βi is the linear coefficient, βij the quadratic coefficient, βii is the linear-by-linear interaction between Xi and Xj regression coefficients and Xi, Xj are input variables that influence the response variable Y. The levels of the variables and the experimental design are shown in Table 2.
Table 2 Growth of Y. lipolytica SM7 in shake flasks and conversion yields in different initial glycerol concentration. Representations of initial substrate (S0); remaining substrate (S); glycerol consumed (Sconsumed)a
S0 (g L−1) Fermentation time (h) S (g L−1) Sconsumed (%) X (g L−1) L (g L−1) P/X (%) CA (g L−1) YX/S YL/S YCA/S
a Biomass produced (X); lipid content (P/X, % (w/w)) of dry biomass; lipid quantity (L, g L−1), citric acid produced (CA); and conversion yields (YX/S, YL/S, YCA/S) at different fermentation time. Culture conditions: pH = 6.5 ± 0.03; incubation temperature = 28 °C; agitation rate = 180 rpm; for initial glycerol concentration 75, 87.5 and 100 g L−1, respectively.
75 36 25.5 ± 1.5 66.0 ± 2.5 4.57 ± 0.8 1.10 ± 0.1 24.1 ± 0.2 0.50 ± 0.2 0.09 ± 0.01 0.01 ± 0.5 0.010 ± 0.01
54 16.0 ± 2.7 78.7 ± 2.0 6.70 ± 0.6 3.30 ± 0.2 49.3 ± 1.2 2.5 ± 1.1 0.11 ± 0.11 0.04 ± 0.3 0.042 ± 0.02
72 8.2 ± 1.2 89.1 ± 2.1 8.70 ± 0.2 3.82[thin space (1/6-em)]±[thin space (1/6-em)]0.3 44.0 ± 0.8 3.80 ± 0.9 0.13 ± 0.01 0.04 ± 0.2 0.056 ± 0.02
87.5 36 28.5 ± 3.2 67.4 ± 1.5 4.89 ± 0.5 1.40 ± 0.3 28.7 ± 0.5 0.5 ± 0.2 0.08 ± 0.02 0.02 ± 0.1 0.008 ± 0.5
54 13.0 ± 1.8 85.1 ± 2.2 6.90 ± 0.3 3.13 ± 0.3 45.4 ± 1.9 2.35 ± 0.5 0.09 ± 0.01 0.04 ± 0.01 0.031 ± 0.08
72 4.3 ± 0.9 95.1 ± 1.8 9.40 ± 1.1 4.72 ± 0.4 50.2 ± 1.5 4.0 ± 1.3 0.11 ± 0.09 0.05 ± 0.2 0.048 ± 0.02
100 36 77.4 ± 2.2 22.6 ± 3.1 5.13 ± 0.9 1.41 ± 0.1 27.7 ± 0.7 0.5 ± 0.3 0.22 ± 0.07 0.06 ± 0.3 0.022 ± 0.1
54 70.3 ± 5.4 29.7 ± 2.8 8.12 ± 0.8 4.35 ± 0.1 53.7 ± 1.2 5.63 ± 1.7 0.27 ± 0.1 0.14 ± 0.2 0.18 ± 0.08
72 45.1 ± 3.3 54.9 ± 2.2 9.84 ± 0.6 4.74 ± 0.1 48.2 ± 1.8 12.0 ± 2.5 0.17 ± 0.1 0.08 ± 0.4 0.21 ± 0.08


The goodness of fit of the regression model was evaluated using the coefficient of determination (R2) and the analysis of variance (ANOVA). For tested variable, the quadratic model was represented as contour plots (3D) and response surface curves were generated using Design-Expert Software.

To evaluate the RSM optimized culture parameters, fermentation was conducted in 5 L fermenter (Biostat B plus, Sartorius Stedim Biotech, Allemagne) to assess lipid production in crude glycerol based media. Polarographic pH-electrode (Mettler Toledo, USA) was calibrated using buffers of pH 4 and 7 (VWR, Canada). Before sterilization cycle. The oxygen probe was calibrated to zero (using sodium thiosulfate water) and 100% (air saturated water). Propylene glycol (Sigma-Canada) as an anti-foam agent. The fermenter with the medium was then sterilized in situ at 121 °C for 20 min. After the fermenter cooled down to 28 °C, DO probe was recalibrated to zero and 100% saturation by sparging N2 gas and air, respectively, at agitation rate of 250 rpm. The pH of the fermenter solution was adjusted to 6.5 with 4 N H2SO4. Thereafter, sterilized crude glycerol (83% w/v) and mineral solution was transferred to the fermenter as carbon source under aseptic condition. Agitation was provided to mix the solution, after mixing, pre-culture of Y. lipolytica was added to the fermenter.

2.6 Morphological study

Cells were analyzed by scanning electron microscopy (SEM, Carl Zeiss EVO® 50) to have a highly magnified view of the surface morphology and the behavior of cells during lipogenesis. To prepare samples for SEM, cells were dried using lyophilizer (VirTis Virtual 50 L pilot lyophilizer). Dried samples were directly mounted on a SEM grid and sputter coated (SPI Module Sputter Coater) with gold before SEM analysis.

3 Results and discussion

3.1 Evaluation of growth parameters

Despite the higher concentrations reported in the presence of hydrophobic substrates,14,15 scarce information was available for hydrophilic carbon sources. The recent data is related to Polburee (2015, 2016) who described the growth of Rhodosporidium toruloides on biodiesel-derived crude glycerol with the aim to obtain high lipid content up to 63.8% of dry biomass with a lipid concentration of 8.99 g L−1 and a lipid yield of 0.16 g g−1.23,37

For Y. lipolytica, most of the relevant literature emphasized the importance of fatty materials as low cost substrates to produce SCO and other “tailor-made” lipids, such as cocoa-butter substitutes (CBS), illipé substitutes, shea butter, sal fat.38–40 Studies have revealed that Y. lipolytica is primordially a citric acid producer.10,11,41 Moreover, Cescut has reported that the lipid accumulation in this yeast is a metabolic balance between citric acid production and triglyceride (TAG) synthesis42 and the shift from growth phase and CA production phase (i.e. lipogenesis phase) is not well understood and more research should be performed to study their concomitance. Taken together, the present study investigated whether low-cost raw materials, such as crude glycerol and nitrogenous source, such as NH4OH could enhance the lipid accumulation and CA production. Experiments showed that varying glycerol concentration from 75 to 100 g L−1 with the variation of NH4OH yielded highest biomass and lipid production (Table 3).

Table 3 Coded values and levels of experimental factors
Factor Symbol Code levels
−1 0 +1
Glycerol concentration X1 75 87.5 100
NH4OH X2 0.5 1 1.5
Fermentation time X3 36 54 72


Herein, both of organic and inorganic nitrogen sources were employed; inorganic one favored mostly product formation (lipid in the present case) rather than the biomass, whereas the organic nitrogen favored biomass and product (lipid) accumulation.17,28,43,44 Due to this reason, both organic (yeast extract) and inorganic nitrogen source (NH4OH) were used. Moreover, the lipid production was defined to be the product of lipid content and biomass.

Based on the above information presented in Table 3, the optimization of the whole process via RSM method was required to maximize the biomass and the lipid concentration and to lower the CA production. Thus, when ammonium nitrogen was depleted, some quantities of stored lipids and CA were synthesized (Table 3). Following lipogenic phase, glycerol was predominantly converted into cellular lipid, while smaller quantity of CA was secreted in the growth environment (0.5–4.0 g L−1), especially in the culture of initial glycerol concentration of 75 and 87.5 g L−1. A higher concentration of CA was observed in the presence of higher glycerol concentration 100 g L−1 and reached around 12.0 ± 2.5 g L−1.

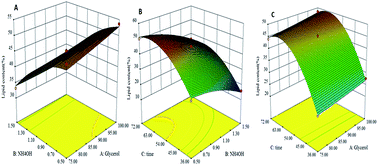
Surface curves plots between binary reactions are presented in Fig. 1. The variation of glycerol concentration, ammonium hydroxide concentration and fermentation time have been reported to have higher impact on lipid production and growth kinetics parameters. The variance analysis and the estimation of parameters by the Design-Expert software, is illustrated in Table 4. The p-value was used to evaluate the significance of the variable. When the p-value of the variable was less than 5%, it represented that the variable had significant effects on the response value. To further assess the effect of the variable, coefficient estimate was applied. Lipid production could increase with increasing concentrations of glycerol, if the coefficient estimate were positive. Conversely, the value of coefficient estimate was negative, indicating that lipid production was negatively correlated with the variable levels. As shown in Table 4, ammonium hydroxide concentration had significant effect on the lipid production (p value < 0.0001). With increasing glycerol concentration and lowering nitrogenous source concentration from 0.5 to 1.5 g L−1, the cellular lipid content in Y. lipolytica increased evidently where the p-value was less than 0.0001. Therefore, lipid production was observed to be more with the lower nitrogen and higher glycerol concentration. So far, various studies have been carried out to demonstrate that the effect of glycerol concentration on lipid accumulation in many oleaginous strains which is determined by concentration of carbon and nitrogen (C/N molar ratio). Thus, oleaginous potential is critically affected by the C/N ratio of the culture and other factors like aeration, inorganic salt presence, etc.33,45,46 Similar results have been presented by Karanth and Sattur (1991), who found that lipid production in batch fermentation was similar for initial sugar concentrations of 60 and 80 g L−1.47 Regarding the influence of the initial nitrogen content, at high C/N ratios, the lipid production was shifted to the end of cultivation. Normally an opposite pattern could be anticipated, since lower nitrogen levels would suggest an early shift to lipid synthesis. Most authors recommend a C/N close to 100 as ideal for lipid accumulation.48–50 In the present study, a C/N ratio of 75 is observed to enhance the biomass production and the lipid around, 25 ± 1.2 g L−1 and 52% (w/w) of dry biomass, respectively, which is reported also to be closer to the C/N ratio 70 for oleaginous and non-oleaginous.51 The C/N ratio was calculated based on the carbon present in the glycerol (39% w/w) and the nitrogen present in the yeast extract approximately (12% w/w).


image file: c6ra16382c-f1.tif
Fig. 1 Response surface plots showing binary interaction of different variables. The interaction between (A) NH4OH concentration and glycerol concentration, (B) glycerol concentration and fermentation time, (C) fermentation time and glycerol concentration.
Table 4 Statistical analysis of experimental design
Source Sum of squares df Mean square F value p-value prob > F
Model 1791.2 9 199.02 83.324 <0.0001
A-Glycerol 17.287 1 17.287 7.2375 0.0311
B-NH4OH 504.83 1 504.83 211.35 <0.0001
C-Time 848.93 1 848.93 355.41 <0.0001
AB 5.3824 1 5.3824 2.2534 0.1770
AC 0.1156 1 0.1156 0.0484 0.8322
BC 0.3906 1 0.3906 0.1635 0.6980
A^2 0.1476 1 0.1476 0.0618 0.8108
B^2 38.281 1 38.281 16.027 0.0052
C^2 361.45 1 361.45 151.33 <0.0001
Residual 16.720 7 2.3886    
Lack of fit 15.472 3 5.1573 16.532 0.0102
Pure error 1.2479 4 0.3120    


When glycerol concentration was 87.5 g L−1 with C/N ratio 112.5, lipid content varied between 40.5 to 45.3% (w/w) of dry biomass. Therefore, increasing glycerol concentration and lowering nitrogen amount would increase remarkably the lipid content inside the cells.

Moreover, for Cryptococcus sp., the highest content of lipids was measured at a C/N ratio of 60–90 and a nitrogen concentration of 0.2% with 60–57% lipids of the dry biomass.52 Furthermore, fermentation time had a positive effect, inducing higher lipid accumulation in cells. Additionally, fermentation time was also identified as a significant factor for lipid production. It was obvious that increasing the fermentation time could dramatically promote the growth rate of Y. lipolytica (p-value lower than 0.0001). The lipid production was improved with fermentation time which accounted for 10.3% (coefficient estimation) of the total contribution. This was in agreement with previous reports that confirmed that higher the fermentation time, more the lipid synthesis is enhanced, however, the time should not exceed the recommended value of 66 h as degradation of lipid occurred after 66 h.53 When nutrients are no longer provided by the medium, lipids stored will be mobilized by TAG lipases and hydrolases to serve as carbon source to maintain the growth of Y. lipolytica. In general, microorganisms consume their accumulated lipids mainly through the glyoxylate bypass pathway, and, more specifically, different microbes might preferentially consume different kinds of fatty acids to maintain their growth.39

In order to check the fit of the model, R2 and F-value were calculated. Here, R2 was 0.9907, indicating that 99.07% of the data in Box–Behnken design could be explained by the model; that is, the proposed model was reasonable. Moreover, the model F-value of 83.32 demonstrated that the model was significant, as revealed by a p-value lower than 0.0001, which further supported that the model fitted in to these data. From the analysis of Radj2 and Rpred2, the Rpred2 of 0.861 was in good agreement with the Radj2 of 0.978.

Based on the previous results, Box–Behnken design was used to further confirm the optimum growth factors of glycerol concentration, nitrogen concentration and fermentation time to maximize lipid production. In order to investigate the adequacy of the model, multiple regression analyses on the data were applied. The results are listed in Table 4, which were mainly the individual and the binary effects of all variables and their interactions on lipid production. The multiple correlation coefficient R2 of 0.990 suggested that the quadratic polynomial model was suitable for revealing the mutual relationship of factors and predicting the response values in the study.

According to the attained results and the equation, the model predicted the maximum lipid production by eqn (2).

 
Lipid content = −81.046 ± 0.0527 × glycerol + 26.350 × NH4OH + 3.6293 × time − 0.1856 × glycerol × NH4OH + 0.0008 × glycerol × time + 0.0347 × NH4OH × time + 0.0012 × glycerol2 − 12.061 × NH4OH2 − 0.0286 × time2 (2)

The sign of the coefficient of each term indicates the influence of this term on the response, for instance, from eqn (2) it can be observed that NH4OH has a positive effect on lipid production (coefficient: +26.34). Besides, lipid production is very influenced by the fermentation time (+3.62), while glycerol concentration has a very low impact (0.05).

3.2 Identifying the best culture conditions for higher lipid production

Under the optimum conditions, (glycerol concentration was fixed to 89 g L−1 and ammonium hydroxide to 0.54 g L−1 during 66 h), the biomass and lipid content were 25.0 ± 1.5 g L−1 and 52.7 ± 1.2% (w/w of dry biomass), which was increased by 64% and 20% compared to shake flask under no controlled conditions (9.3 ± 1.1 g L−1 and 43.5 ± 0.8 (% w/w of dry biomass)). The observed lipid production was 52.7 ± 1.2 (% w/w of dry biomass), agreeing well with the predicted values 53.1% (w/w of dry biomass), indicating that the model was valid. Table 5 presented the reported yields of lipid production in many Yarrowia species. Herein, the selected strain presented as a potential candidate for lipid production in the presence of crude glycerol in terms of tolerating higher glycerol concentration up to 100 g L−1 compared to other oleaginous strains where higher concentration is the threshold. For instance, Meesters et al. (1996) observed that, in Cryptococcus curvatus, cell growth was restricted during lipid accumulation when glycerol concentrations were higher than 64 g L−1 and the optimum of glycerol was fixed to be 16 g L−1 with a maximum specific growth rate of 0.43 h−1.54
Table 5 Experimental results of Y. lipolytica strains cultivated on glycerol-based media for producing microbial lipids
Strains Biomass (g L−1) Lipid (% w/w) References
Y. lipolytica SM7 25 52.6 This study
Y. lipolytica ACA-DC 50109 11.4 29.8 74
Y. lipolytica TISTR 5151 5.5 50.8 75
Y. lipolytica ACA-DC 50109 4.7 23.1 31
Y. lipolytica MUCL 28849 41 34.6 64
Y. lipolytica NCYC 3825 42.0 30.9 76


Accordingly, higher glycerol above 60 g L−1 is responsible to induce higher osmotic pressure which could inhibit the oxygen uptake or create high osmotic pressure sufficient to inhibit culture growth in other strains.13,28,54

However, recent study of Papanikolaou et al. (2008) has demonstrated that Y. lipolytica ACA-DC 50109 was tolerating higher concentration of glycerol up to 164 g L−1 with a maximum biomass concentration of 7.4 g L−1, with slight inhibition of the microbial growth was observed and the maximum specific growth rate of around 0.16 h−1.18 More often, Rymowicz et al. (2006) have found that Y. lipolytica mutants can be cultivated in the presence of raw glycerol at extremely high concentrations (i.e. 200 g L−1) and can achieve efficient cell growth ranging from 16.5–26.5 g L−1.55 These observations confirmed that glycerol tolerance using oleaginous microorganisms feature is strain dependant, and the concentration of carbon source should be adjusted accordingly to produce higher yields of CA and SCO. Moreover, Karamerou et al. (2016) have proved that higher concentrations of glycerol had neither a positive nor a negative effect on growth of Rhodotorula glutinis and the microorganism could sustain higher glycerol concentrations up to 150 g L−1, meanwhile, around 60 g L−1 of crude glycerol was easily assimilated by the cells and was required to obtain around 29.8% (w/w) of dry biomass, however, lower glycerol concentration of 30 g L−1 favored effective cell growth 5.28 g L−1.56 Thus, higher glycerol concentrations induced the accumulation of lipids by suppressing cellular growth.

Taken together, the inhibition affected generally the glycerol conversion rate (Table 3), so that higher the initial crude glycerol, lower the conversion, which was also confirmed by Tchaerou et al. (2015), who deduced that high initial crude glycerol concentration (180 g L−1) led to lower glycerol conversion in Rhodosporidium toruloides. However, the decrease in growth resulted in oil production (54% w/w of dry biomass compared to 40% (w/w) at 120 g L−1).

Moreover, the analysis of nitrogen concentration showed that ammonium units start to deplete after 16 h (Fig. 3). Initial nitrogen concentration was around 600 mg L−1 and after 16 h, remaining concentration was constant (70–100 mg L−1) during entire fermentation. This limitation of nitrogen in the media will trigger the pathway towards lipid biosynthesis, in fact, yeast required nitrogen which is furnished by ammonium hydroxide during the growth phase, in contrast to lipogenic phase. Nitrogen at 0.014 g L−1 has been found to be the critical concentration reported by Cescut (2009) to enhance lipid synthesis.42 In this study, limiting concentrations of nitrogen in around 70 mg L−1 into the medium lead to the induction of lipid accumulation.


image file: c6ra16382c-f2.tif
Fig. 2 Lipid accumulation of Y. lipolytica SM7 over the course of fermentation time. Arrowhead denotes typical bud scarring, (A) and (C) corresponds to the accumulation stage, (B) and (D) corresponds to an early depletion stage.

image file: c6ra16382c-f3.tif
Fig. 3 Time course of cell growth and lipid accumulation with Y. lipolytica. Culture was performed in the original optimized medium on 89 g crude glycerol per L, 0.54 g NH4OH per L, pH = 6.5 ± 0.3, temperature = 28 ± 1 °C.

Thus, the reduction of ammonium concentration activated the ATP citrate lyase enzyme, so that nitrogen limitation could activate diacylglycerol acyltransferase, which converted acyl-CoA to triglyceride (TAG)57 and this point was noted to be a separating phase between growth and lipogenic phase. Lipid concentration started at this stage with a concomitant increase of biomass concentration. Maximum specific growth rate was around 0.15 h−1 during the first stage of growth 12 h. Thus, to distinguish between both phases, the calculation of growth parameters was required and the analysis of nitrogen concentration was analyzed. Nitrogen source started to deplete from 16 h, afterwards, the nitrogen concentration was almost constant along the fermentation.

Besides, transition between growth phase and citric acid production is accompanied by morphological changes. In the first stage of growth phase, Nile Red lipid staining revealed that lipid bodies are small and make up very little of the intracellular space at 12 h post-inoculation when the cells are presumably still growing exponentially (Fig. 2D).

In contrast, in the lipid accumulation stage, large lipid droplets are distinguished by 48 h of growth, and cells appear elongated and grow as pseudo-filaments and cells are generally swollen and continue to sprout throughout the time course (Fig. 2A–C). Besides, the apparition of bud scars after nitrogen depletion, on both poles confirm the accumulation stage of lipids droplets (Fig. 2). Thus, mycelial transition was indicative of lipogenic phase and was more pronounced during the oxygen limitation. The cell size was notably affected by the different percentage of accumulated lipids among lipogenic and CA production phase. In fact, different conditions were reported to induce the dimorphism transition of yeast to mycelium during lipid accumulation phase. In fact, Zinjarde et al. (1998), showed that micro aerobic conditions were among the reasons of dimorphism in Yarrowia species.58 Besides, genetic modifications, nature of culture media and presence of specific compounds, such as N-acetylglucosamine, or bovine serum albumin (BSA) are reported to enhance efficiently the transition phenomena.59,60 Chávez et al. (2009) has reported that the dimorphic transition event is related to the activation of protein kinase signaling pathway and other signaling transduction mechanisms specific for some oleaginous strains.61 In fact, Zinjarde et al. (1998) suggested that the dimorphism transition is strain specific and depends ultimately on the nature of carbon source and the microenvironment conditions (i.e. lower dissolved oxygen concentration).58

The practical outcome of the present study is that a saturation rate of dissolved oxygen 30% is suitable to enhance the morphogenesis changes during growth and lipogenic phase and a control of mechanical agitation during lipogenic and CA production should be monitored to avoid mycelial cells disruption and eventual drop in biomass concentration in the bioreactor.

Most of the accumulated lipids between 0–16 h corresponded to catalytic biomass and lipids corresponds to phospholipids and sterols, components of cell wall of yeasts. The glycerol was used for biomass accumulation and the yield of glycerol conversion to biomass was high compared to lipogenic phase (YX/S = 0.47 ± 0.10 and YP/S = 0.08 ± 0.02). Around 4.7 ± 0.5 g L−1 of lipid concentration was observed with a lipid content of 25.0% (w/w) of dry weight at 36 h (Fig. 3). The analysis of metabolites in the supernatant showed that many organic acids were produced (pyruvic acid, ketoglutaric acid, acetic acid) but in small traces and the concentration does not exceed 2.0 ± 0.1 g L−1. Moreover, citric acid, a non-growth-associated metabolite, was secreted in lower concentration (4.0 ± 0.8 g L−1) and was constant during time course. A concomitant production of citric acid is related to the nitrogen exhaustion which also is defined to trigger citric acid as well as SCO.62,63

The simultaneous production of SCO and CA permits to classify our isolate as typical “oleaginous” feature, comparable to other Yarrowia species reported by Tsisgie et al. (2011) and Fontanille et al. (2012),64,65 respectively, where lipid accumulation takes place while glycerol was available in the media and can be used as carbon source. Besides, lower concentration of citrate was reported and this can be explained as a consequence of intracellular nitrogen limitation in yeast overflow metabolism. It does not start until nitrogen in the medium is exhausted, the growth has mainly ceased and intracellular nitrogen decreased. It is possible that nitrogen limitation somehow interrupts the TCA cycle by decreasing the activity of some enzymes, leading to citrate secretion.62

There are also data on the importance of nitrogen limitation in Candida oleophila ATCC 20177 growth for CA production; whereby the optimum [NH4+] concentration was found to be 1.2 mg g−1.62

Although Y. lipolytica is known to produce CA and the concentration reached around 154 g L−1,66 still in this study, the concentration remained stable which was favoured possibly by maintenance of pH during fermentation pH = 6.5. These results are in accordance with Kamzolova et al. (2011), who reported that a pH around 4.5–6.0 was required to enhance CA production (6.10–6.17 g L−1) in the presence of crude glycerol.10 Accordingly, CA production has a direct relation to pH changes, however, Crolla and Kennedy (2004) suggested that pH showed no direct effect on the mechanism of citric acid synthesis, but influenced the permeability of cell membranes to both substrate and products.67

Taken together, CA production in SM7 is not surprising since lipid synthesis and intensive CA production are two competitive processes for acetyl-CoA (i.e. precursor of TAG accumulation) and both phenomena are triggered by nitrogen depletion. Moreover, the lower CA concentrations can be related to the fact that SM7 may selectively consume the CA produced during lipogenic phase as carbon source to enhance TAG accumulation.63

Herein, the majority of the glycerol was converted into SCO in 60 h and the yield of lipid productivity was around 0.20 g L−1 h−1. Thus, the difference in physiological behaviour during lipogenic phase and CA is strain dependent and Yarrowia species did not exhibit the same behaviour. In this regard, Dobrowolski et al. (2016) observed that during lipogenic phase in Y. lipolytica A101, carbon metabolism is shifted towards lipid accumulation until a threshold is achieved, after which excess carbon is excreted as citric acid in which lipid is stored. However, afterwards, lipid started to degrade and CA production occurred.68 In contrast, Makri et al. (2010) have reported that some of the Yarrowia species are termed as atypical “oleaginous” feature, in which, lipid is stored after nitrogen exhaustion, that afterwards is being degraded while simultaneously significant quantities of sugar or glycerol remain unconsumed in the medium and in parallel, citric acid production occurred.31

Herein, Y. lipolytica SM7 is belonging to typical “oleaginous” feature, in which nitrogen exhaustion triggered the lipid synthesis and storage while lower quantities of citric acid (4 g L−1) and other low-molecular weight metabolites are produced (2 g L−1). Hence, Y. lipolytica SM7 is very closer to Yarrowia species reported by Fontanille et al. (2012) where SCO occurs after nitrogen exhaustion and CA is secreted into the medium,64 without cellular lipid degradation occurring.69

To further elaborate on the physiological behaviour of SM7 in the presence of crude glycerol, extended fermentation time has been proposed to confirm the choice of operational parameters tested along fermentation time (36–72 h) and to confirm the oleaginous feature of selected strain. Extended time of the process (up to 100 h) led to a decrease in biomass, lipid quantity and lipid content (24.0 ± 2.1 g L−1, 7.3 ± 1.3 g L−1 and 44.1 ± 0.9% (w/w of dry biomass)) respectively and CA production increased gradually after increasing fermentation time and reached around 14.7 ± 2.3 g L−1 of CA in 100 h. These results agree with the observation of Makri et al. (2010) who noted that CA increased progressively when CA production phase coincided with the lipid turnover phase.31

Besides, Bellou et al. (2016) observed that not only nitrogen depletion was required for CA production, but Y. lipolytica needs double limited media (in both nitrogen and magnesium) in the presence of crude glycerol to achieve both lipid and CA in significant quantities, Y. lipolytica was cultivated in continuous cultures (D = 0.028 h−1) in media containing glycerol around 86.9 ± 8.5 g L−1 as carbon source and double limited in both magnesium and nitrogen, lipid accumulation was equal to 24.7 ± 1.3% (w/w of dry weight).17 In the present study, magnesium was not limited, however it was provided at lower concentration sufficient to induce the lipid accumulation, moreover, during sterilization of medium, minerals can precipitate and become thereafter unavailable for yeast cells.70 All of these observations strengthened the stimulatory effect of limited nitrogen and magnesium to induce a lipid content of 52% (w/w) of dry weight.

Additionally, Bellou et al. (2016) have noted that higher CA amount of 9.9 ± 0.5 g L−1 was favored in higher glycerol concentration, however, the amount was reduced to 6.6 ± 0.3 g L−1, in media containing glycerol at lower concentrations (i.e. 53.1 ± 2.4 g L−1) and was totally absent in the presence of glucose even at higher concentration, 101 g L−1 and double limited media.17 Similar findings were reported by Rywinska et al. (2010) concluded that CA synthesis was highly favored in the presence of glycerol instead of glucose,71 which confirmed the potential of crude glycerol to enhance concomitant and concurrent production of lipid and CA.

These observations were in agreement with current study since CA was decreased from 12.5 ± 2.5 to 3.8 ± 0.9 g L−1 while decreasing glycerol concentration from 100 to 75 g L−1 (Table 3).

This behaviour was found to be a unique feature of Y. lipolytica compared to other oleaginous microorganisms reported in the literature. Conventionally, the oleaginous organisms accumulate reserve lipid under nitrogen depletion and degrade it under carbon starvation conditions.15,53,63 During transition from lipogenic to CA production phase, significant quantities of the stored lipid were degraded and converted into CA.

During fermentation, air flow rate was kept constant at 2.5 L min−1. Agitation rate was varied during fermentation in order to keep the DO above 30% saturation.

During first growth phase from 0–18 h, higher agitation from 250 to 500 rpm was kept to maintain a high dissolved oxygen of 60% and aeration rate of 3.5 L min−1. When DO reached 60% of saturation, the mixing was reduced to 400–350 rpm and then the aeration was reduced to 2.5 L min−1 in order to maintain the DO at about 30% of saturation. The values of oxygen utilization rate (OUR), oxygen transfer rate (OTR) and oxygen transfer coefficient (KLa) is presented in Fig. 4. Experiments showed that OUR increased slightly between 24 to 60 h. This increase was accompanied with an increase of KLa value between 60–84 h−1. This value was maintained approximatively in the range due to the variation of agitation rate. A saturation level of 30% of dissolved oxygen was based on previous reported works. For example, Zhao et al. (2010) maintained the dissolved oxygen at 40% of air saturation and achieved around 56.5% (w/w) of lipid production from Rhodosporidium toruloides Y4 in the presence of Jerusalem artichoke as carbon substrates.72 Besides, Polburee et al. (2016) have fixed a KLa value of 129 h−1 to obtain around 63.8% (w/w of dry biomass) of lipid content with a lipid concentration of 8.99 g L−1 during the cultivation of Rhodosporidium fluviale DMKU-RK253 in crude glycerol.37 Moreover, an optimum of 88.5 h−1 was required to maintain high lipid production of Schizochytrium sp.73 In summary, the two-stage cultivation with a dissolved oxygen shift, developed in this study could enhance lipid synthesis. In the first stage, when nitrogen present in the cultured medium and KLa around 48–52 h−1, there was high biomass yield up to 0.47 g g−1 glycerol with only low lipid yield of 0.08 g g−1. Then, the high lipid yield was observed when the dissolved oxygen decreased from 60% to 30% in the second stage (i.e. lipogenic phase). The highest lipid yield of 0.16 g g−1 glycerol was observed during 66 h. Thus, Yarrowia responds to nutrient limitation in the manner typical of oleaginous yeasts, which accumulate intracellular lipids during a stationary phase. This strategy also supported high levels of biomass and lipid concentration when compared with the cultivation of Yarrowia species in crude glycerol media Table 5.


image file: c6ra16382c-f4.tif
Fig. 4 Variation of KLa, OUR and OTR in 5 L fermenter. Culture was performed in the optimized medium on 89 g crude glycerol per L, 0.54 g NH4OH per L, pH = 6.5 ± 0.3, temperature = 28 ± 1 °C.

3.3 Lipid analysis and fatty acid composition

Analysis of the fatty acid composition of SCOs produced by Y. lipolytica varied as a function of fermentation time aligning with studies of Papanikolaou et al. (2013), who confirmed that fatty acids changed as a function of the glycerol concentration employed and the culture time.77 In the present study, at crude glycerol concentration of 89 g L−1, oleic acid (Δ9C18[thin space (1/6-em)]:[thin space (1/6-em)]1) was detected at higher concentrations ranging from 39.2% to 43.5% during growth and lipogenic phase, respectively. Similarly, Papanikolaou et al. (2013) found that oleic acid (Δ9C18[thin space (1/6-em)]:[thin space (1/6-em)]1) was around 47.1 and 59.7% for wild-type Yarrowia lipolytica (W29) and genetically engineered strain (JMY1203) respectively, in the presence of 90 g L−1 of glycerol concentration, during the late exponential phase and the early stationary phase (60–90 h),77 corresponding to the lipogenic phase (36–66 h) in the current study. Furthermore, the predominance of (Δ9C18[thin space (1/6-em)]:[thin space (1/6-em)]1) was in accordance with data reported by André et al. (2009) and Makri et al. (2010), in the presence of crude glycerol. Oleic acid was produced not only in the presence of crude glycerol as carbon source, but also in the presence of hydrophobic substrates, for instance, when Y. lipolytica was grown on rapeseed oil, oleic (Δ9C18[thin space (1/6-em)]:[thin space (1/6-em)]1) and linoleic (Δ9,12C18[thin space (1/6-em)]:[thin space (1/6-em)]2) acids, were detected at higher concentration of 61.9 and 29.2% of the total fatty acids, respectively.11 Herein, the analysis of fatty acid profile between different phases is presented in Table 6, which revealed significant changes along time course. Myristic (C14[thin space (1/6-em)]:[thin space (1/6-em)]0) 8.0%, palmitic (C16[thin space (1/6-em)]:[thin space (1/6-em)]0) 13.2%, stearic (C18[thin space (1/6-em)]:[thin space (1/6-em)]0) 9.68%, oleic (Δ9C18[thin space (1/6-em)]:[thin space (1/6-em)]1) 39.2%, linoleic (Δ9,12C18[thin space (1/6-em)]:[thin space (1/6-em)]2) 27.0% were the major fatty acids detected at an early growth stage before nitrogen depletion. Moreover, the fatty acid profile of the cells did not change significantly upon entry into the nitrogen limitation phase (between 6 and 16 h). For example, a significant increase of oleic (Δ9C18[thin space (1/6-em)]:[thin space (1/6-em)]1) content from 39.0% to 43.5%, C16[thin space (1/6-em)]:[thin space (1/6-em)]0 content from 13.2 to 14.4%. Moreover, a smaller decrease of linoleic (Δ9,12C18[thin space (1/6-em)]:[thin space (1/6-em)]2) from 27.0 to 17.5% is observed with a small variation of strearic acid content (C18[thin space (1/6-em)]:[thin space (1/6-em)]0). These observations confirmed that the composition is phase-dependent and a fatty acid selectivity towards more unsaturated fatty acids is noted. The mainly produced fatty acids were C16 and C18 long-chain fatty acids, as do other oleaginous yeasts.31,78 Another observation to be concluded from this observation is the high fatty acid desaturase activity during yeast cultivation which is reflected by higher ratio of C18[thin space (1/6-em)]:[thin space (1/6-em)]1/C18[thin space (1/6-em)]:[thin space (1/6-em)]0 which is >1. The higher ratio, higher activity of D9-desaturase is observed, especially in the lipid production phase which was also confirmed by Kamzolova et al. (2011).10 Although Yarrowia showed good yields of unsaturated fatty acids, it exhibited very low content of the myristic acid (C14[thin space (1/6-em)]:[thin space (1/6-em)]0) and other fatty acids, such as arachidic acid (C20[thin space (1/6-em)]:[thin space (1/6-em)]0), cis-11eicosanoic acid (C20[thin space (1/6-em)]:[thin space (1/6-em)]1) lignoceric acid (C24[thin space (1/6-em)]:[thin space (1/6-em)]0). Nevertheless, these produced fatty acids can constitute perfect precursors for the synthesis of 2nd generation biodiesel.79–81
Table 6 Fatty acid composition of Y. lipolytica SM7 grown on glycerol-containing waste from biodiesel industry during different stages. Analyses were performed in duplicate
Fatty acids (% of lipid) Growth phase Lipid production
C14[thin space (1/6-em)]:[thin space (1/6-em)]0 8.04 0.53
C16[thin space (1/6-em)]:[thin space (1/6-em)]0 13.20 14.38
C16[thin space (1/6-em)]:[thin space (1/6-em)]1 0.3 0.3
C18[thin space (1/6-em)]:[thin space (1/6-em)]0 9.68 8.30
C18[thin space (1/6-em)]:[thin space (1/6-em)]1 39.16 43.54
C18[thin space (1/6-em)]:[thin space (1/6-em)]2 27 17.50
C20[thin space (1/6-em)]:[thin space (1/6-em)]0 Traces Traces
C20[thin space (1/6-em)]:[thin space (1/6-em)]1 Traces Traces
Total of fatty acids saturated 30.92 23.21
Total of fatty acids: monounsaturated 39.46 43.84
Total of fatty acids: polyunsaturated 27 17.50
Total of fatty acids 97.38 84.55
C16[thin space (1/6-em)]:[thin space (1/6-em)]1/C16[thin space (1/6-em)]:[thin space (1/6-em)]0 0.02 0.02
C18[thin space (1/6-em)]:[thin space (1/6-em)]1/C18[thin space (1/6-em)]:[thin space (1/6-em)]0 4.04 5.24
C18[thin space (1/6-em)]:[thin space (1/6-em)]2/C18[thin space (1/6-em)]:[thin space (1/6-em)]1 0.69 0.40


4 Conclusion

Y. lipolytica is a good candidate for glycerol consumption and lipid production. Single cell oil production is comparable to some of the highest in the literature for microorganisms growing on glycerol. Despite large reports of this conventional yeast, this is the first report to deal with the conversion of this residue to SCO with in-depth analysis of metabolites and growth parameters at fermenter scale. Furthermore, when a two-stage cultivation strategy using dissolved oxygen shift cultivation was developed, the highest biomass, lipid quantity and lipid content of 25.80 ± 1.5 g L−1, 13.6 ± 0.8 g L−1, and 52.7 ± 1.2% (w/w of dry biomass), respectively, were obtained. This two-stage cultivation strategy shows potential for application in industrial processes to achieve high lipid concentration, and the fatty acid composition obtained by this strain show it is favorable for use as the feedstock for biodiesel manufacture. Finally, the actual optimal values of ammonium hydroxide amounts and concentration of crude glycerol and fermentation time should be further studied in response to other operational factors.

Acknowledgements

Authors would like to acknowledge the Natural Sciences and Engineering Research Council of Canada (grant A4984, Strategic grant 412994-11, Canada Research Chair) for financial support.

References

  1. G. Vicente, M. Martinez and J. Aracil, Bioresour. Technol., 2004, 92, 297–305 CrossRef CAS PubMed.
  2. G. Antolin, F. V. Tinaut, Y. Briceno, V. Castano, C. Perez and A. I. Ramirez, Bioresour. Technol., 2002, 83, 111–114 CrossRef CAS PubMed.
  3. B. J. Kerr, W. A. Dozier and K. Bregendahl, Proceedings of the 23rd Annual Carolina Swine Nutrition Conference, Raleigh, NC, 2007, pp. 6–18 Search PubMed.
  4. V. K. Garlapati, U. Shankar and A. Budhiraja, Biotechnol. Rep., 2016, 9, 9–14 CrossRef.
  5. L. Rodolfi, G. C. Zittelli, N. Bassi, G. Padovani, N. Biondi, G. Bonini and M. R. Tredici, Biotechnol. Bioeng., 2009, 102, 100–112 CrossRef CAS PubMed.
  6. S. Magdouli, S. Yan, R. D. Tyagi and R. Y. Surampalli, Crit. Rev. Environ. Sci. Technol., 2014, 44, 416–453 CrossRef CAS.
  7. S. Papanikolaou and G. Aggelis, Lipid Technol., 2009, 21, 83–87 CrossRef CAS.
  8. J. D. Rivaldi, B. F. Sarrouh and S. S. d. Silva, in Current Research Topics in Applied Microbiology and Microbial Biotechnology, ed. A. Mendez-Vilas, World Scientific Publishing Co., Formatex Research Center, Madrid, 2009, pp. 429–433 Search PubMed.
  9. A. Abghari and S. Chen, Frontiers in Energy Research, 2014, 2, 21 CrossRef.
  10. S. V. Kamzolova, A. R. Fatykhova, E. G. Dedyukhina, S. G. Anastassiadis, N. P. Golovchenko and I. G. Morgunov, Food Technol. Biotechnol., 2011, 49, 65–74 CAS.
  11. S. V. Kamzolova, E. G. Dedyukhina, V. A. Samoilenko, J. N. Lunina, I. F. Puntus, R. K. Allayarov, M. N. Chiglintseva, A. A. Mironov and I. G. Morgunov, Appl. Microbiol. Biotechnol., 2013, 97, 9133–9144 CrossRef CAS PubMed.
  12. A. P. Abreu, B. Fernandes, A. A. Vicente, J. Teixeira and G. Dragone, Bioresour. Technol., 2012, 118, 61–66 CrossRef CAS PubMed.
  13. Y. Liang, N. Sarkany, Y. Cui, J. Yesuf, J. Trushenski and J. W. Blackburn, Bioresour. Technol., 2010, 101, 3623–3627 CrossRef CAS PubMed.
  14. N. Bati, E. G. Hammond and B. A. Glatz, J. Am. Oil Chem. Soc., 1984, 61, 1743–1746 CrossRef CAS.
  15. S. Papanikolaou, I. Chevalot, M. Galiotou-Panayotou, M. Komaitis, I. Marc and G. Aggelis, Electron. J. Biotechnol., 2007, 10, 425–435 CAS.
  16. J. Blazeck, A. Hill, L. Liu, R. Knight, J. Miller and A. Pan, Nat. Commun., 2014, 5, 3131 Search PubMed.
  17. S. Bellou, I.-E. Triantaphyllidou, P. Mizerakis and G. Aggelis, J. Biotechnol., 2016, 234, 116–126 CrossRef CAS PubMed.
  18. S. Papanikolaou, S. Fakas, M. Fick, I. Chevalot, M. Galiotou-Panayotou, M. Komaitis, I. Marc and G. Aggelis, Biomass Bioenergy, 2008, 32, 60–71 CrossRef CAS.
  19. G. Barth and C. Gaillardin, Yarrowia lipolytica, in Nonconventional yeasts in biotechnology, ed. K. Wolf, Springer-Verlag, Berlin, Heidelberg, New York, 1996 Search PubMed.
  20. F. A. G. Gonçalves, G. Colen and J. A. Takahashi, Sci. World J., 2014, 2014, 476207–476214 Search PubMed.
  21. J. Lin, H. Shen, H. Tan, X. Zhao, S. Wu, C. Hu and Z. K. Zhao, J. Biotechnol., 2011, 152, 184–188 CrossRef CAS PubMed.
  22. C. E. Nakamura and G. M. Whited, Curr. Opin. Biotechnol., 2003, 14, 454–459 CrossRef CAS PubMed.
  23. P. Polburee, W. Yongmanitchai, N. Lertwattanasakul, T. Ohashi, K. Fujiyama and S. Limtong, Fungal Biol., 2015, 119, 1194–1204 CrossRef CAS PubMed.
  24. S. J. Sarma, S. K. Brar, E. B. Sydney, Y. L. Bihan, G. Buelna and C. R. Soccol, Int. J. Hydrogen Energy, 2012, 37, 6473–6490 CrossRef CAS.
  25. Z. Lazar, T. Dulermo, C. Neuvéglise, A. M. Crutz-Le Coq and J. M. Nicaud, Metab. Eng., 2014, 26, 89–99 CrossRef CAS PubMed.
  26. S. Joshi, C. Bharucha, S. Jha, S. Yadav, A. Nerurkar and A. J. Desa, Bioresour. Technol., 2008, 99, 195–199 CrossRef CAS PubMed.
  27. R. S. Makkar, S. Swaranjit and S. S. Cameotra, J. Am. Oil Chem. Soc., 1997, 74, 887–889 CrossRef CAS.
  28. A. Beopoulos, Z. Mrozova, F. Thevenieau, M. T. Dall, I. Hapala and S. Papanikolaou, Appl. Environ. Microbiol., 2008, 74, 7779–7789 CrossRef CAS PubMed.
  29. P. A. E. P. Meesters, G. N. M. Huijberts and G. Eggink, Appl. Microbiol. Biotechnol., 1996, 45, 575–579 CrossRef CAS.
  30. S. S. Tchakouteu, O. Kalantzi, C. Gardeli, A. A. Koutinas, G. Aggelis and S. Papanikolaou, J. Appl. Microbiol., 2015, 118, 911–927 CrossRef CAS PubMed.
  31. A. Makri, S. Fakas and G. Aggelis, Bioresour. Technol., 2010, 101, 2351–2358 CrossRef CAS PubMed.
  32. J. B. M. Rattray, A. Schibecl and D. K. Kidby, Bacteriol. Rev., 1975, 39, 197–231 CAS.
  33. R. S. Moreten, Physiology of lipid accumulation yeast, in Single cell oil, ed. R. S. Moreton, Longman, London, 1988, pp. 1–32 Search PubMed.
  34. J. Folch, M. Lees and G. H. S. Stanley, J. Biol. Chem., 1957, 226, 497–509 CAS.
  35. R. Halim, B. Gladman, M. K. Danquah and P. A. Webley, Bioresour. Technol., 2011, 102, 178–185 CrossRef CAS PubMed.
  36. G. Annadurai, S. M. Balan and T. Murugesan, Bioprocess Eng., 1999, 21, 415–421 CAS.
  37. P. Polburee, W. Yongmanitchai, K. Honda, T. Ohashi, T. Yoshida, K. Fujiyama and S. Limtong, Biochem. Eng. J., 2016, 112, 208–218 CrossRef CAS.
  38. M. Lipp and E. Anklam, Food Chem., 1998, 62, 73–97 CrossRef CAS.
  39. S. Papanikolaou and G. Aggelis, Eur. J. Lipid Sci. Technol., 2010, 112, 639–654 CrossRef CAS.
  40. S. Papanikolaou, I. Chevalot, M. Komaitis, G. Aggelis and I. Marc, Antonie van Leeuwenhoek, 2001, 80, 215–224 CrossRef CAS PubMed.
  41. C. Ratledge, Yeasts, moulds, algae and bacteria as sources of lipids, in Technological advances in improved and alternative sources of lipids, ed. B. S. Kamel and Y. Kakuda, Blackie academic and professional, London, 1994 Search PubMed.
  42. J. Cescut, Accumulation d'acylglycérols par des espèces levuriennes à usage carburant aéronautique: physiologie et performances de procédés, Université de Toulouse, Toulouse, 2009 Search PubMed.
  43. C. T. Evans and C. Ratledge, J. Gen. Microbiol., 1984, 130, 1705–1710 CAS.
  44. A. K. Azad, A. Yousuf, A. Ferdoush, M. M. Hasan, M. R. Karim and A. Jahan, J. Microb. Biochem. Technol., 2014, S8, 008 Search PubMed.
  45. M. Hassan, P. J. Blanc, L. M. Granger, A. Pareilleux and G. Goma, Process Biochem., 1996, 31, 355–361 CrossRef CAS.
  46. T. Braunwald, L. Schwemmlein, G. S. Hönninger, W. T. French, R. Hernandez, W. E. Holmes and W. Claupein, Appl. Microbiol. Biotechnol., 2013, 97, 6581–6588 CrossRef CAS PubMed.
  47. N. G. Karanth and A. P. Satur, Bioprocess Eng., 1991, 6, 241–248 CrossRef CAS.
  48. J. M. Ageitos, J. A. Vallejo, P. Veiga-Crespo and T. G. Villa, Appl. Microbiol. Biotechnol., 2001, 90, 1219–1227 CrossRef PubMed.
  49. A. Yousuf, Waste Manag., 2012, 32, 2061–2067 CrossRef CAS PubMed.
  50. C. Angerbauer, M. Siebenhofer, M. Mittelbach and G. M. Guebiz, Bioresour. Technol., 2008, 99, 3051–3056 CrossRef CAS PubMed.
  51. I. Kolouchová, O. Mátková, K. Sigler, J. Masák and T. Rezanka, Int. J. Anal. Chem., 2016, 2016, 9 Search PubMed.
  52. Y. H. Chang, K. S. Chang, C. F. Lee, C. L. Hsu, C. W. Huang and H. D. Jang, Biomass Bioenergy, 2015, 72, 95–103 CrossRef CAS.
  53. S. Papanikolaou, S. Sarantou, M. Komaitis and G. Aggelis, J. Appl. Microbiol., 2004, 97, 867–875 CrossRef CAS PubMed.
  54. P. A. E. P. Meesters, H. van de Wal, R. Weusthuis and G. Eggink, Biotechnol. Tech., 1996, 10, 277–282 CrossRef CAS.
  55. W. Rymowicz, A. Rywińska, B. Żarowska and P. Juszczyk, Chem. Pap., 2006, 60, 391–394 CAS.
  56. E. E. Karamerou, C. Theodoropoulos and C. Webb, Biomass Bioenergy, 2016, 89, 113–122 CrossRef CAS.
  57. M. Takagi, K. Watanabe, K. Yamaberi and Y. Yoshida, Appl. Microbiol. Biotechnol., 2000, 54, 112–117 CrossRef CAS PubMed.
  58. S. S. Zinjarde, A. Pant and M. V. Deshpande, Mycol. Res., 1998, 102, 553–558 CrossRef.
  59. J. Kim, S. A. Cheon, S. Park, Y. Song and J. Y. Kim, FEMS Microbiol. Lett., 2000, 190, 9–12 CrossRef CAS PubMed.
  60. F. M. Pérez-Campo and A. Dominguez, Curr. Microbiol., 2001, 43, 429–433 CrossRef PubMed.
  61. J. A. Cervantes-Chávez, F. Kronberg, S. Passeron and J. Ruiz-Herrera, Fungal Genet. Biol., 2009, 46, 390–399 CrossRef PubMed.
  62. S. Anastassiadis, A. Aivasidis and C. Wandrey, Appl. Microbiol. Biotechnol., 2002, 60, 81–87 CrossRef CAS PubMed.
  63. C. Ratledge and J. P. Wynn, Adv. Appl. Microbiol., 2002, 51, 1–51 CAS.
  64. P. Fontanille, V. Kumar, G. Christophe, R. Nouaille and C. Larroche, Bioresour. Technol., 2012, 114, 443–449 CrossRef CAS PubMed.
  65. Y. A. Tsigie, C. Y. Wanga, C. T. Truong and Y. H. Ju, Bioresour. Technol., 2011, 102, 9216–9222 CrossRef CAS PubMed.
  66. A. Rywińska and W. Rymowicz, J. Ind. Microbiol. Biotechnol., 2010, 37, 431–435 CrossRef PubMed.
  67. A. Crolla and K. J. Kennedy, J. Bacteriol., 2004, 110, 73–84 CAS.
  68. A. Dobrowolski, P. Mituła, W. Rymowicz and A. M. Mironczuk, Bioresour. Technol., 2016, 207, 237–243 CrossRef CAS PubMed.
  69. A. André, A. Chatzifragkou, P. Diamantopoulou, D. Sarris, A. Philippoussis, M. Galiotou-Panayotou, M. Komaitis and S. Papanikolaou, Eng. Life Sci., 2009, 9, 468–478 CrossRef.
  70. S. Papanikolaou and G. Aggelis, Bioresour. Technol., 2002, 82, 43–49 CrossRef CAS PubMed.
  71. A. Rywinska, W. Rymowicz, B. Zarowska and A. Skrzypinski, World J. Microbiol. Biotechnol., 2010, 26, 1217–1224 CrossRef CAS PubMed.
  72. X. Zhao, S. Wu, C. Hu, Q. Wang, Y. Hua and Z. K. Zhao, J. Ind. Microbiol., 2010, 37, 581–585 CrossRef CAS PubMed.
  73. L. Qu, X. J. Ji, L. J. Ren, Z. K. Nie, Y. Feng, W. J. Wu, P. K. Ouyang and H. Huang, Lett. Appl. Microbiol., 2011, 52, 22–27 CrossRef CAS PubMed.
  74. S. Papanikolaou, L. Muniglia, I. Chevalot, G. Aggelis and I. Marc, Curr. Microbiol., 2003, 46, 124–130 CrossRef CAS PubMed.
  75. Y. Louhasakul and B. Cheirsilp, Appl. Biochem. Biotechnol., 2013, 169, 110–122 CrossRef CAS PubMed.
  76. E. Celińska and W. Grajek, Microb. Cell Fact., 2013, 12, 102,  DOI:10.1186/1475-2859-12-102.
  77. S. Papanikolaoua, A. Beopoulos, A. Koletti, F. Thevenieau, A. A. Koutinasa, J.-M. Nicaud and G. Aggelis, J. Biotechnol., 2013, 168, 303–314 CrossRef PubMed.
  78. M. Rakicka, Z. Lazar, T. Dulermo, P. Fickers and J. M. Nicaud, Biotechnol. Biofuels, 2015, 8, 104,  DOI:10.1186/s13068-015-0286-z.
  79. Y. H. Li, Z. B. Zhao and F. W. Bai, Enzyme Microb. Technol., 2007, 41, 312–317 CrossRef CAS.
  80. X. Zhao, X. Kong, Y. Hua, B. Feng and Z. Zhao, Eur. J. Lipid Sci. Technol., 2008, 110, 405–412 CrossRef CAS.
  81. J. Xu, X. Zhao, W. Wang, W. Du and D. Liu, Biochem. Eng. J., 2012, 65, 30–36 CrossRef CAS.

This journal is © The Royal Society of Chemistry 2016
Click here to see how this site uses Cookies. View our privacy policy here.