A molten salt strategy for deriving a porous Si@C nano-composite from Si-rich biomass for high-performance Li-ion batteries†
Ning Lin,
Tianjun Xu,
Ying Han,
Kangze Shen,
Yongchun Zhu* and
Yitai Qian*
Department of Chemistry, Hefei National Laboratory for Physical Science at Micro-scale, University of Science and Technology of China, Hefei, Anhui 230026, P. R. China. E-mail: ytqian@ustc.edu.cn; ychzhu@ustc.edu.cn
First published on 17th August 2016
Abstract
The preparation of a porous Si@C nano-composite from Si-rich biomass such as bamboo leaves is realized through baking the precursor at 400 °C in air, followed by reduction in molten AlCl3 at 200 °C. During this process, both Si and C components in those natural precursors are recovered as active materials. The obtained crystallized Si nanoparticles are embedded well in the pyrolyzed porous carbon matrix. As an anode for Li-ion batteries, the Si@C nano-composite exhibits long-term cycling stability with a capacity of 600 mA h g−1 at 2.0 A g−1 after 3700 cycles.
Over the past decades, some renewable natural by-products such as rice husks, sugarcane, litchi shells, peanut shells, and mushrooms have been utilized to prepare various nano-structured carbonaceous anode materials for rechargeable Li-ion batteries (LIBs).1–5 For example, graphitic carbon nano-sheets, which were synthesized from wheat stalks via a hydrothermal process and subsequent graphitization treatment at 2600 °C, delivered a reversible capacity of 300.9 mA h g−1 at 1C after 500 cycles.6
Recently, preparation of nano-sized Si materials from low-cost natural bio-mass for LIBs has attracted enormous attention. Typically, the Si-rich families of Poaceae, Equisetaceae, and Cyperaceae, which are able to absorb a large amount of Si element from soil in the form of silicic acid (Si(OH)4 or Si(OH)3O−), can serve as sustainable Si resources. Cui et al. reported the recovery of Si nanoparticles from rice husks; the employed strategy consists of deriving silica by burning out the carbon component, and is followed by magnesiothermic reduction of the derived silica at 650 °C.7 The obtained nano-Si anode exhibited a reversible capacity of 2200 mA h g−1 at 0.84 A g−1 after 100 cycles.
In generally, a post carbon coating on nano-sized Si is required for improving the Li-storage performance.8–11 On one hand, the carbonaceous additives could work as a matrix for buffering the large volume variation of Si (>270%) during repeated Li ion insertion/extraction.12–15 On the other hand, the carbon component is beneficial for enhancing the conductivity. For instance, Si nanoparticles, prepared from bamboo leaves using above procedure, showed a reversible capacity of 430 mA h g−1 at 8.4 A g−1. After coating with carbon and reduced graphene oxides (RGO), the as-prepared Si@C/RGO composite displayed better Li-ion storage performance, with a reversible capacity of 1400 mA h g−1 at 8.4 A g−1.16 Y. Yu et al. prepared porous Si particles from reed leaves, after coated with carbon by pyrolyzing glucose, the Si@C composite (weight ratio of 4/1) displayed a specific capacity of 420 mA h g−1 at 42 A g−1 after 4000 cycles.17
Obviously, the organic carbonaceous component in those Si-containing natural biomass themselves was commonly burned out during the procedure of deriving Si crystalline. Therefore, making full use of both Si and C elements in those sustainable and abundant natural products to fabricate Si@C composites is highly desirable.
In this work, preparing Si nano-crystalline decorated porous carbon composite (Si@C) from bamboo leaves was developed, both Si and C components in those precursors are well retained. Fig. 1 displays the flow diagram for producing Si@C composite from bamboo leaves, which mainly includes ball milling, acid washing, baking treatment in a covered corundum crucible at 400 °C under air atmosphere, and reduction with metallic Mg in molten AlCl3 at 200 °C. The as-prepared Si@C composite has a porous amorphous carbon matrix, in which in situ derived Si nano-particles are well embedded. The BET surface area of the sample is 201 m2 g−1. As anodes for LIBs, the Si@C composite delivers a reversible capacity of 1117 mA h g−1 after 250 cycles at 0.4 A g−1 and about 600 mA h g−1 after 3700 cycles at 2.0 A g−1, accompanied with 52% capacity retention even at 20 A g−1. When the Si@C composite anode was paired with a LiCoO2 cathode, the full cell exhibits a capacity of 900 mA h g−1 at 150 mA g−1 over 30 cycles, associated with a discharge potential of 3.5 V.
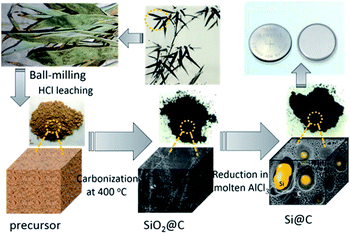 | ||
| Fig. 1 Schematic illustration of the process for producing porous Si@C anode from natural bamboo leaves. | ||
The intermediate sample after baking treatment at 400 °C was first characterized. The SEM picture (Fig. 2a) shows that the sample is composed of micro-sized particles. The EDX mapping pictures (Fig. 2b–e) demonstrated that Si, O and C elements are uniformly dispersed in these micro-particles. No crystallized peaks in the XRD patterns can be observed from the sample (Fig. S1†). Two peaks at around 1345 and 1550 cm−1 in the Raman spectra (Fig. 2f) are attributed to the amorphous carbon, implying the carbonization of the organic carbon components in the leaves during baking treatment.18 Two sharp bands at around 1082 and 810 cm−1 are detected in the FT-IR plot (Fig. 2g), which are resulted from the Si–O–Si. Before heating treatment, a broad band at around 3500 cm−1 and a sharp band in the 3000–2800 cm−1 are also observed (Fig. S2†), which are ascribed to O–H vibrations of H2O and C–H stretching vibration of organic alkyl chains.19,20 Obviously, annealing treatment at 400 °C ensures the efficient pyrolysis of organic matter and the removal of moisture content, producing amorphous SiO2/carbon composite.
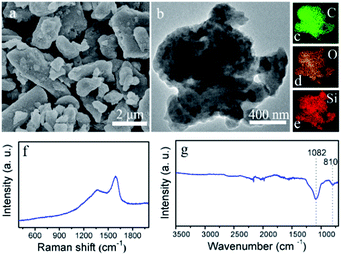 | ||
| Fig. 2 (a) SEM image, (b) TEM picture, (c–e) the corresponding EDX mapping picture of the C, O, and Si elements, (f) Raman spectrum, and (g) FT-IR plot of the silicon oxides/carbon composite. | ||
The final product was obtained via reduction of the SiO2/C with metallic Mg in molten AlCl3 at 200 °C. Fig. 3a shows the XRD patterns of the final product, the peaks at 28.56, 47.44, and 56.25 degree are indexed to the diffraction peaks of cubic Si (JCPDS 27-1402). Fig. 3b shows the Raman spectra of the as-prepared products, the sharp peak at around 515 cm−1 arises from optic phonons of Si–Si stretching motion, and the other two characteristic peaks at ∼1350 and ∼1560 cm−1 can be assigned to the pyrolyzed amorphous carbon.18 Based on the TGA plot (Fig. S3†), the weight ratio of Si in the composite is calculated to be about 20%. The SEM (Fig. 3c) and enlarged SEM (Fig. 3d) pictures show that the Si@C composite possesses irregular micro-sized particles with a rough surface. The TEM image (Fig. 3e) clearly exhibits that these micro-particles have porous structure.
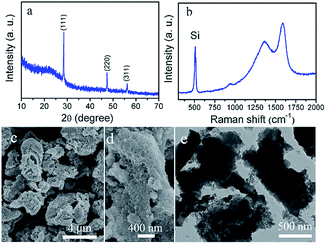 | ||
| Fig. 3 (a) XRD patterns, (b) Raman spectrum, (c) SEM, (d) high-magnification SEM, (e) TEM images of the as-prepared Si@C composite. | ||
Fig. 4b and c exhibit the EDX mapping picture concerning C and Si elements in the selected micro-particles (Fig. 4a). Obviously, the Si and C elements are dispersed uniformly in the composite. Then, the HR-TEM images were taken from the different zones, as shown in Fig. 4d–f. Some nano-sized pore can be detected in the amorphous carbon matrix, as marked in the Fig. 4d. Meanwhile, clear lattice fringes can be observed, and the interplanar distances are measured to be about 0.195 (Fig. 4e) and 0.31 nm (Fig. 4f), corresponding to the (220) and (111) crystal planes of the cubic Si, respectively. The size of Si particle is ranging from several to tens nano-meters. Also, it can be clearly detected that amorphous carbon is coated on these crystallized Si particles, that is, the derived Si nano-particles are well embedded in the porous carbon matrix. Besides, the BET measurement (Fig. S4†) shows that the Si@C composite has a BET surface area is 201 m2 g−1, with an average pore size of 7.2 nm and pore volume of 0.065 cm3 g−1. The porous morphology may be ascribed to the gas release from the decomposition of organic matters during calcination, and removal of impurity or by-product leaching in acid solution.16
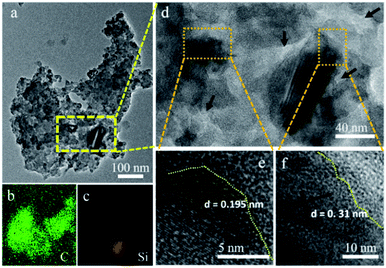 | ||
| Fig. 4 (a) TEM, (b and c) the corresponding EDX mapping picture of C and Si elements, (d–f) high-resolution TEM picture of the Si@C composite. | ||
Above all, the preparation of the porous Si@C composite starting from bamboo leaves can be described as follows: the baking treatment at 400 °C could controllably carbonize the organic matter in air; the Si element in the precursor was reduced into crystalline Si nano-particles that are well embedded in the porous carbon matrix. The low temperature molten salt system plays a key role in producing the Si@C composite. On one hand, the molten AlCl3 can take part in the reduction of silicon oxides (e.g. Mg + AlCl3 + SiO2 → MgAl2Cl8 + AlOCl + Si), promoting the reduction reaction at low temperature of 200 °C.21 On the other hand, the temperature (200 °C) during reaction was relatively stable in the molten AlCl3 system, which will avoid the formation of highly stable SiC.22
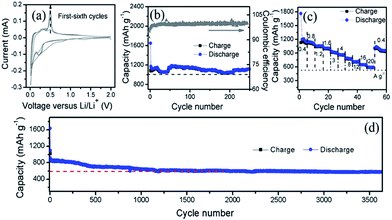
To elucidate the Li-ion storage performance of the prepared Si@C composite derived from bamboo leaves, a coin-type half-cell based on Si@C composite and Li foil counter electrode is assembled. Typical cyclic voltammetry (CV) curves of the as-prepared Si@C anode at a scanning rate of 0.1 mV s−1 are shown in Fig. 5a. In the first anodic process, the weak peak at around 1.2 V is caused by the decomposition of the electrolyte that would result in the formation of solid electrolyte interface (SEI) membrane. The weak peak at 0.1 V during the first discharge scan agrees well with the Li-alloying process of crystallized Si. From the second cycle onwards, the peaks at 0.1 V shift to higher voltage, indicating an amorphization process of Si during the first cycle. In the charge process, two distinct peaks are located at 0.35 V and 0.5 V, which can be ascribed to the de-lithiation transition from LixSi to amorphous Si.23 The gradual increase of the CV peak intensity for the first six cycles implies an activation process occurred.16
The cycling stability at 0.4 A g−1 is evaluated by galvanostatic discharge–charge measurement in the voltage range of 0.01–1.50 V, as exhibited in Fig. 5b. According to the Si content in the composite, the theoretical reversible capacity of the composites can be estimated to be about 1138 mA h g−1 (0.2 × 4200 + 372 × 0.8). The first discharge and charge steps deliver a specific capacity of 1648 and 1080 mA h g−1, respectively. The initial irreversible capacity may be resulted from the formation of SEI membrane, and the side reactions. The Si@C maintains a stable reversible capacity over 250 cycles, no remarkable capacity fading can be observed, indicating superior cycling stability. The corresponding coulombic efficiency quickly increases to 91% for the second cycle and then reaches up to 99% after five cycles.
Furthermore, the rate capability was investigated with the current density ranging from 0.4 to 20 A g−1, as shown in Fig. 5c. The Si@C composite exhibits the average specific capacity of 1130, 1050, 1030, 990, 910, 861, 780, 710, 640, and 590 mA h g−1 at the current density increased from 0.4 to 20.0 A g−1, respectively. Even at 20 A g−1, the specific capacity is over 590 mA h g−1 that is 52% of the capacity value at 0.4 A g−1. A reversible capacity of 1000 mA h g−1 could be recovered as the current density returned back to 0.4 A g−1 after cycling at high current density, indicating good rate capability.
The long-term cycling stability at high current density was also studied (Fig. 5d). It should be mentioned that the cells are tested at a relative low current density of 0.3 A g−1 for first two cycles in order to activate the anode sufficiently. The Si electrode delivers a specific capacity of ∼600 mA h g−1 at 2.0 A g−1 even after 3700 cycles, with a capacity decay rate about 0.01%.
Overall, the good electrochemical performance of the as-prepared porous Si@C composite may be attributed to the following advantageous aspects. First, the Si nano-particles enables the composite to possess higher reversible capacity. Second, the carbon matrix could not only buffer the volume change of the Si nanoparticles, but also benefit the electronic and ionic conductivity. What's more, the porous structure is able to shorten the ionic diffusion path, facilitating the high rate capability.
The Si@C anode was paired with a commercial LiCoO2 cathode in order to evaluate the full-cell performance. Note that the Si@C was pre-lithiated in a half-cell with lithium foil counter electrode to form the stable SEI layer.24 The current density and the specific capacity are calculated based on the weight of Si@C composite. Fig. 6a depicts the typical charge–discharge curves within a voltage window from 2.5 to 4.2 V. As one can see, the main discharge and charge potential is at around 3.5 and 3.8 V, respectively. The cell delivers an initial charge capacity of 1048 mA h g−1 with an initial coulombic efficiency of 91.6% at 150 mA g−1, and retains 900 mA h g−1 after 30 cycles, as shown in Fig. 6b.
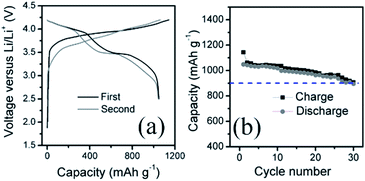 | ||
| Fig. 6 (a) Charge–discharge profile (b) charge/discharge capacity at a current density of 150 mA h g−1 of the full cell consists of a Si@C anode and a LiCoO2 cathode. | ||
Conclusions
In summary, porous Si@C nano-composite is successfully fabricated from bamboo leaves, which could make full use of the Si and C components in natural Si-containing biomass. Due to the uniform dispersion of Si and C in the natural plant precursors, the obtained porous Si@C composite retains a well-dispersed amorphous carbon and Si crystalline. The in situ formed Si nano-particles are uniformly embedded in the porous carbon matrix. The unique structure could not only buffer the volume variation of the Si particles, but also improve the conductivity. As a result, the porous Si@C anode shows a high reversible capacity, good rate capability, and long-term cycling stability. These natural by-products are abundant and low-cost, the present work may be helpful for using these biomass resources to produce high-performance Si@C based anode materials for LIBs.Acknowledgements
This work was financially supported by the National Natural Science Fund of China (No. 21471142, 21201158, 21521001).Notes and references
- S. Zheng, M. Zheng, Z. Lin, N. Li, Y. Liu, B. Zhan, H. Pang, J. Cao, P. He and Y. Shi, J. Mater. Chem. A, 2014, 2, 15889–15896 Search PubMed.
- J. Ding, H. Wang, Z. Li, K. Cui, D. Karpuzov, X. Tan, A. Kohandehghan and D. Mitlin, Energy Environ. Sci., 2015, 8, 941–955 CAS.
- B. Campbell, R. Ionescu, Z. Favors, C. S. Ozkan and M. Ozkan, Sci. Rep., 2015, 5, 14575–14582 CrossRef CAS PubMed.
- L. Wang, Z. Schnepp and M. M. Titirici, J. Mater. Chem. A, 2013, 1, 5269–5273 CAS.
- C. D. Wang, M. H. Lan, Y. Zhang, H. D. Bian, M.-F. Yuen, K. Ostrikov, J. J. Jiang, W. J. Zhang, Y. Y. Li and J. Lu, Green Chem., 2016, 18, 3029–3039 RSC.
- X. Zhou, F. Chen, T. Bai, B. Long, Q. Liao, Y. Ren and J. Yang, Green Chem., 2016, 18, 2078–2088 RSC.
- N. Liu, K. Huo, M. T. McDowell, J. Zhao and Y. Cui, Sci. Rep., 2013, 3, 1919–1926 Search PubMed.
- N. Liu, Z. Lu, J. Zhao, M. T. McDowell, H. W. Lee, W. Zhao and Y. Cui, Nat. Nanotechnol., 2014, 9, 187–192 CrossRef CAS PubMed.
- M. N. Obrovac and V. L. Chevrier, Chem. Rev., 2014, 114, 11444–11502 CrossRef CAS PubMed.
- X. H. Liu, J. W. Wang, S. Huang, F. Fan, X. Huang, Y. Liu, S. Krylyuk, J. Yoo, S. A. Dayeh, A. V. Davydov, S. X. Mao, S. T. Picraux, S. Zhang, J. Li, T. Zhu and J. Y. Huang, Nat. Nanotechnol., 2012, 7, 749–756 CrossRef CAS PubMed.
- J. R. Szczech and S. Jin, Energy Environ. Sci., 2011, 4, 56–72 CAS.
- K. Ogata, E. Salager, C. J. Kerr, A. E. Fraser, C. Ducati, A. J. Morris, S. Hofmann and C. P. Grey, Nat. Commun., 2014, 5, 3217 CAS.
- M. L. Terranova, S. Orlanducci, E. Tamburri, V. Guglielmotti and M. Rossi, J. Power Sources, 2014, 246, 167–177 CrossRef CAS.
- X. S. Zhou, Y. X. Yin, L. J. Wan and Y. G. Guo, Adv. Energy Mater., 2012, 2, 1086–1090 CrossRef CAS.
- F. Luo, B. N. Liu, J. Y. Zheng, G. Chu, K. F. Zhong, H. Li, X. J. Huang and L. Q. Chen, J. Electrochem. Soc., 2015, 162, A2509–A2528 CrossRef CAS.
- L. Wang, B. Gao, C. Peng, X. Peng, J. Fu, P. K. Chu and K. Huo, Nanoscale, 2015, 7, 13840–13847 RSC.
- J. Liu, P. Kopold, P. A. van Aken, J. Maier and Y. Yu, Angew. Chem., Int. Ed., 2015, 127, 9768–9772 CrossRef.
- N. Lin, J. B. Zhou, Y. C. Zhu and Y. T. Qian, J. Mater. Chem. A, 2014, 2, 19604–19608 CAS.
- F. T. Chen, X. S. Jiang, R. Liu and J. Yin, Polym. Chem., 2011, 2, 614–618 RSC.
- G. Dingemans, C. A. A. van Helvoirt, D. Pierreux, W. Keuning and W. M. M. Kessels, J. Electrochem. Soc., 2012, 159, H277–H285 CrossRef CAS.
- N. Lin, Y. Han, J. Zhou, K. L. Zhang, T. J. Xu, Y. C. Zhu and Y. T. Qian, Energy Environ. Sci., 2015, 8, 3187–3191 CAS.
- Y. F. Shi, F. Zhang, Y. S. Hu, X. H. Sun, Y. C. Zhang, H. L. Lee, L. Q. Chen and G. D. Stucky, J. Am. Chem. Soc., 2010, 132, 5552–5553 CrossRef CAS PubMed.
- Y. Yao, M. T. McDowell, I. Ryu, H. Wu, N. Liu, L. B. Hu, W. D. Nix and Y. Cui, Nano Lett., 2011, 11, 2949–2954 CrossRef CAS PubMed.
- X. N. Li, J. W. Liang, Z. G. Hou, W. Q. Zhang, Y. Wang, Y. C. Zhu and Y. T. Qian, J. Power Sources, 2015, 293, 868–875 CrossRef CAS.
Footnote |
| † Electronic supplementary information (ESI) available: Experimental section auxiliary analysis such as XRD patterns, TGA and FT-IR plots of the as-prepared samples. See DOI: 10.1039/c6ra16336j |
| This journal is © The Royal Society of Chemistry 2016 |

