DOI:
10.1039/C6RA16226F
(Paper)
RSC Adv., 2016,
6, 78136-78150
Enhanced adsorption of Cu(II) ions on chitosan microspheres functionalized with polyethylenimine-conjugated poly(glycidyl methacrylate) brushes†
Received
22nd June 2016
, Accepted 10th August 2016
First published on 10th August 2016
Abstract
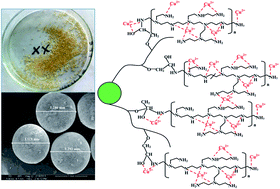
To enhance the adsorption capacity of crosslinked chitosan (CCS) microspheres towards Cu(II) ions, well-defined poly(glycidyl methacrylate) (PGMA) brushes were grafted onto the surfaces of CCS microspheres via surface-initiated atom transfer radical polymerization (ATRP) for subsequent conjugation of polyethylenimine (PEI). The resultant PEI-grafted CCS (defined as CCS-g-PGMA-c-PEI) microsphere was used as an effective adsorbent to uptake Cu(II) ions from aqueous solution. Success in each functionalization step was ascertained by ATR-FTIR, XPS, SEM and water contact angle measurements. Batch adsorption experiments were performed to determine adsorption kinetics, adsorption isotherms and thermodynamics of Cu(II) ions on the CCS-g-PGMA-c-PEI microspheres. The adsorption equilibrium of Cu(II) ions on the microspheres was found to be rapidly established within 60 min at an optimal solution pH of 5.0, and the adsorption kinetics was well represented by the pseudo-second-order model, together with a significant effect of mass transfer on the Cu(II) adsorption rate. The Langmuir-fitted maximum adsorption capacity was about 3.58 mmol g−1 (229 mg g−1), and the calculated thermodynamic parameters demonstrated an endothermic and spontaneous adsorption process of Cu(II) ions. The PEI-grafted CCS microspheres also exhibited good regenerability and stability for recycle applications. The postulated adsorption mechanism was proposed to account for the adsorption process of Cu(II) ions on the CCS-g-PGMA-c-PEI microspheres.
Introduction
Copper has been regarded as one of the most toxic metals to the environment and human heath due to its inherent non-biodegradability, biological magnification and long persistence in the environment.1 The main anthropogenic sources of copper contamination are associated with wastewater discharge and atmospheric deposition from mining activities, electroplating, agricultural fungicides and pesticides, pigments, metal finishing, foundry industries, wood manufacturing, municipal waste, and sewage sludge.1,2 The adverse effect of toxic divalent copper on the human body has been widely recognized by causing high blood pressure, severe mucosal irritation, capillary damage, anemia, hepatic damage, necrotic changes in the liver and kidney. Because of its high toxicity and bioaccumulation tendency in the food chain, copper has been listed on the list of priority pollutants by the World Health Organization (WHO) with the upper limit of 1.3 mg L−1 for public sewers and the maximum limit of 0.05 mg L−1 in drinking water.3 Thus, it is necessary to find an effective strategy to control and reduce the concentration levels of copper ions in industrial discharges.
To address the growing need to remove the toxic copper ions from the aqueous solution, various approaches have been developed over decades, such as chemical precipitation,4 electrocoagulation,5 ion exchange,6 membrane separation,7 solvent extraction,8 electrolysis9 and adsorption.10–13 Among these techniques, adsorption has been considered as one of the most efficient and promising method to decontaminate wastewater containing heavy metal ions owing to its easy operation, simplicity of design, high selectivity and the possibility to reuse adsorbent. By far, a variety of materials, including activated carbon,14 resins,15 biomass,16 clay minerals,17 polymeric materials,12 and biosorbents,18,19 have been used as adsorbent to remove copper ions from water and industrial effluents. In recent decades, materials of biological origin with biodegradable and eco-friendly properties, such as coconut shell,20 chitin,21 cellulose,22 lignin,23 and chitosan,24 have been proved to be effective and, in some cases, superior to the synthetic resins for the uptake of heavy metal ions, due to their low cost, availability of large quantities, no secondary pollution, and capacity of lowering heavy metal concentration to parts per billion.25,26
The use of chitosan as a natural adsorptive polymer in removing a wide range of contaminants has been a major development in the past years. Chitosan, as a naturally occurring polysaccharide obtained from waste products, such as crustacean shells of shrimp, crabs and lobsters, and fungal biomass,27 is a polymer derived from N-deacetylation of chitin, and it has been well established as an promising natural adsorbent for the removal of heavy metal ions due to the presence of abundant amino (–NH2) and hydroxyl (–OH) groups.28 These active groups serve as adsorptive and binding sites to coordinate and complex heavy metal ions.29 However, the end product of raw chitosan is mainly in flake form during the production process, which is not efficient in adsorption process due to its poor adsorption characteristics and poor mechanical properties. To circumvent the problems of poor adsorption performance and mechanical strength, the flake chitosan are usually converted into chitosan gel beads and further cross-linked by cross-linking agents. The cross-linked chitosan beads are not only easy to handle and easier diffusion of target metal ions to adsorption sites, but also have better chemical stability and mechanical resistance for practical applications. Cross-linking agents, such as glutaraldehyde,30 ethylene glycol diglycidylether,31 and epichlorohydrin,32 have been widely utilized to crosslink chitosan microspheres for the enhancement of chemical stability and mechanical resistance. However, the consumption of active amino (–NH2) or hydroxyl (–OH) groups during the cross-linking process has inevitably caused a significant decrease in the adsorption capacity of chitosan towards heavy metal ions. This may limited the usage of chitosan as an effective adsorbent to uptake heavy metal ions in the wastewater treatment fields. Consequently, various efforts have been devoted to functionalizing cross-linked chitosan (CCS) for enhanced adsorption capacity and adsorption performance towards heavy metal ions.33
Different functional groups, such as carboxylic (–COOH), hydroxyl (–OH), sulfonic (–SO3H), phosphate (–PO4H2), acryl amino (–CONH2) and amino (–NH2) groups, have been introduced onto the CCS microsphere surfaces for improved adsorption capacity towards heavy metal ions.34,35 Among these, the amine groups can not only effectively chelate cationic metal ions to form stable metal–complex compounds, but also uptake anionic metal ions through electrostatic interaction or hydrogen bonding. Polyethylenimine (PEI), a typical water-soluble polyamine, contains a large number of primary and secondary amine groups on the macromolecular chains, and thus it exhibits high adsorption performance to heavy metal ions.36–38 Owing to its inherently good water solubility, PEI has to be affixed to an insoluble support to avoid its leaching during adsorption process. Various adsorbent materials, such as biomass,37 insoluble polymers,39 silica40 and cellulose,41 have been selected as host materials to immobilize PEI, and the main fixation manner is to chemically bind PEI chains onto the host materials through a cross-linker like chloropropyl trimethoxysilane,42 glutaraldehyde,43 and 4-bromobutyryl chloride.37 However, to the best of our knowledge, few studies have been reported to introduce PEI onto the CCS microsphere surfaces for improved adsorption performance to heavy metals ions. Particularly, although different surface modification techniques, such as chemical binding,44 molecular imprinting45 and graft copolymerization,46 have been utilized to functionalize the CCS microspheres, no literature have been documented to covalently attach PEI to the functional polymer chains, which were grafted onto the CCS microsphere surfaces via surface-initiated graft polymerization, for effective uptake of heavy metal ions. Therefore, it offers a potential alternative to use the robust functional polymeric chains as bridge-linkers to immobilize PEI onto the CCS microspheres for enhanced adsorption properties.
Surface-initiated atom transfer radical polymerization (SI-ATRP) has been extensively investigated for grafting functional polymer brushes in a controlled manner on a solid substrate in recent years.47,48 Compared to other “living” radical system, SI-ATRP represents a simple, inexpensive, and more general method for controlled radical polymerization. Although SI-ATRP has been widely used to prepare active polymer brushes on different adsorbent materials,49,50 only a few studies have reported the utilization of ATRP for the surface modification of the CCS microspheres.24,51 Li et al. reported that the grafted polyacrylamide brushes from the surfaces of chitosan beads via ATRP can enhance the adsorption capacity of Hg(II) ions.51 Our recent studies demonstrated that pH-sensitive poly(methacrylic acid) brushes grafted from the CCS microsphere surfaces via SI-ATRP caused a substantial increase in the adsorption capacity to Cd(II) ions.24
Accordingly, the purpose of this study is to graft poly(glycidyl methacrylate) (PGMA) brushes onto the CCS microspheres via SI-ATRP as reactive anchors for subsequent covalent conjugation of branched PEI macromolecules. The functionalized CCS microspheres are further used as a highly efficient adsorbent to uptake Cu(II) ions from aqueous solution. As schematically illustrated in Fig. 1, an alkyl bromide-terminated initiator was firstly immobilized on the CCS microsphere surface via triethylamine (TEA)-catalyzed condensation reaction, followed by grafting of well-defined PGMA brushes onto the CCS microsphere surface via SI-ATRP to provide abundant epoxy groups. Finally, the branched PEI was covalently conjugated onto the side chains of PGMA brushes by the ring-opening reaction between the amino groups of PEI and the epoxy groups of the PGMA chains (defined as CCS-g-PGMA-c-PEI). Each functionalization step of the CCS microspheres were characterized, respectively, by attenuated total reflectance-Fourier transform infrared (ATR-FTIR) spectroscopy, X-ray photoelectron spectroscopy (XPS), scanning electron microscopy (SEM) and static water contact angle measurements. Batch adsorption experiments were carried out to determine adsorption kinetics, adsorption isotherms and thermodynamic parameters of the Cu(II) ions on the functionalized CCS microspheres. The postulated adsorption mechanism was also proposed to interpret the specific interactions between function groups and Cu(II) ions.
 |
| Fig. 1 Schematic illustration of a three-step synthesis of the CCS-g-PGMA-c-PEI microspheres: (a) the immobilization of an alkyl bromide-terminated initiator on the CCS microsphere surfaces via TEA-catalyzed condensation reaction (i.e. the CCS-Br surfaces), (b) surface-initiated ATRP of GMA from the CCS-Br surfaces to graft the PGMA brushes (i.e. the CCS-g-PGMA surfaces), and (c) covalent conjugation of PEI onto the CCS-g-PGMA surfaces by the ring-opening reaction between the amino groups of PEI and the epoxy groups of the PGMA chains (i.e. the CCS-g-PGMA-c-PEI surfaces). | |
Experimental
2.1 Materials
Chitosan (CS, 85% of N-deacetylation and Mw of 80
000) and ethylene glycol diglycidyl ether (EGDE, 99%) were purchased from Gracia Chemical Technology Co. (Chengdu, China). Branched polyethylenimine (PEI, Mw of 800), 2,2′-bipyridine (bpy, 99%) and glycidyl methacrylate (GMA, 99%) were obtained from Aladdin® Co. (Shanghai, China). Triethylamine (TEA, 99.9%), cupric bromide (CuBr2, 98%), cuprous bromide (CuBr, 98%) 2-bromoisobutyryl bromide (BIBB, 98%), ethylenediaminetetraacetic acid (EDTA, >99%), and copper standard solution (1000 ppm) were obtained from Sigma-Aldrich Chemical Co. (St. Louis, MO, USA). Chemical reagents, such as sodium hydroxide, cupric nitrate (Cu(NO3)2, 99%) and acetic acid, and organic solvents, such as tetrahydrofuran (THF), ethanol, acetone and toluene, were purchased from Changzheng Chemical Reagent Co. (Chengdu, China). Water in TEA and THF was removed by reaction with sodium and calcium hydride, respectively, followed by distillation. All the reagents were of analytical grade and used as received, unless otherwise stated. The deionized water used in the following experiments was purified using an Ulupure reverse osmosis system (Ultrapure Technol. Co., Chengdu, China).
2.2 Immobilization of ATRP initiators onto the CCS microspheres
The cross-linked chitosan (CCS) microspheres were prepared by a well-established precipitation-crosslinking method described in detail previously.52 Briefly, the CS flakes were converted into the CS hydrogel beads by dissolving in acetic acid and subsequently injecting in NaOH solution for precipitation. The CS hydrogel beads were cross-linked by suspending in a 0.3 mol L−1 EDGE solution at 70 °C for 6 h under continuous agitation. The CCS microspheres were washed thoroughly with copious amounts of deionized water and vacuum-dried at ambient temperature for 48 h. The immobilization of an alkyl bromide-terminated ATRP initiator on the dried CCS microsphere surface was achieved by TEA-catalyzed condensation reaction using a similar procedure described previously.24 Typically, a 2 g aliquot of CCS microspheres was added into 10 mL of dry THF containing 1 mL of TEA (7.2 mmol). The mixtures were cooled in an ice bath under continuous stirring for 30 min, and then 0.89 mL of BIBB (1.65 g, 7.2 mmol) was added dropwise using a syringe. The reaction was allowed to proceed for 2 h under continuous stirred at 0 °C and then at ambient temperature for 12 h. The brominated CCS microspheres (referred to as CCS-Br surfaces) were washed with copious amount of acetone, ethanol, deionized water, respectively, prior to being dried in vacuum oven at room temperature for 48 h.
2.3 Grafting of PGMA brushes onto the CCS microspheres via SI-ATRP
To graft PGMA brushes from the CCS-Br microsphere surfaces, a typical solution polymerization process with a molar ratio of [GMA, monomer]
:
[CuBr, catalyst]
:
[CuBr2, deactivator]
:
[bpy, ligand] at 100
:
1.0
:
0.2
:
2.0 in a mixture of methanol and deionized water (4
:
1, v/v) was carried out as follows. A 2 mL aliquot of GMA (14.7 mmol), 45.8 mg (0.29 mmol) of bpy and 1 g of CCS-Br microspheres were introduced to 5 mL the methanol–water mixture in a Pyrex® tube, followed by purging with argon for 30 min. Subsequently, approximately 21.5 mg of CuBr (0.15 mmol) and 6.6 mg of CuBr2 (0.029 mmol) were added to the reaction mixture. The reaction tube was sealed with a rubber stopper, and then allowed to proceed at 25 °C under continuous stirring for a predetermined 1 and 6 h, respectively. At the end of reaction, the PGMA-grafted CCS microspheres were thoroughly washed with copious amounts of ethanol and deionized water to ensure the complete removal of physically-adsorbed reactants, and then were vacuum-dried at room temperature for 48 h. The resultant PGMA-grafted microspheres obtained from 1 and 6 h of ATRP reaction were defined as the CCS-g-PGMA1 and CCS-g-PGMA2, respectively. The grafting yield (GY) and grafting density (GD) values were calculated by using the previously-established equations,24 and were described in detail in ESI S1.1.†
2.4 Covalent conjugation of PEI onto the CCS microspheres
The covalent conjugation of PEI onto the CCS-g-PGMA microsphere surfaces was accomplished by ring-opening reaction between the amino groups of PEI and the epoxy groups of the PGMA chains. Typically, a 1.0 g aliquot of CCS-g-PGMA microspheres and 2.0 mL of PEI (2.1 g, 2.63 mmol) were introduced to a 50 mL round-bottom flask containing 10.0 mL deionized water. The reaction mixture was allowed to proceed under vigorously stirring at 50 °C for 24 h. After the reaction, the PEI-conjugated CCS-g-PGMA microspheres were thoroughly washed with copious amounts of ethanol and deionized water to remove physically-adsorbed PEI, if any, and were subsequently vacuum-dried at room temperature for 48 h prior to being stored in a vacuum desiccators. The resultant PEI-immobilized CCS microspheres were defined as the CCS-g-PGMA-c-PEI microspheres.
2.5 Surface characterization
The change in surface characteristics before and after each functionalization step on the CCS microspheres was determined by SEM, ATR-FTIR, and XPS and static water contact angle measurement, respectively. SEM images of the pristine and functionalized CCS microspheres were captured on a JSM-5900LV SEM (Jeol, Tokyo, Japan) at different magnifications (×100, ×200, and ×1000) to ascertain the change in surface morphologies. The ATR-FTIR and XPS spectra were recorded to determine the change in chemical compositions on the CCS microsphere surfaces at each functionalization step. The ATR-FTIR spectra were obtained using a GX FTIR spectrometer (Perkin Elmer Inc., Waltham, MA) equipped with a smart ATR performer accessory using a germanium (Ge) crystal with an incident angle of 45° and a sampling area of 2 mm2. Detailed operation procedures have been described in detail previously.24 The XPS spectra were recorded on a Kratos AXIS His spectrometer using a monochromatized Al Ka X-ray source (1486.6 eV photons) using a similar procedure described in detail previously.53 The static water contact angles of the pristine and functionalized CCS microspheres were measured on a contact angle goniometer (Powereach JC2000C1, Shanghai) at 25 °C and 60% relative humidity with a 3 μL water droplet. Before measurement, the microspheres were firstly pressed to obtain flat surface similarly in previous studies.24 The contact angles reported were the mean values from at least three samples.
2.6 Batch adsorption experiment
The pristine CCS and CCS-g-PGMA2-c-PEI (from 6 h of ATRP reaction time) microspheres were used in all the adsorption experiments unless otherwise specifically stated. Batch adsorption experiments were carried out to determine the effect of solution pH and the competitive cationic ions on the Cu(II) adsorption, adsorption kinetics, adsorption isotherms and thermodynamic parameters of Cu(II) ions for the pristine and functionalized CCS microspheres. All the batch adsorption experiments were conducted in a 500 mL conical flask, which contained 200 mL of Cu(II) solution and 100 mg of the adsorbents. The adsorption was allowed to proceed at 25 °C at 150 rpm in a thermostatic orbital shaker for a predetermined time. The Cu(II) ion concentration was analyzed by using an atomic absorption spectrophotometer (AAS, JKI-AA320N, Shanghai, China). Detailed procedures were described in the ESI section S1.2–S1.7† for determining the effect of solution pH, adsorption kinetics, adsorption isotherms, the competition adsorption and regeneration profiles on the pristine CCS and CCS-g-PGMA2-c-PEI microspheres.
Results and discussion
The surface modification of the CCS microspheres is schematically illustrated in Fig. 1. The synthesis process of CCS-g-PGMA-c-PEI microspheres mainly involves three step: (i) the immobilization of an alkyl bromide-terminated initiator on the CCS microsphere surfaces via TEA-catalyzed condensation reaction (i.e. the CCS-Br surfaces), (ii) grafting of PGMA brushes onto the CCS microsphere surfaces via surface-initiated ATRP of GMA (i.e. the CCS-g-PGMA surfaces), and (iii) covalent conjugation of PEI onto the CCS-g-PGMA surfaces by the ring-opening reaction between the amino groups of PEI and the epoxy groups of the PGMA chains (i.e. the CCS-g-PGMA-c-PEI surfaces). The resultant PEI-immobilized CCS microspheres are used as an efficient adsorbent for the uptake of Cu(II) ions from aqueous solution. The details of surface functionalization for the CCS microspheres and adsorption behaviour toward Cu(II) ions are discussed below.
3.1 Surface characterization of the functionalized CCS microspheres
The CCS microspheres are synthesized by the well-established precipitation-crosslinking method.51 The wet and dry CCS microspheres show spherical shape and uniform size, as shown in ESI Fig. S1.† The wet hydrogel microspheres with milk-white colour are about 5.5 mm in diameter (ESI, Fig. S1a†), while the dry CCS microspheres with shallow-yellow colour are about 1.0 mm in diameter (ESI, Fig. S1b†). The dry CCS microspheres were chosen as substrates for surface modification to obtain PEI-immobilized CCS microspheres. Success in each functionalization step of the CCS-g-PGMA-c-PEI microspheres is confirmed by SEM, ATR-FTIR, XPS and water contact angle measurements.
3.1.1 SEM imaging. The change in surface morphologies and shape for the pristine and functionalized CCS microspheres was characterized by SEM imaging. Fig. 2 shows the representative SEM images at different magnifications (×100, ×200, and ×1000) of the pristine CCS, CCS-g-PGMA2 (from 6 h of ATRP reaction time), and CCS-g-PGMA2-c-PEI microspheres. The CCS microspheres before and after surface functionalization are clearly spherical in shape. The pristine CCS microspheres show a relatively smooth surface (Fig. 2a), together with a size of approximately 1.169 ± 0.034 mm in diameter (Fig. 2a1 and a2). Upon grafting of the PGMA brushes from 6 h of ATRP reaction, the surfaces of the CCS-g-PGMA2 microspheres appear to be much rougher (Fig. 2b–b2), and the size noticeably increases to around 1.193 ± 0.037 mm (Fig. 2b). The difference in surface morphologies between the pristine CCS and CCS-g-PGMA2 microspheres suggests the successful grafting of PGMA brushes onto the substrates. The pendent epoxy groups in the side chains of the PGMA brushes provides abundant anchor sites for further conjugation of branched PEI. Further conjugation of branched PEI results in a slight increase in the microsphere diameter as well as surface roughness (Fig. 2c–c2), indicative of the successful conjugation of branched PEI molecules onto the PGMA brushes. Therefore, the grafting of dense and thick PEI–PGMA conjugates onto the CCS microspheres is expected not only to change the surface features of microspheres, but also to substantially enhance their adsorption capacity towards heavy metal ions.
 |
| Fig. 2 Representative SEM images at different magnifications (×100, ×200, and ×1000) for the surface morphology of the (a–a2) pristine CCS, (b–b2) CCS-g-PGMA2 microsphere from 6 h of ATRP reaction, and (c–c1) CCS-g-PGMA-c-PEI microspheres. | |
3.1.2 FTIR spectra. To determine functional groups on the CCS microspheres before and after surface functionalization, the ATR-FTIR spectra were characterized for the microsphere surfaces. Fig. 3 shows the respective FTIR spectra of the surfaces for the pristine CCS, CCS-g-PGMA1 from 1 h of ATRP reaction, CCS-g-PGMA2 from 6 h of ATRP reaction, and CCS-g-PGMA2-c-PEI microspheres. The main bands of the pristine CCS microspheres include the overlapped stretching vibrations of O–H and N–H (νN–H/O–H) at 3335 cm−1, the C
O stretching vibration at 1643 cm−1 (νC
O, amide I) and the C–O stretching vibrations (νC–O) from glycosidic bonds at 1072 cm−1 and 1018 cm−1, which are characteristic bands of polysaccharide (Fig. 3a).24 The successful grafting of PGMA brushes can be deduced from the appearance of an additional minor band at 1721 cm−1 on the FTIR spectra of the CCS-g-PGMA microspheres (Fig. 3b and c), attributable to the stretching vibrations of carboxylic groups (ν–COO–) of the PGMA brushes. The characteristic bands at 1526 cm−1, assigned to the asymmetric stretching vibrations of the carboxylate groups, further confirm the successful grafting of PGMA brushes onto the CCS microsphere surfaces.54 Furthermore, the relative intensity of the –COO– peaks for the CCS-g-PGMA2 surface from 6 h of ATRP reaction is much stronger than that of the CCS-g-PGMA1 surface from 1 h of the ATRP reaction, indicating that the thickness of the PGMA brushes on the CCS microsphere surfaces increase with the increase in reaction time. Upon the covalent conjugation of branched PEI on the CCS-g-PGMA2 surfaces, an additional peak at 1585 cm−1, attributable to the N–H bending vibrations (δN–H), and the noticeable increase in the relative intensity of the N–H stretching vibrations (νN–H) at 3402 cm−1 can be evidently observed on the CCS-g-PGMA2-c-PEI surfaces (Fig. 3d). These results indicate the successful immobilization of branched PEI onto the side chains of PGMA brushes.
 |
| Fig. 3 ATR-FTIR spectra of the surfaces for the (a) pristine CCS, (b) CCS-g-PGMA1 from 1 h of ATRP reaction, (c) CCS-g-PGMA2 from 6 h of ATRP reaction, and (d) CCS-g-PGMA-c-PEI microspheres. | |
3.1.3 XPS analysis. The chemical compositions of the CCS microspheres after each functionalization were further characterized by XPS measurement. For comparison, the XPS spectra of the pristine CCS microspheres were also obtained and are shown in ESI Fig. S2.† The curve-fitted C 1s core-level spectrum of the pristine CCS microsphere consists of four peak components with binding energies (BEs) at 284.6, 285.5, 286.2 and 288.4 eV, attributable to C–H, C–N, C–O and O
CNH species, respectively (ESI, Fig.S2b†).55 The characteristic O
CNH peak component is derived from crosslinking reactions between the epoxy groups of EDGE linkers and the amino groups of the chitosan.56 The area ratio of [C–H]
:
[C–N]
:
[C–O]
:
[O
CNH] at circa 6.5
:
1.0
:
5.0
:
1.43 is much different from the theoretical value of 2
:
1
:
4
:
1 for the pristine chitosan microspheres (Table 1). The [N]/[C] ratio of 0.148, as determined from the sensitivity factor-corrected N 1s and C 1s core-level spectral area ratio, is comparable to the theoretical value of 0.2 for the chitosan molecule (ESI, Fig. S2†).
Table 1 Static water contact angles and surface composition of the pristine and functionalized CCS microspheres
Sample |
Surface compositiong (molar ratio) |
GDh (mmol g−1) |
WCAi (mean ± SD) |
0.1 M HOAcj |
Pristine CS corresponds to an uncross-linked chitosan microspheres. CCS refers to the cross-linked chitosan microspheres obtained after immersed in a 0.3 M EDGE solution for 6 h at 70 °C. CCS-Br was obtained after the CCS microspheres reacted with 2-bromoisobutyryl bromide (BIBB) in 15 mL of dry THF containing 1 : 1 (molar ratio) BIBB and triethylamine (TEA) for 12 h at room temperature. CCS-g-PGMA1 was obtained at a feed ratio of [GMA] : [CuBr] : [CuBr2] : [bpy] = 50 : 1 : 0.1 : 1.2 in a mixture solution of methanol and deionized water for 1 h at 25 °C. CCS-g-PGMA2 was obtained after 6 h of ATRP reaction time at 25 °C. CCS-g-PGMA2-c-PEI was obtained after CCS-g-PGMA2 exposed to a 10 mg mL−1 PEI solution at 50 °C for 24 h. Determined from the curve-fitted C 1s core-level XPS spectra, and the theoretical values are shown in parentheses. GD refers to the grafting density of the PGMA brushes and PEI. WCA denotes static water contact angles, SD is standard deviation. Solubility behaviour was determined by immersion in the respective 0.1 M HOAc and 1 M NaOH solution for 24 h under agitation at room temperature. All the microsphere types are insoluble in 1 M NaOH solution. |
Pristine CSa |
[C–H] : [C–N] : [C–O] : [O CNH] = 1.8 : 1.0 : 4.2 : 1.1 (2 : 1:4 : 1) |
— |
45 ± 3° |
Soluble |
CCSb |
[C–H] : [C–N] : [C–O] : [O CNH] = 6.5 : 1.0 : 5.0 : 1.43 |
— |
54 ± 2° |
Insoluble |
CCS-Brc |
[C–H] : [C–N] : [C–O/C–Br] : [O CNH] = 6.9 : 1.0 : 6.5 : 1.7 |
— |
68 ± 3° |
Insoluble |
CCS-g-PGMA1d |
[C–H] : [C–N] : [C–O] : [O C–O] = 5.4 : 0.6 : 2.8 : 1.0 |
0.115 ± 0.011 |
65 ± 2° |
Insoluble |
CCS-g-PGMA2e |
[C–H] : [C–O] : [O C–O] = 3.1 : 2.7 : 1.0 (3 : 3 : 1) |
0.363 ± 0.018 |
61 ± 3° |
Insoluble |
CCS-g-PGMA2-c-PEIf |
[C–H] : [C–N] : [C–O] : [O C–O] = 3.3 : 2.6 : 2.7 : 1.0 |
0.094 ± 0.007 |
43 ± 2° |
Insoluble |
To graft functional polymer brushes via surface-initiated ATRP reaction, a monolayer of alkyl halide-terminated initiator is indispensable. The immobilization of alkyl bromide-terminated ATRP initiator onto the CCS microspheres was achieved by a TEA-catalyzed condensation reaction between the hydroxyl/amino groups on the CCS microspheres and 2-bromoisobutyryl bromide (BIBB). Fig. S2d–f† show the wide scan, C 1s and Br 3d core-level spectra of the XPS spectra of the CCS-Br microspheres. Three additional signals with BEs at 70, 189, and 256 eV, attributable to the Br 3d, Br 3p and Br 3s species,55 respectively, are observed in the wide scan spectrum, indicative of the successful immobilization of the alkyl bromide-terminated ATRP initiator onto the microsphere surface (ESI, Fig. S2d†). The [Br]/[C] ratio, determined from the sensitivity factor-corrected Br 3d and C 1s core-level spectral area ratios, is circa 0.0086. The successful immobilization of BIBB on the microsphere surface is further confirmed by the increase in the relative amount of C–O/C–Br and O
CNH peaks in the curve-fitted C 1s core-level spectrum (ESI, Fig. S2e†). The corresponding doublet peaks of Br 3d5/2 (BE at 70.4 eV) and Br 3d3/2 (BE at 71.6 eV) of the Br 3d core-level spectrum for the CCS-Br surface are consistent with the presence of the alkyl bromide species (ESI, Fig. S2f†).55 Thus, the alkyl bromide groups have been successfully introduced onto the microsphere surface to cater for the subsequent ATRP reaction.
The grafting of PGMA brushes onto the CCS microspheres was accomplished via surface-initiated ATRP. Fig. 4a–f show the respective wide scan, C 1s and Br 3d core-level spectra of the CCS-g-PGMA from 1 and 6 h of ATRP reaction. The persistence of N 1s signal on the wide scan spectrum for the CCS-g-PGMA1 from 1 h of ATRP reaction indicates that the thickness of the PGMA brushes is less than the probing depth of XPS technique (i.e., 8 nm in an organic matrix).55 Deconvolution of the C 1s core-level spectrum yields four peak components with BEs at 284.6, 285.5, 286.5, and 288.8 eV, attributable to the C–H, C–N, C–O, and O
C–O species, respectively (Fig. 4b). The appearance of an additional characteristic O
C–O group of PGMA suggests the successful grafting of PGMA brushes onto the CCS microsphere surfaces. The area ratio of [C–H]
:
[C–O]
:
[O
C–O] at 5.4
:
2.8
:
1.0 is much less than the theoretical value of 3
:
3
:
1 of PGM molecule (Table 1), indicative of a relatively thin PGMA brushes grafted on the microsphere surface. Upon prolonging reaction time to 6 h, the disappearance of the N 1s signal on the wide scan spectrum (Fig. 4d) and the evident increase in the relative amount of the C–O (BE at 286.2 eV) and O
C–O (BE at 288.8 eV) on the curve-fitted C 1s core-level spectrum (Fig. 4e) suggest that the thickness of the PGMA brushes grafted on the CCS microsphere surface is more than 8 nm. The area ratio of [C–H]
:
[C–O]
:
[O
C–O] at ca. 3.1
:
2.7
:
1.0 is close to the theoretical value of 3
:
3
:
1 for the GMA repeat unit structure (Table 1). These above results are in good agreement with the previous findings that surface-initiated ATRP is strongly dependent on the reaction time and the initial concentration of monomer, and that the thickness of the polymer brushes increase linearly with polymerization time.57,58 Thereby, the dense and thick PGMA brushes have been successfully grafted onto the CCS microsphere surface for subsequent conjugation time.
 |
| Fig. 4 The wide scan, C 1s, Br 3d and N 1s core-level XPS spectra of the surfaces for the (a–c) CCS-g-PGMA1 from 1 h of ATRP reaction, (d–f) CCS-g-PGMA2 from 6 h of ATRP reaction, and (g–i) CCS-g-PGMA-c-PEI microspheres. | |
Polyethylenimine (PEI) is a polymer with repeating unit composed of the amine groups and two carbon aliphatic spacers. Branched PEI containing abundant primary, secondary and tertiary amino groups has been extensively utilized as an effective modification reagent for amino-functionalized adsorbents. The covalent conjugation of branched PEI was accomplished by ring-opening reaction between the amine groups of PEI and the epoxy groups of the PGMA brushes. Fig. 4g–i show the wide scan, C 1s and N 1s core-level XPS spectra of the PEI-grafted CCS microspheres, respectively. The successful conjugation of PEI can be deduced from the appearance of an additional N 1s signal at around 400 eV in the wide scan spectrum of the CCS-g-PGMA2-c-PEI surfaces as compared to that of the CCS-g-PGMA2 surfaces (Fig. 4g).55 The [N]/[C] ratio at circa 0.28, determined from sensitivity factor-corrected N 1s and C 1s core-level spectral area ratio, is comparable to the theoretical value of 0.33 for the repeat units of the branched PEI molecules (Table 1).59 The appearance of a novel peak component with BE at 285.5 eV, attributable to the C–N species, in the curve-fitted C 1s core-level spectrum is well consistent with the successful conjugation of PEI on the CCS microspheres (Fig. 4h). The corresponding curve-fitted N 1s core-level spectrum is composed of two peak components with BEs at 399.2 and 401.2 eV, attributable to amine (–NH2/–NH) and imine groups (–N
) species, respectively (Fig. 4i). The characteristic imine and tertiary amino groups are well consistent with the branched PEI molecular structure. Thus, the PEI-grafted CCS microspheres have been successfully synthesized to serve as a novel adsorbent for Cu(II) uptake from aqueous solution.
3.1.4 Grafting density. Generally, the grafting of polymer brushes via surface-initiated ATRP takes place in a well-defined and controlled manner. Fig. S3† shows the respective grafting yield (GY) and grafting density (GD) for the PGMA brushes formed on the CCS microspheres as a function of grafting time. An approximate linear increase in the GY and GD values of the PGMA brushes with reaction time can be evidently observed for the CCS-g-PGMA microsphere surfaces. The GD values from 1 and 6 h of polymerization time are circa 0.115 ± 0.011 and 0.363 ± 0.018 mmol g−1, respectively (Table 1), which is well consistent with the aforementioned XPS results. Therefore, the surface density of epoxy groups on the CCS-g-PGMA2 surface is much higher than that on the CCS-g-PGMA1 surface, which provides more anchoring sites for covalent immobilization of branched PEI. The GD value of CCS-g-PGMA2-c-PEI surface is approximately 0.094 ± 0.007 mmol g−1 (Table 1).
3.1.5 Surface wettability and dissolution test. The change in surface wettability offers further evidence of successful functionalization of the CCS microspheres. The static water contact angles of microspheres after each modification step were obtained, and are shown in Table 1. The increase in the water contact angle of the CCS microsphere surfaces to 54 ± 2° relative to 45 ± 3° of the uncross-linked microsphere is in good agreement with the reduction of amino and hydroxyl groups on the microsphere surface owing to the cross-linking reaction (Table 1). The microsphere surfaces become more hydrophobic after the immobilization of the alkyl bromide initiator, as the static water contact angle increases to 68 ± 3°. Upon grafting of PGMA brushes, the static water contact angle decreases slightly to 61 ± 3° due to the presence of abundant epoxy groups on the microsphere surfaces. The significant improvement in surface hydrophilic property is observed after the conjugation of branched PEI. The static water contact angle of the CCS-g-PGMA2-c-PEI surface decreases markedly to 43 ± 2°, because of the presence of large amounts of amino groups on the branched PEI and abundant hydroxyl groups generated by the ring-opening reaction of the epoxy groups on the PGMA brushes.The chemical stability is of great significance for the repeated use and recycle life of the chitosan microspheres. The dissolution test was performed to evaluate the stability of the uncross-linked hydrogel and CCS microspheres under acidic and alkaline conditions. The uncross-linked CS microsphere is readily to dissolve under acidic conditions (Table 1). This results is consistent with the previous findings that CS is susceptible to an acidic solution with pH less than 4.51 However, all the CCS microsphere (being cross-linked by 0.3 mol L−1 of EDGE) show insoluble and remain unchanged in a 0.1 mol L−1 HOAc and 1 mol L−1 NaOH solution, indicative of a highly chemical stability.
3.2 Adsorption behaviours of the PEI-grafted CCS microspheres
In this study, a Cu(II)-contaminated aqueous solution was used to evaluate the adsorption behaviors of the PEI-grafted CCS microspheres. Different factors, such as solution pH and co-existed cationic ions, were investigated to determine their effect on the adsorption capacity of the CCS-g-PGMA2-c-PEI microspheres. The adsorption kinetics, adsorption isotherms, thermodynamic parameters and regeneration of the Cu(II) ions on the PEI-grafted CCS microspheres were also determined. Details in adsorption features of the PEI-grafted CCS microspheres are discussed as follows:
3.2.1 Effect of solution pH. Solution pH has a significant effect on the adsorption capacity of metal ions on adsorbents, since it not only affects the distribution of metal species in solution, but also results in the change in surface features of the adsorbents in terms of dissociation of functional groups and surface charge.60 Fig. 5 shows the adsorption of Cu(II) ions on the pristine CCS and CCS-g-PGMA2-c-PEI microspheres as a function of solution pH value. The adsorption of Cu(II) on the microspheres was conducted at pH below 6 to avoid the formation of hydroxide precipitates. The adsorption capacities of Cu(II) ions on the pristine CCS and PEI-grafted CCS microspheres both increase with increasing solution pH. At pH below 2.0, only a small amount of Cu(II) ions are adsorbed on the pristine CCS and PEI-grafted CCS microspheres due to the protonation of amino groups on the chitosan and PEI to prevent the cationic adsorbates approaching the adsorption sites via electrostatic repulsion. Upon increasing the solution pH to more than 4, the adsorption capacities of Cu(II) ions increase significantly on the PEI-grafted microspheres rather than on the pristine CCS microspheres. At pH 5, the adsorption capacity of Cu(II) ions on the CCS-g-PGMA2-c-PEI microspheres is circa 0.32 mmol g−1, compared with 0.14 mmol g−1 for the pristine CCS microspheres. The increase in adsorption capacity corresponds to circa 129%. Particularly, the adsorption capacity of Cu(II) ions on the PEI-grafted microspheres increases sharply over the pH range from 2 to 4 before a plateau is observed with further increase in solution pH. Thus, the optimal solution pH for the usage of the CCS-g-PGMA2-c-PEI microspheres is above pH 5.0.
 |
| Fig. 5 The effect of solution pH on the adsorption amount of Cu(II) ions on the pristine CCS and CCS-g-PGMA2-c-PEI microspheres. Experimental conditions: the initial concentration of Cu(II) ions C0 = 0.2 mmol L−1 (i.e. 13 mg L−1), v = 200 mL, T = 298.15 K, m = 100 mg, and adsorption time t = 24 h (solution pH values adjusted by 0.1 mol L−1 HNO3 and 0.1 mol L−1 NaOH solutions). | |
The branched PEI contains primary, secondary and tertiary amino groups in a ratio of circa 25%, 50% and 25%, respectively.61 Taking into account the pKa values of branched PEI (4.5 for primary, 6.7 for secondary, and 11.6 for tertiary amino groups), it is obvious that at pH regions less than 5, the protonation of the amino groups occurs on the PEI-grafted CCS microspheres to produce a positively-charged surface. However, the protonation of branched PEI has been found impossible to achieve 100%, and the degree of protonation hardly exceed 75% even in a highly acidic conditions of pH 2.61 Thus, the electrostatic interactions between the PEI-grafted microspheres and Cu(II) ions are repulsive at lower pH, resulting in a fairly low adsorption capacity for the PEI-grafted microspheres at the solution pH less than 2.0. Moreover, at lower pH, the positively charged hydrogen ions (H+) may compete with Cu(II) ions for binding on the functional groups of the microspheres. The increase in solution pH results in the reduction of protonation degree for the branched PEI and the electrical repulsion force being weaker, thus leading to more Cu(II) ion adsorbed on the PEI-grafted microspheres. Upon increasing solution pH beyond 4, a significant increase in adsorption capacity of Cu(II) ions, indicating that electrical repulsion force is no longer the dominant factor for the metal ions approaching the binding sites.
3.2.2 Adsorption kinetics. Rapid adsorption of metal ions is advantageous, providing a short residence time required for the completion of the practical process. Thereby, the time-dependent behaviour was investigated to determine the adsorption rate of Cu(II) ions on the CCS microspheres. Fig. 6 shows the respective adsorption kinetics of Cu(II) ions on the pristine CCS and PEI-grafted CCS microspheres. Obviously, the adsorption rate of Cu(II) ions on the PEI-grafted microspheres is much faster than that on the pristine CCS microspheres. The adsorption time for reaching equilibrium is circa 60 min for the CCS-g-PGMA2-c-PEI microspheres in relative to circa 240 min for the pristine CCS microspheres. In order to examine the controlling mechanisms of Cu(II) adsorption process on the CCS microspheres, such as mass transfer and chemisorptions. Several adsorption kinetic models, including the pseudo-first-order (PFO), pseudo-second-order (PSO), intraparticle diffusion and liquid film diffusion model, are utilized to interpret the experimental data for making distinction between kinetic and diffusion control.
 |
| Fig. 6 The adsorption kinetics of Cu(II) ions on the (a) pristine CCS and (b) CCS-g-PGMA2-c-PEI microspheres at the initial pH value of 5.0 (final pH in a range of 5.3–5.5). Experimental conditions: C0 = 0.2 mmol L−1 (i.e. 13 mg L−1), v = 200 mL, T = 298.15 K, and m = 100 mg. | |
The Lagergren PFO model is one of the most widely used kinetic equations to describe the adsorption of a solute from a liquid,62 while the PSO model proposed by Ho is used to describe chemisorptions involving valence forces through the sharing or exchange of electrons between adsorbent and adsorbate as covalent force, and ion exchange.63 The PFO and PSO kinetic expression are defined as following eqn (1) and (2), respectively.64
|
 | (2) |
where
kf is the rate constant of PFO reaction (min
−1),
ks is the rate constant of the PSO reaction (g mmol
−1 min
−1),
qt is the adsorbed amount at time
t (min), and
qe denotes the amount adsorbed at equilibrium, both in mmol g
−1. The values of
kf,
ks and
qe are all obtained by non-linear fitting, and the fitted parameters are summarized in
Table 2. The theoretical
qe values estimated from the PFO model are not in accordance with the experimental ones, and the chi-square (
χ2) value are found to be relatively high, indicating that the PFO model is not applicable to the Cu(
II) adsorption on the pristine CCS and PEI-grafted. On the other hand, the theoretical
qe values calculated from the PSO model are found to be very close to the experimental values of equilibrium adsorption capacity with a smaller
χ2 value and correlation coefficient (
R2) higher than 0.995. The good fitting of PSO kinetic model implies that the adsorption process may be interaction controlled. The rate constant of the PSO model for the PEI-grafted microspheres is
circa 2.5 folds larger in magnitude than that of the pristine CCS microspheres (
Table 2). This result further confirms rapid adsorption of Cu(
II) on the PEI-grafted microspheres.
Table 2 Kinetic model parameters for the adsorption of Cu(II) ions on the CCS and CCS-g-PGMA2-c-PEI microspheres at 298.15 K
Samples |
Models |
Fitted parameters |
kf (min−1) |
ks (g mmol−1 min−1) |
qe (mmol g−1) |
χ2 (×10−3) |
R2 |
PFO refers to the pseudo-first-order kinetic model. PSO corresponds to the pseudo-second-order kinetic model. |
CCS |
PFOa |
0.029 |
— |
0.153 |
8.32 |
0.983 |
PSOb |
— |
0.243 |
0.168 |
0.39 |
0.998 |
CCS-g-PGMA2-c-PEI |
PFO |
0.16 |
— |
0.326 |
7.19 |
0.989 |
PSO |
— |
0.602 |
0.358 |
0.19 |
0.999 |
Generally, the adsorption of metal ions on a porous sorbent involves a multi-step process: (i) external mass transfer of sorbates across liquid film surrounding the adsorbent particles, (ii) interaction between sorbates and active sites distributed on the outer surface of adsorbent particles, (iii) migration of sorbates within the pores of adsorbents (intra-particle diffusion), and (iv) binding of adsorbate molecules onto active sites within adsorbent particles.65 Any of the above four steps processes may be the rate-controlling factor or any combination of the step. However, the PFO and PSO kinetic models are mainly based on the kinetic process of steps ii and iv, but cannot identify the effect of diffusion on adsorption. Thus, external mass transfer and intra-particle diffusion warrant further consideration for the entire adsorption process. Weber–Morris model has been widely used to check whether the intra-particle diffusion is the rate-controlling step,66 whilst Boyd model is utilized to determine the contribution of boundary layer or film diffusion.67 The Weber–Morris and Boyd equations are expressed as the following eqn (3) and (4), respectively:
where
kid is the intra-particle diffusion rate constant (mmol g
−1 min
−0.5),
Cid is the intercept which is proportional to the boundary layer thickness (mmol g
−1),
F is the fractional attainment of equilibrium (
F =
qt/
qe), and
kf is the film diffusion rate constant (min
−1).
The respective fitted plots of Weber–Morris and Boyd models for the CCS-g-PGMA2-c-PEI microspheres are shown in Fig. 7. The corresponding intra-particle diffusion and external film diffusion plots for the pristine CCS microspheres are given in ESI Fig. S4.† The fitted diffusion parameters are summarized in Table 3. As shown in Fig. 7a and S4a,† the plots qt versus t0.5 for the pristine CCS and CCS-g-PGMA2-c-PEI microspheres do not pass through the origin, suggesting that the intra-particle diffusion is not the only rate-controlling step. The positive values of intercept Cid is indicative of some degree of boundary layer diffusion control (Table 3). The multilinear shape on the Weber–Morris plots is consistent with the fact that more than one process affects Cu(II) adsorption on the microspheres (Fig. 7a and S4a†). The first sharper linear portion can be considered as an external surface adsorption or faster adsorption stage, whilst the final linear portion is due to the intra-particle diffusion effect. Furthermore, the correlation coefficient are not satisfactory for the Boyd kinetic fitting of Cu(II) ions adsorbed on the CCS microspheres (Table 3), indicating that the external film (or boundary layer) diffusion is not the sole rate-controlling step. Overall, mass transfer of the Cu(II) adsorption process is associated with the combination steps of intra-particle diffusion and external film diffusion. On the other hand, both the kid and kf values for the PEI-grafted microspheres are much larger than those for the pristine CCS microspheres, indicative of a rapid mass transfer for the CCS-g-PGMA2-c-PEI microspheres. These results are well consistent with the fast adsorption rate for the PEI-grafted CCS microspheres.
 |
| Fig. 7 The diffusion-based model-fitted adsorption kinetics of Cu(II) ions on the CCS-g-PGMA2-c-PEI microspheres at the initial pH value of 5.0 (final pH in a range of 5.3–5.5): (a) Weber–Morris and (b) Boyd. Experimental conditions: C0 = 0.2 mmol L−1 (i.e. 13 mg L−1), v = 200 mL, T = 298.15 K, and m = 100 mg. | |
Table 3 Diffusion-based kinetic model parameters for the adsorption of Cu(II) ions on the CCS and CCS-g-PGMA2-c-PEI microspheres at 298.15 K
Samples |
Models |
Fitted parameters |
|
kid (mmol g−1 min−0.5) |
kf (min−1) |
Cid (mmol g−1) |
Intercept |
R2 |
CCS |
Weber–Morris |
1 |
0.0157 |
— |
−0.0019 |
— |
0.974 |
2 |
0.0021 |
— |
0.115 |
— |
0.891 |
Boyd |
|
— |
0.0052 |
— |
0.722 |
0.838 |
CCS-g-PGMA2-c-PEI |
Weber–Morris |
1 |
0.0686 |
— |
0.0048 |
— |
0.954 |
2 |
0.0055 |
— |
0.281 |
— |
0.953 |
Boyd |
|
— |
0.0228 |
— |
0.716 |
0.764 |
3.2.3 Adsorption isotherms. The adsorption isotherms are fundamental to describe the interactive behaviour between the sorbates and adsorbents, and to determine the maximum adsorption capacity for evaluating the adsorption efficiency of adsorbents. Fig. 8 presents the plots of equilibrium adsorption amount (qe, mmol g−1) versus equilibrium Cu(II) concentration in solution (Ce, mmol L−1) for the PEI-grafted microspheres at different temperatures. Evidently, it is favorable for Cu(II) adsorption upon increasing Cu(II) concentration and adsorption temperature on the PEI-grafted microspheres. The adsorption capacities of Cu(II) ions on the CCS-g-PGMA2-c-PEI microspheres increase rapidly with the increase in equilibrium concentration of Cu(II) ions, and a high adsorption amount can be achieved at a relatively low concentration. The maximum adsorption amount of Cu(II) ion reaches as high as circa 2.75 mmol g−1 (i.e. 176 mg g−1) at a initial Cu(II) concentration of 2.2 mmol L−1 (i.e., 140 ppm) at 328.15 K. The notable increase in the adsorption capacity of Cu(II) with increasing temperature suggests that the adsorption of Cu(II) ions on the PEI-grafted CCS microspheres is endothermic process.
 |
| Fig. 8 Langmuir-fitted adsorption isotherms of Cu(II) ions on the CCS-g-PGMA2-c-PEI microspheres at different adsorption temperatures of 298.15, 308.15, 318.15 and 328.15 K. Experimental conditions: C0 = 0.1–2.2 mmol L−1 (i.e. 6.5–140 mg L−1), v = 200 mL, m = 100 mg, adsorption time = 2 h, and pH = 5.0. | |
The adsorption isotherms are fitted with different isotherm models to obtain maximum adsorption capacity in a more quantitative manner. The important adsorption isotherm models including Langmuir, Freundlich and Temkin are chosen to analyze the adsorption of Cu(II) ions on the CCS-g-PGMA2-c-PEI microspheres. The Langmuir, Freundlich, and Temkin isotherm models are expressed as the following eqn (5) to (7), respectively:68
|
 | (5) |
|
 | (7) |
where
qmax is the maximum adsorption capacity (mmol g
−1),
KL represents the adsorption equilibrium constant of Langmuir isotherm model (mmol L
−1),
Ce is the equilibrium concentration of Cu(
II) ions in the solution (mmol L
−1),
qe corresponds to the equilibrium adsorption amount (mmol g
−1),
n is the Freundlich constant depicting the adsorption intensity,
KF is an empirical constant of Freundlich isotherm models, which represent adsorption capacity (mmol
(1−1/n) L
1/n g
−1),
AT is the equilibrium binding constant corresponding to the maximum binding energy (L g
−1),
BT is the Temkin constant related to the heat of sorption (kJ mol
−1),
R is the gas constant (8.314 × 10
−3 kJ mol
−1 K
−1), and
T is the absolute temperature (K).
Nonlinear fitting are performed for the above three isotherm models to depict the equilibrium adsorption process of Cu(II) ions on the PEI-grafted microspheres, and the corresponding regression parameters are summarized in Table 4. The fitted lines derived from the Langmuir, Freundlich and Temkin isotherms are illustrated in Fig. 8, S5 and S6 (ESI†). As shown in Table 4, the Langmuir isotherm model represents a better modelling of experimental data than Freundlich and Temkin models in all cases of Cu(II) adsorption, since the chi-square χ2 values of Langmuir fitting are much lower than those of Freundlich and Temkin models, and the correlation coefficients R2 values of Langmuir fitting are always larger than 0.995. Based on the fact that Langmuir isotherm model assumes monolayer coverage of adsorbate over a homogeneous adsorbent surface, and the adsorption of each molecule onto the surface has equal adsorption energy, the PEI-grafted microspheres may possess homogeneous adsorptive sites to chemically adsorb Cu(II) ions. The maximum adsorption amount of Cu(II) ions on the CCS-g-PGMA2-c-PEI microspheres at 298.15, 308.15, 318.15 and 328.15 K reaches up to 2.75, 2.92, 3.16 and 3.58 mmol g−1 (i.e., 175, 186, 202, and 229 mg g−1). In many previous studies, a good many PEI-modified adsorbents have been used to uptake Cu(II) ion from aqueous solution, and some recently-developed PEI-modified adsorbents with a relatively higher adsorption capacity for Cu(II) ions are listed in Table SI (ESI),† such as PEI-modified polypropylene (PP) fibre at 1.88 mmol g−1 (i.e., 120 mg g−1),69 PEI-modified magnetic porous powder at 2.47 mmol g−1 (i.e., 158 mg g−1),70 PEI-modified magnetic graphene oxides at 2.46 mmol g−1 (i.e., 157 mg g−1),71 PEI-functionalized magnetic Fe3O4 nanoparticles at 2.5 mmol g−1 (i.e., 160 mg g−1),72 PEI-modified biomass at 1.44 mmol g−1 (i.e., 92 mg g−1),43 PEI-immobilized PMMA microspheres at 0.22 mmol g−1 (i.e., 14 mg g−1),73 PEI-grafted MCR resins at 2.6 mmol g−1 (i.e., 166 mg g−1),59 PEI-grafted aerobic granular sludge at 1.11 mmol g−1 (i.e., 71 mg g−1)74 and so on. In comparison with these above PEI-modified sorbents, the CCS-g-PGMA2-c-PEI microspheres have competitive advantages of higher adsorption capacity and faster adsorption rate for effective removal of Cu(II) ions from aqueous solution.
Table 4 The regression parameters obtained using Langmuir, Freundlich and Temkin isotherms for the adsorption data of Cu(II) ions on the CCS-g-PGMA2-c-PEI microspheres at different temperatures
Models |
Fitted parameters |
Temperature (K) |
298.15 |
308.15 |
318.15 |
328.15 |
Langmuir |
qmax (mmol g−1) |
2.747 |
2.920 |
3.156 |
3.575 |
KL (L mmol−1) |
2.121 |
2.703 |
3.354 |
3.876 |
χ2 (×10−3) |
1.43 |
1.75 |
1.12 |
2.01 |
R2 |
0.998 |
0.998 |
0.999 |
0.997 |
Freundlich |
n |
1.904 |
1.971 |
2.137 |
2.132 |
KF (mmol1−1/n L1/n g−1) |
1.887 |
2.204 |
2.578 |
3.041 |
χ2 (×10−3) |
13.36 |
15.59 |
27.04 |
23.73 |
R2 |
0.979 |
0.976 |
0.968 |
0.974 |
Temkin |
AT (L mg−1) |
46.744 |
56.863 |
65.633 |
76.913 |
BT (kJ mol−1) |
0.458 |
0.502 |
0.569 |
0.628 |
bT |
5.412 |
5.104 |
4.649 |
4.344 |
χ2 (×10−3) |
29.61 |
38.44 |
34.54 |
47.69 |
R2 |
0.949 |
0.948 |
0.964 |
0.960 |
Additionally, an dimensionless equilibrium parameter, i.e. separation factor (RL) derived from the fitting of Langmuir isotherms is expressed as the following equation:75
|
 | (8) |
where
C0 is the initial concentration of Cu(
II) ions (mmol L
−1), and
KL is adsorption equilibrium constant of Langmuir isotherm model (mmol L
−1). The
RL parameter is considered as more reliable indicator of the adsorption. There are four probabilities for the
RL value: for favourable adsorption, 0 <
RL < 1, for unfavourable adsorption,
RL > 1, for linear adsorption,
RL = 1, for irreversible adsorption,
RL = 0.
Fig. 9 shows the variation of
RL as function of initial concentration of Cu(
II) ions at different temperatures of 298.15, 308.15, 318.15 and 328.15 K. It is readily to conclude that the adsorption of removal Cu(
II) ions from aqueous solution is favourable, as the
RL values are in the range of 0–1 in all the cases. Furthermore, with increasing
C0 and adsorption temperature, the
RL value gradually approaches zero, indicating that the adsorption of Cu(
II) ions onto CCS-
g-PGMA2-
c-PEI microspheres is less favourable at high initial concentration of Cu(
II) ions and high adsorption temperature.
 |
| Fig. 9 The change in separation factor (RL) as a function of the initial concentration of Cu(II) ions on the CCS-g-PGMA2-c-PEI microspheres at different adsorption temperatures of 298.15, 308.15, 318.15 and 328.15 K. | |
3.2.4 Adsorption thermodynamics. Adsorption thermodynamic parameters such as adsorption enthalpy (ΔH, kJ mol−1), Gibbs free energy (ΔG, kJ mol−1) and adsorption entropy (ΔS, kJ mol−1) offer percipient information about inherent energy changes in the adsorption process. Among them, ΔG is used as a fundamental criterion for evaluating spontaneity of an adsorption process, ΔH represents an endothermic or exothermic feature of an adsorption process, whilst ΔS is used to depict the degree of chaos in a given system. Based on Van't Hoff equation expressed as eqn (9), the Langmuir-fitted equilibrium constant can be used to calculate the thermodynamics parameters, if the enthalpy change ΔH0 remains constant over the studied temperature range: |
 | (9) |
Fig. S7 (ESI)† shows a linear plot regressed to obtain the relationship between ln
KL and 1/T, and the slope and intercept of the linearly-fitted plot correspond to the values of ΔH0 and ΔS0, respectively. The ΔG0 values can be directly calculated from the following eqn (10):
The calculated thermodynamic parameters in a temperature range of 298.15–328.15 K are listed in Table 5. The calculated values of ΔH0 and ΔS0 of the Cu(II) adsorption are approximately 16.19 and 60.67 J mol−1 K−1, respectively. The positive value of ΔH0 indicates that the adsorption process of Cu(II) ions is endothermic in nature. The positive ΔS0 value reflects the increase in randomness at the solid–liquid interface during the Cu(II) adsorption process. The negative ΔG values indicate a thermodynamically feasible and spontaneous nature of the Cu(II) adsorption on the PEI-grafted CCS microspheres. The decrease in the ΔG values with increasing temperature suggests a more feasible adsorption process of Cu(II) ions on the CCS-g-PGMA2-c-PEI microspheres at higher temperatures.
Table 5 Thermodynamic parameters according to the Van't Hoff equation for the adsorption of Cu(II) ions on the CCS-g-PGMA2-c-PEI microspheres
Temperature (K) |
ΔH0 (kJ mol−1) |
ΔS0 (J mol−1 K−1) |
ΔG0 (kJ mol−1) |
R2 |
298.15 |
16.19 |
60.67 |
−1.90 |
0.983 |
308.15 |
−2.51 |
318.15 |
−3.11 |
328.15 |
−3.72 |
3.2.5 Regeneration and recycle of the PEI-grafted microspheres. The regeneration and recycling of adsorbents is indispensable in evaluating the adsorption efficiency for practical application. Based on the fact that abundant amine (–NH2), imine (–NH–) and tertiary amino groups (–N
) on the PEI-conjugated PGMA chains act as adsorptive sites for Cu(II) ions, the Cu(II) adsorption on the CCS-g-PGMA2-c-PEI surfaces via chelation and electrostatic interactions may be a reversible process, it is possible that the Cu(II)-loaded microspheres can be recovered by a strong chelating agent. Thereby, a 1 mol L−1 EDTA solution was used to regenerate the Cu(II)-loaded CCS-g-PGMA2-c-PEI microspheres. Fig. 10a presents the adsorption and desorption profiles of Cu(II) ions for the CCS-g-PGMA2-c-PEI microspheres over five-cycle repeated usages. The desorption efficiency of Cu(II) ions on the PEI-grafted microspheres reaches as high as circa 97% for the first cycle. Even though the recovery ratio slightly decreases with increasing recycles, it still remains fairly high at circa 88% after five cycles, demonstrating that the adsorbed Cu(II) ions on the microspheres could be effectively extracted by EDTA chelating agent. The slight reduction in the recovery ratio of Cu(II) after cycle use may be caused by the formation of robust chemical bonds between Cu(II) and the polyfunctional PEI-conjugated PGMA chains, which is difficult to be completely extracted from the adsorptive sites in the regeneration process.
 |
| Fig. 10 (a) Adsorption and desorption behaviours of Cu(II) ions on the CCS-g-PGMA2-c-PEI microspheres upon five recycle use and (b) competitive adsorption among Pb(II), Cu(II), Mg(II) and Ca(II) ions on the CCS-g-PGMA2-c-PEI microspheres. Adsorption experimental conditions: C0 = 0.2 mmol L−1 (i.e. 13 mg L−1 for Cu(II) ions), v = 200 mL, T = 298.15 K, m = 100 mg, t = 2 h, and pH = 5.0. Desorption experimental conditions: m = 100 mg, T = 298.15 K, v = 50 mL, CEDTA = 1 mol L−1, and t = 1 h. | |
3.2.6 Competitive adsorption. Adsorption in a multi-component system involves complex solute–surface interactions, hence, the co-existence of several metal cations inevitably result in the competition in occupying the adsorptive sites on the adsorbents. A quaternary cation system of Pb(II), Cu(II), Ca(II) and Mg(II) ions was chosen to conduct completion adsorption, and their adsorption capacity profiles are illustrated in Fig. 10b. The adsorption capacity of the Cu(II) ions on the PEI-grafted microspheres is circa 0.31 mmol g−1 with respect to that at 0.32 mmol g−1, demonstrating that the adsorption of Cu(II) ions is hardly affected by the presence of other heavy metal ions. This result is well consistent with many previous studies.70,76 The preferential adsorption order on the CCS-g-PGMA2-c-PEI microspheres is Pb(II) > Cu(II) > Ca(II) > Mg(II), which might be relevant to the nature of metal ions and the interactions between adsorbent and adsorbates. The sorption affinity order is found to be consistent with the Pauling's electronegrativity order, which are Pb (2.3), Cu (1.9), Ca (1.3) and Mg (1.3), whilst to be in reverse order of hydrate radius Pb (4.01 Å), Cu (4.19 Å), Ca (9.6 Å) and Mg (10.8 Å). These above results suggest that higher electronegativity and smaller hydrated radius are favourable for the adsorption of heavy metal ions via surface complexation or adsorption reactions.
3.3 Adsorption mechanism
Taking account of the molecular structure of PEI-conjugated PGMA chains, the adsorptive sites of the CCS-g-PGMA-c-PEI microspheres are amino groups of PEI and hydroxyl groups of PGMA. The branched PEI containing abundant amine (–NH2), imine (–NH–) and tertiary amino groups (–N
), on which the lone pair electrons can be donated to the empty atomic orbital of Cu(II) to form amino group–metal complexes. The hydroxyl groups (–OH) derived from the ring-opening reactions of epoxy groups on the PGMA brushes may contribute to the chelation reaction of Cu(II). Fig. 11 schematically illustrates the interaction between Cu(II) ions and adsorptive sites of the PEI-grafted CCS microspheres via surface chelation or complexation. It is predictable that Cu(II) ions have a good opportunity to be surrounded by several amino groups within a polymer chain or by multiple amino groups between two adjacent polymer chains due to the high density of the grafting polymer chains on the CCS microsphere surfaces. As shown in Fig. 11, four types of branched PEI–Cu(II) coordinates, i.e., monodentate, bidentate, tridentate and tetradentate complexes, are possibly formed during the Cu(II) adsorption process. It has been reported in literature that the most stable PEI–Cu(II) complexes is formed with four coordination number.61 Especially, branched-chain amino groups of the branched PEI are able to coordinate more readily to a metal ion without moving the large main chain.61 Therefore, the branched PEI-grafted microspheres forming chelating complexes with Cu(II) ions is proposed to account for the efficient recovery of Cu(II) ions from aqueous solution.
 |
| Fig. 11 The postulated adsorption mechanisms of Cu(II) ions on the PEI-grafted CCS microspheres via surface chelation and complexation. | |
XPS has been extensively used to identify the interaction of an adsorbate with polyfunctional groups on an adsorbent, since the distribution of electrons around the corresponding atoms is changed by the formation of a chemical bond.59 Fig. 12 shows the XPS spectra of the CCS-g-PGMA2-c-PEI microspheres after loading of Cu(II). In comparison with wide scan spectrum before the Cu(II) adsorption (Fig. 4g), the appearance of an additional signal with BE at circa 932 eV, attributable to Cu 2p species (Fig. 12a), indicative of the successful adsorption of Cu(II) on the microsphere surface. The high resolution Cu 2p core-level spectrum is composed of Cu 2p3/2 (BE at 932 eV) and Cu 2p1/2 (BE at 952 eV) spin orbit split doublet (Fig. 12c). The curve-fitted N 1s core-level spectrum of the PEI-grafted microspheres after the Cu(II) adsorption consists of four peak components with BEs at 298.6, 399.8, 401 and 402.5 eV, attributable to amine (–NH2/–NH), imine (–N
), positively-charged nitrogen groups –NH3+ and –NH+, respectively (Fig. 12b). Approximately 16% amino groups have been protonated during the adsorption process. The adsorption of cationic Cu(II) ions on the PEI–PGMA chains at pH 5 not only result in the appearance of two additional peaks at higher BEs at 401 and 402.5 eV, but also cause a significant increase in the [–N
]/[–NH–] area ratio (Fig. 12b), indicating the formation of a shared bond between Cu(II) and the nitrogen atoms.59 Since some amino groups on the branched PEI have been protonated at pH 5 to be positively charged, they cannot adsorb Cu(II) ions via chelation. The O 1s core-level spectrum of the Cu(II)-load CCS-g-PGMA2-c-PEI microspheres is curve-fitted into three peak components with BEs at 530.4, 532.2 and 534.1 eV, attributable to the C
O, Pb–O and –OH species, respectively, demonstrating that the hydroxyl groups on the PGMA chains also act as adsorptive sites for the Cu(II) adsorption (Fig. 12d). These above results are in good agreement with the fact that the adsorption of Cu(II) ions on the PEI-grafted CCS microspheres is mainly caused by surface chelation or complexation.
 |
| Fig. 12 The (a) wide scan, (b) N 1s, (c) Cu 2p, and (d) O 1s core-level XPS spectra of the Cu-loaded CCS-g-PGMA2-c-PEI microspheres after 2 h of adsorption. Experimental conditions: C0 = 0.2 mmol L−1 (i.e. 13 mg L−1), v = 200 mL, T = 298.15 K, m = 100 mg, and pH = 5.0. | |
Conclusions
Crosslinked chitosan (CCS) microspheres tethered with branched PEI-conjugated PGMA brushes were synthesized by combination of surface-initiated ATRP and ring-opening reaction as a novel cationic adsorbent for highly efficient uptake of Cu(II) ions from aqueous solution. The abundant amino groups on the microsphere surfaces provided more adsorption sites to significantly enhance their adsorption of Cu(II) ions. Kinetic studies revealed a rapid adsorption rate of Cu(II) ions on the PEI-grafted microspheres to be well consistent with the pseudo-second-order model, together with combination effects of intraparticle and external film diffusion. The thermodynamic studies demonstrated an endothermic and spontaneous adsorption process of Cu(II) ions on the PEI-grafted CCS microspheres. XPS spectra proved that chelation and complexation interaction took place between the amino groups (or hydroxyl groups) and cationic Cu(II) ions. With the inherent mechanical strength and good stability of CCS microsphere, high adsorption capacity and good regenerability of branched PEI and versatility of surface-initiated ATRP, the PEI-grafted CCS microspheres offer a promising highly-efficient natural adsorbent to purify wastewater containing heavy metal ions.
Acknowledgements
The authors would like to acknowledge the financial assistance of National Natural Science Foundation of China (No. 21236004 and 21276163).
Notes and references
- F. Fu and Q. Wang, J. Environ. Manage., 2011, 92, 407–418 CrossRef CAS PubMed.
- A. Demirbas, J. Hazard. Mater., 2008, 157, 220–229 CrossRef CAS PubMed.
- Z. Hubicki and D. Koodynsk, Ion exchange technologies, In Tech., 2012 Search PubMed.
- M. M. Matlock, B. S. Howerton and D. A. Atwood, Water Res., 2002, 36, 4757–4764 CrossRef CAS PubMed.
- M. Al-Shannag, Z. Al-Qodah, K. Bani-Melhem, M. R. Qtaishat and M. Alkasrawi, Chem. Eng. J., 2015, 260, 749–756 CrossRef CAS.
- C. W. Wong, J. P. Barford, G. Chen and G. McKay, J. Environ. Chem. Eng., 2014, 2, 698–707 CrossRef CAS.
- N. Ghaemi, S. S. Madaeni, P. Daraei, H. Rajabi, S. Zinadini, A. Alizadeh, R. Heydari, M. Beygzadeh and S. Ghouzivand, Chem. Eng. J., 2015, 263, 101–112 CrossRef CAS.
- K. Wieszczycka, M. Kaczerewska, M. Krupa, A. Parus and A. Olszanowski, Sep. Purif. Technol., 2012, 95, 157–164 CrossRef CAS.
- F. R. Pombo and A. J. B. Dutra, Environ. Prog. Sustainable Energy, 2013, 32, 52–59 CrossRef CAS.
- A. Sari, M. Tuzen, D. Citak and M. Soylak, J. Hazard. Mater., 2007, 148, 387–394 CrossRef CAS PubMed.
- Y. Chen, B. Pan, S. Zhang, H. Li, L. Lv and W. Zhang, J. Hazard. Mater., 2011, 190, 1037–1044 CrossRef CAS PubMed.
- J. Chen, A. Ahmad and B. Ooi, J. Environ. Chem. Eng., 2013, 1, 339–348 CrossRef CAS.
- E. Igberase, P. Osifo and A. Ofomaja, J. Environ. Chem. Eng., 2014, 2, 362–369 CrossRef CAS.
- M. M. Rao, D. K. Ramana, K. Seshaiah, M. C. Wang and S. W. Chien, J. Hazard. Mater., 2009, 166, 1006–1013 CrossRef CAS PubMed.
- A. Baraka, P. Hall and M. Heslop, J. Hazard. Mater., 2007, 140, 86–94 CrossRef CAS PubMed.
- M. Bilal, J. A. Shah, T. Ashfaq, S. M. H. Gardazi, A. A. Tahir, A. Pervez, H. Haroon and Q. Mahmood, J. Hazard. Mater., 2013, 263, 322–333 CrossRef CAS PubMed.
- F. Pereira, K. Sousa, G. Cavalcanti, M. Fonseca, A. G. de Souza and A. Alves, Int. J. Biol. Macromol., 2013, 61, 471–478 CrossRef CAS PubMed.
- M. Hossain, H. Ngo, W. Guo and T. Nguyen, Bioresour. Technol., 2012, 113, 97–101 CrossRef CAS PubMed.
- A. Singha and A. Guleria, Int. J. Biol. Macromol., 2014, 67, 409–417 CrossRef CAS PubMed.
- M. A. Acheampong, K. Pakshirajan, A. P. Annachhatre and P. N. Lens, J. Ind. Eng. Chem., 2013, 19, 841–848 CrossRef CAS.
- D. Liu, Y. Zhu, Z. Li, D. Tian, L. Chen and P. Chen, Carbohydr. Polym., 2013, 98, 483–489 CrossRef CAS PubMed.
- S. Saber-Samandari, S. Saber-Samandari and M. Gazi, React. Funct. Polym., 2013, 73, 1523–1530 CrossRef CAS.
- F. B. Liang, Y. L. Song, C. P. Huang, Y. X. Li and B. H. Chen, Ind. Eng. Chem. Res., 2013, 52, 1267–1274 CrossRef CAS.
- L. Q. Huang, S. J. Yuan, L. Lv, G. Q. Tan, B. Liang and S. O. Pehkonen, J. Colloid Interface Sci., 2013, 405, 171–182 CrossRef CAS PubMed.
- J. Wang and C. Chen, Biotechnol. Adv., 2009, 27, 195–226 CrossRef CAS PubMed.
- G. Crini, Bioresour. Technol., 2006, 97, 1061–1085 CrossRef CAS PubMed.
- S. Sun and A. Wang, Sep. Purif. Technol., 2006, 51, 409–415 CrossRef CAS.
- C. Liu and R. Bai, Curr. Opin. Chem. Eng., 2014, 4, 62–70 CrossRef.
- S. Yong, N. Bolan, E. Lombi, W. Skinner and E. Guibal, Crit. Rev. Environ. Sci. Technol., 2013, 43, 1741–1794 CrossRef.
- I. Sargin and G. Arslan, Desalin. Water Treat., 2016, 57, 10664–10676 CrossRef CAS.
- K. J. Hsien, C. M. Futalan, W. C. Tsai, C. C. Kan, C. S. Kung, Y. H. Shen and M. W. Wan, Desalin. Water Treat., 2013, 51, 5574–5582 CrossRef CAS.
- R. Karthik and S. Meenakshi, Chem. Eng. J., 2015, 263, 168–177 CrossRef CAS.
- F. L. Mi, S. J. Wu and Y. C. Chen, Carbohydr. Polym., 2015, 131, 255–263 CrossRef CAS PubMed.
- G. Z. Kyzas, P. I. Siafaka, D. A. Lambropoulou, N. K. Lazaridis and D. N. Bikiaris, Langmuir, 2014, 30, 120–131 CrossRef CAS PubMed.
- P. O. Boamah, Y. Huang, M. Hua, Q. Zhang, J. Wu, J. Onumah, L. K. Sam-Amoah and P. O. Boamah, Ecotoxicol. Environ. Saf., 2015, 116, 113–120 CrossRef CAS PubMed.
- J. Wang and Z. Li, J. Hazard. Mater., 2015, 300, 18–28 CrossRef CAS PubMed.
- S. Deng and Y. P. Ting, Environ. Sci. Technol., 2005, 39, 8490–8496 CrossRef CAS PubMed.
- Y. Ma, W. J. Liu, N. Zhang, Y. S. Li, H. Jiang and G. P. Sheng, Bioresour. Technol., 2014, 169, 403–408 CrossRef CAS PubMed.
- X. Sun, L. Yang, H. Xing, J. Zhao, X. Li, Y. Huang and H. Liu, Chem. Eng. J., 2013, 234, 338–345 CrossRef CAS.
- M. Ghoul, M. Bacquet and M. Morcellet, Water Res., 2003, 37, 729–734 CrossRef CAS PubMed.
- J. Wang, X. Lu, P. F. Ng, K. I. Lee, B. Fei, J. H. Xin and J. Y. Wu, J. Colloid Interface Sci., 2015, 440, 32–38 CrossRef CAS PubMed.
- B. Gao, F. An and K. Liu, Appl. Surf. Sci., 2006, 253, 1946–1952 CrossRef CAS.
- S. Deng and Y. P. Ting, Water Res., 2005, 39, 2167–2177 CrossRef CAS PubMed.
- C. Jeon and K. Ha Park, Water Res., 2005, 39, 3938–3944 CrossRef CAS PubMed.
- B. Liu, W. Chen, X. Peng, Q. Cao, Q. Wang, D. Wang, X. Meng and G. Yu, Int. J. Biol. Macromol., 2016, 86, 562–569 CrossRef CAS PubMed.
- A. J. M. Al-Karawi, Z. H. J. Al-Qaisi, H. I. Abdullah, A. M. A. Al-Mokaram and D. T. A. Al-Heetimi, Carbohydr. Polym., 2011, 83, 495–500 CrossRef CAS.
- D. J. Siegwart, J. K. Oh and K. Matyjaszewski, Prog. Polym. Sci., 2012, 37, 18–37 CrossRef CAS PubMed.
- J. S. Wang and K. Matyjaszewski, J. Am. Chem. Soc., 1995, 117, 5614–5615 CrossRef CAS.
- S. J. Yuan, J. T. Gu, Y. Zheng, W. Jiang, B. Liang and S. O. Pehkonen, J. Mater. Chem. A, 2015, 3, 4620–4636 CAS.
- Y. T. Wei, Y. M. Zheng and J. P. Chen, Langmuir, 2011, 27, 6018–6025 CrossRef CAS PubMed.
- N. Li, R. Bai and C. Liu, Langmuir, 2005, 21, 11780–11787 CrossRef CAS PubMed.
- J. T. Gu, S. J. Yuan, W. T. Shu, W. Jiang, S. W. Tang, B. Liang and S. O. Pehkonen, Colloids Surf., A, 2016, 498, 218–230 CrossRef CAS.
- S. J. Yuan and S. O. Pehkonen, Colloids Surf., B, 2007, 59, 87–99 CrossRef CAS PubMed.
- Y. Q. Zheng, S. Deng, L. Niu, F. J. Xu, M. Y. Chai and G. Yu, J. Hazard. Mater., 2011, 192, 1401–1408 CrossRef CAS PubMed.
- J. F. Moulder, J. Chastain and R. C. King, Handbook of X-ray photoelectron spectroscopy, Physical Electronics, Eden Prairie, MN, 1995 Search PubMed.
- Y. Zheng, P. Zhang, H. R. Yue, G. Xiang, Z. X. Qian, H. T. Li, W. Jiang, B. Liang, S. O. Pehkonen and S. J. Yuan, Colloids Surf., A, 2016, 502, 89–101 CrossRef CAS.
- F. J. Xu, Q. J. Cai, Y. L. Li, E. T. Kang and K. G. Neoh, Biomacromolecules, 2005, 6, 1012–1020 CrossRef CAS PubMed.
- M. Ejaz, K. Ohno, Y. Tsujii and T. Fukuda, Macromolecules, 2000, 33, 2870–2874 CrossRef CAS.
- L. Niu, S. Deng, G. Yu and J. Huang, Chem. Eng. J., 2010, 165, 751–757 CrossRef CAS.
- M. Revathi, C. Ahmed Basha and M. Velan, Desalin. Water Treat., 2015, 1–18 Search PubMed.
- S. Kobayashi, K. Hiroishi, M. Tokunoh and T. Saegusa, Macromolecules, 1987, 20, 1496–1500 CrossRef CAS.
- A. Ritchie, J. Chem. Soc., Faraday Trans., 1977, 73, 1650–1653 RSC.
- Y. Ho and G. McKay, Process Saf. Environ. Prot., 1998, 76, 332–340 CrossRef CAS.
- R. Laus, T. G. Costa, B. Szpoganicz and V. T. Favere, J. Hazard. Mater., 2010, 183, 233–241 CrossRef CAS PubMed.
- D. D. Maksin, S. O. Kljajević, M. B. Đolić, J. P. Marković, B. M. Ekmeščić, A. E. Onjia and A. B. Nastasović, Hem. Ind., 2012, 66, 795–804 CrossRef CAS.
- W. J. Weber and J. C. Morris, J. Sanit. Eng. Div., Am. Soc. Civ. Eng., 1963, 89, 31–60 Search PubMed.
- G. Boyd, A. Adamson and L. Myers Jr, J. Am. Chem. Soc., 1947, 69, 2836–2848 CrossRef CAS PubMed.
- O. Hamdaoui and E. Naffrechoux, J. Hazard. Mater., 2007, 147, 381–394 CrossRef CAS PubMed.
- T. Li, S. Chen, H. Li, Q. Li and L. Wu, Langmuir, 2011, 27, 6753–6758 CrossRef CAS PubMed.
- Y. Pang, G. Zeng, L. Tang, Y. Zhang, Y. Liu, X. Lei, Z. Li, J. Zhang and G. Xie, Desalination, 2011, 281, 278–284 CrossRef CAS.
- N. Sui, L. Wang, X. Wu, X. Li, J. Sui, H. Xiao, M. Liu, J. Wan and W. Y. William, RSC Adv., 2015, 5, 746–752 RSC.
- I. Y. Goon, C. Zhang, M. Lim, J. J. Gooding and R. Amal, Langmuir, 2010, 26, 12247–12252 CrossRef CAS PubMed.
- P. E. Duru, S. Bektas, S. Pat
r and A. Denizli, J. Appl. Polym. Sci., 2001, 81, 197–205 CrossRef CAS. - X. F. Sun, C. Liu, Y. Ma, S.-G. Wang, B. Y. Gao and X. M. Li, Colloids Surf., B, 2011, 82, 456–462 CrossRef CAS PubMed.
- H. Zheng, D. Liu, Y. Zheng, S. Liang and Z. Liu, J. Hazard. Mater., 2009, 167, 141–147 CrossRef CAS PubMed.
- D. Mohan and K. P. Singh, Water Res., 2002, 36, 2304–2318 CrossRef CAS PubMed.
Footnotes |
† Electronic supplementary information (ESI) available: The comparison adsorption of Cu(II) on different PEI-modified adsorbents (Table S1), the optical images of wet and dry CCS microspheres (Fig. S1), XPS spectra of the CCS and CCS-Br microspheres (Fig. S2), the GY and GD plots of the PGMA brushes as function of reaction time (Fig. S3), the diffusion-based model-fitted adsorption kinetics for the pristine CCS microspheres (Fig. S4), Freundlich-fitted (Fig. S5) and Temkin-fitted (Fig. S6) adsorption isotherms of Cu2+ ions on the PEI-grafted CCS microspheres, Van't Hoff plot for the adsorption of Cu2+ ions on the PEI-grafted CCS microspheres. See DOI: 10.1039/c6ra16226f |
‡ These two authors contributed equally. |
|
This journal is © The Royal Society of Chemistry 2016 |
Click here to see how this site uses Cookies. View our privacy policy here.