
Quantum mechanical based approaches for predicting pKa values of carboxylic acids: evaluating the performance of different strategies†
Aida Mariana Rebollar-Zepeda and
Annia Galano *
*
Departamento de Química, División de Ciencias Básicas e Ingeniería, Universidad Autónoma Metropolitana-Iztapalapa, Av San Rafael Atlixco No. 186, Col. Vicentina C.P. 09340, México D.F., Mexico. E-mail: agal@xanum.uam.mx
First published on 22nd November 2016
Abstract
The performance of different computational protocols for predicting pKa values of carboxylic acids, in aqueous solution, has been evaluated by comparison with experimental data. A set of 14 carboxylic acids was used to that purpose, including both aliphatic and aromatic species, as well as molecules of different chemical complexity. Two general strategies were explored, namely the reaction schemes design (RSD) and the fitting parameters (FP) methods. Within RSD, the reaction scheme chosen to represent the deprotonation process is the aspect influencing the most the agreement with the experiments. Other aspects, with modest but not negligible influence, are the way in which the solvation energies are calculated, and the used density functional theory (DFT) approach. The best results within the RSD strategy were found for the EN3 reaction scheme and the PBE0 functional, which led to mean unsigned errors (MUE) and root mean square errors (RMSE) equal to 0.87 and 1.02 pKa units, respectively. However, the FP method over-performs RSD, with MUE and RMSE values below 0.35 pKa units for most of the tested DFT approaches. Accordingly, the FP method is recommended for estimating pKa values of carboxylic acids for which this information is still unknown, especially in combination with the PBE and PBE0 functionals and the SMD solvent model.
Introduction
Acid dissociation constants (Ka) are important descriptors that quantify the tendency of chemical species to donate a proton. They are frequently expressed as pKa, which are defined as −log(Ka) and rule the proportion of protonated and deprotonated forms at a particular pH. Thus, accurate estimations of pKa values are of crucial importance for numerous areas of knowledge including chemistry, biology, food science, medicine, and pharmacology. Despite the fact that there are several experimental techniques that have been proven to be successful for that purpose, it sometimes becomes a difficult task. Some paradigmatic examples are very weak or very strong acids, as well as short-living intermediates.1 Accordingly, a huge amount of efforts have been devoted to improve the accuracy of pKa values obtained from theoretical approaches,1–21 albeit it still remains as a very challenging task. The difficulties, failures and successes of such strategies have been thoroughly reviewed by Ho and Coote,22 who concluded that we are still far from achieving ideal results. In fact, mean absolute deviations smaller than 2 pKa units are currently accepted as reasonably accurate.22Apparently, the largest contributions to the errors in pKa calculations are caused by two aspects involved in the computational protocols. The first one is that acid–base equilibria involve charged species that usually are at the product side (HA ⇌ H+ + A−). Since errors arising from calculations, especially in solution, are typically larger for ionic than for non-charged species, the most significant errors do not cancel out when energies of reactions are calculated. Consequently the accuracy of such relative energies is no as predictable as for processes where the charged species are present at both sides of the equilibrium. The second main source of errors is the way in which the solvent is modeled. The most frequently used strategy for mimicking solvation is using dielectric continuum models (DCM), which might not be good enough when short-range solute–solvent interactions are significant. In addition there is a wide variety of DCM that can be used for modeling solvation. Thus, the quality of the result may also depend on the DCM choice.
One way to deal with the first issue is by designing reaction schemes that maximize errors cancelation. For the second issue a viable solutions is to include some explicit solvent molecules in the vicinity of the solute, in conjunction with a DCM. The reaction schemes design (RSD) approach is flexible on how the deprotonation process is formulated and allows simultaneously using the hybrid solvent model. Thus, it seems to be an appealing option to produce accurate calculated pKa values. It has been previously demonstrated to be successful for predicting pKas of chemical compounds belonging to the amine and phenol families.23,24 Within this strategy, the most attractive schemes are the experiment-independent ones. In addition, it usually requires only a few explicit water molecules for the hybrid solvent model, which guarantees that it can be carried out at reasonable computational costs for relatively large-sized systems. A drawback of the RSD strategy is that the best reaction scheme may change from one family of chemical compound to another. Therefore it is a “divide and conquer” kind of strategy that needs to be tested separately for each chemical group. This is mainly due to the fact that for each of them the number and kind of charged species may be different, and not necessarily at the same side of the equilibrium. For example the best reaction scheme for the protonated amine family is different from the best reaction scheme for neutral phenols.23,24
Another strategy that circumvents the main error sources in pKa calculations is the fitting parameters (FP) method.25–35 It is based on using a standard linear regression fit for the calculated energy difference (between each acid and its conjugated base) and the corresponding experimental pKa values. The two fitted parameters obtained from this regression are, in turn, used to calculate the pKa of the molecules of interest. Within this strategy most of the errors in energy calculations are absorbed into the fitting parameters. In addition, it was demonstrated that in the particular case of the FP method, including explicit water molecules leads to larger errors than using only DCM.29 This method presents the same disadvantage that RSD, i.e., each family of compound needs to be treated separately which means that a separate fit is necessary in each case.
In the present work the RSD and FP strategies are tested when used in conjunction with two different DCM approaches for a set carboxylic acids. In addition, two different ways of obtaining solvation energies have been tested. The influence of the electronic structure method chosen for the calculations has also been investigated, within the density functional theory (DFT) framework, to assure that they are computationally feasible for relatively large molecules. The main purpose of this investigation is to identify the computational strategies most suitable for accurately predicting pKa values of carboxylic acids, at reasonable computational costs. By comparisons with the available experimental data, the strategies leading to deviations ≤1 pKa unit are identified and recommended for obtaining reliable pKa values from theoretical calculations.
Computational details
Full geometry optimizations and frequency calculations were performed for all the species involved in the studied acid–base equilibria without imposing any symmetry constrains. The electronic structure method tested in this work are the DFT approximations BLYP, B3LYP, BHandHLYP, PBE, PBE0, PW91, BMK, TPSS, and M05-2X. All of them were used in conjunction with the 6-311++G(d,p) basis set, and the local minima were identified by the absence of imaginary frequencies. All the electronic calculations were carried out with the packages of programs Gaussian 03 (ref. 36) and Gaussian 09.37Two RSD strategies were tested. They differ in the DCM of choice and in how the solvation energy is obtained. For RSD1 the stationary points were first modeled (geometry optimizations and frequency calculations) in gas phase, and solvent effects were included a posteriori by single point calculations using the polarizable continuum model, specifically the integral-equation-formalism (IEF-PCM).38–41 Relative Gibbs free energies in solution (ΔGs) are then computed using the Hess law and thermodynamic cycles, as the sum of the corresponding gas-phase free energy (ΔGs) and the free energy of solvation (ΔGsolv). More details on this procedure can be found elsewhere.23,24 For the RSD2 strategy, on the other hand, all the geometry optimizations and frequency calculations were performed in solution using the SMD continuum model,42 thus the ΔGs values, for each species, are directly obtained.
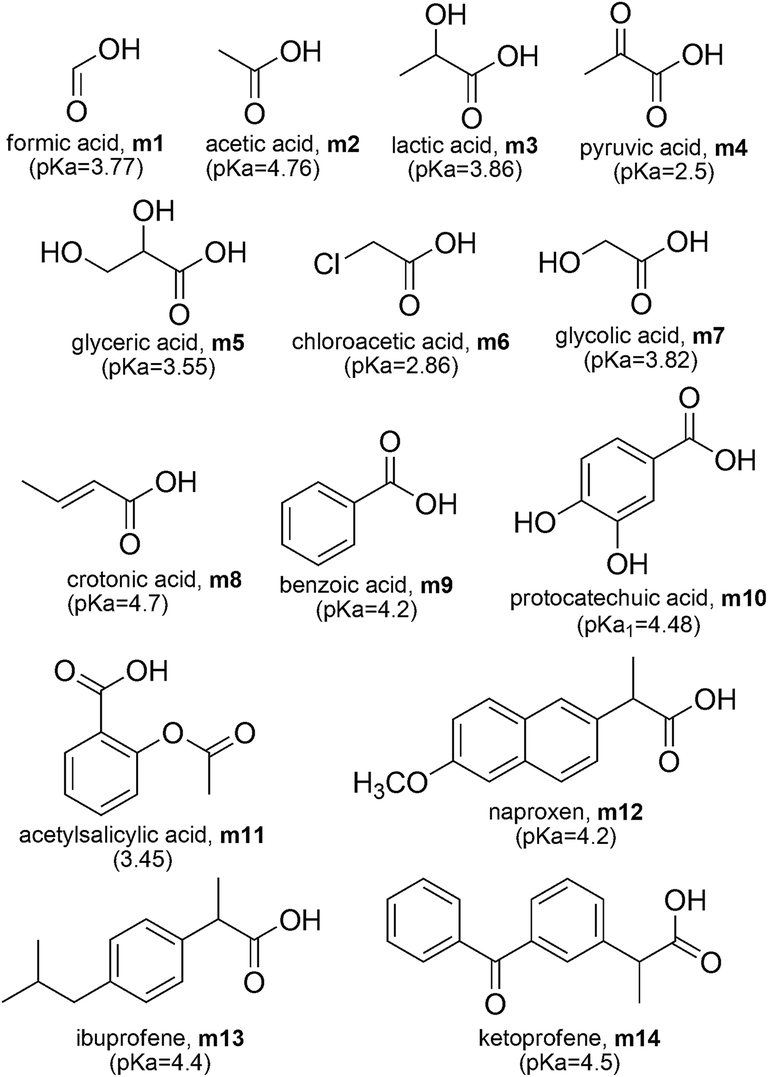
The set of carboxylic acids studied in this work are shown in Scheme 1, while the reaction schemes used in both RSD strategies are shown in Table 1. In the particular case of scheme A, it involves the proton and it is known that computational methods poorly reproduce the solvation energies of this particular species. Therefore the ΔGg(H+) and ΔGsolv(H+) values have been derived from experiments. In this work we have used ΔGg(H+) = −4.39 kcal mol−1, and ΔGsolv(H+) = −265.89 kcal mol−1, based on the recommendation of Camaioni and Schwerdtfeger,43 which in aqueous solution leads to ΔGs(H+) = −270.28 kcal mol−1. These values, as well as all the data reported here, correspond to 1 M standard state. Schemes A and D are the most widely used nowadays. The reaction scheme labeled here as D, is commonly referred to as the isodesmic method, the proton exchange method, or the relative method; while scheme A is usually referred to as the direct method. In scheme D, acetic acid was used as HRef for all the investigated molecules but itself (for which HRef = formic acid).
 | ||
| Scheme 1 Carboxylic acids studied in this work. | ||
| Label | Reaction scheme | pKa = |
|---|---|---|
| A | HA ⇌ H+ + A− |  |
| B | HA + H2O ⇌ H3O+ + A− |  |
| C1 | HA + 2H2O ⇌ H3O+ + A−(H2O) |  |
| C2 | HA + 3H2O ⇌ H3O+ + A−(2H2O) |  |
| C3 | HA + 4H2O ⇌ H3O+ + A−(3H2O) |  |
| D | HA + Ref− ⇌ A− + HRef |  |
| E1 | HA + OH−(3H2O) ⇌ A−(H2O) + 3H2O |  |
| E2 | HA + OH−(3H2O) ⇌ A−(2H2O) + 2H2O |  |
| E3 | HA + OH−(3H2O) ⇌ A−(3H2O) + H2O |  |
| F1 | HA + 4H2O ⇌ H3O+(3H2O) + A− |  |
| F2 | HA + 5H2O ⇌ H3O+(3H2O) + A−(H2O) |  |
| F3 | HA + 6H2O ⇌ H3O+(3H2O) + A−(2H2O) |  |
| F4 | HA + 7H2O ⇌ H3O+(3H2O) + A−(3H2O) |  |
| CN1 | HA(H2O) + H2O ⇌ H3O+ + A−(H2O) |  |
| CN2 | HA(H2O) + 2H2O ⇌ H3O+ + A−(2H2O) |  |
| CN3 | HA(H2O) + 3H2O ⇌ H3O+ + A−(3H2O) |  |
| FN1 | HA(H2O) + 4H2O ⇌ H3O+(3H2O) + A−(H2O) |  |
| FN2 | HA(H2O) + 5H2O ⇌ H3O+(3H2O) + A−(2H2O) |  |
| FN3 | HA(H2O) + 6H2O ⇌ H3O+(3H2O) + A−(3H2O) |  |
| EN1 | HA(H2O) + OH−(3H2O) ⇌ A−(H2O) + 4H2O |  |
| EN2 | HA(H2O) + OH−(3H2O) ⇌ A−(2H2O) + 3H2O |  |
| EN3 | HA(H2O) + OH−(3H2O) ⇌ A−(3H2O) + 2H2O |  |
For the reaction schemes including explicit water molecules they were located to maximize interactions with the solute (at the protonation/deprotonation site of interest) and to avoid interactions among them. Thus they were included as individual molecules. Albeit it has been previously proposed that using solvent clusters may lead to smooth convergence of the solvation free energy with respect to the cluster size,44 this aspect was not investigated in the present work due to the large amount of studied systems. For the same reason full conformational searches were impracticable. Thus, variations from the data reported here might be expected if different conformations are used.45 However, they should be small since the deprotonated species were constructed from the protonated ones, i.e. using similar conformations. On the other hand, using hydrogen-bonded clusters of similar size on the left- and right-hand sides of a reaction cycle may result in larger cancelation of systematic errors in the calculation of free energies.44 Therefore, this aspect probably deserves further investigation.
For the FP strategies the molecules m1 to m10 were used as the training set to obtain the empirical parameters m and C0, from a standard linear regression fit, according to:
| pKexpa = mΔGs(BA) + C0, | (1) |
| ΔGs(BA) = Gs(B) − Gs(A), | (2) |
It was calculated at 298.15 K and expressed in kcal mol−1. The two parameters (m and C0) were used to calculate the pKa values of the carboxylic acids m11 to m14 (test set) as:
| pKcalca = mΔGTestSets(BA) + C0 | (3) |
This strategy was carried out using SMD to mimic the solvent, without including any explicit water molecule.
The accuracy of both approaches, RSD and FP, was estimated by comparisons with the experimental pKa values of the studied carboxylic acids. The deviation from experiments was expressed as mean unsigned errors (MUE) and root mean square errors (RMSE). All output files and each calculated pKa value are published on Figshare (https://figshare.com/collections/Supplementary_Material_for_pKa_calculations_of_Carboxylic_Acids/3566835).
Results and discussion
The MUE obtained for the investigated set of carboxylic acids using the RSD1 and RSD2 approaches are all summarily shown in Fig. 1. In addition, the values of those combinations (reaction scheme/DFT approximation) with at least one MUE lower than 2 pKa units are reported in Table 2. All the rest were ruled out as reliable for calculating pKa values of carboxylic acids. Fig. 1 clearly shows that the reaction scheme used for representing the acid–base equilibria influences the agreement with the experiments to a larger extent than the DFT of choice, regardless of the way in which the solvation energies are calculated. However, the three calculation aspects explored here (reaction scheme, strategy for calculating the solvation energy and DFT approach) influence the quality of the pKa calculations for carboxylic acids. In general the schemes with all charged species at the same side of the equilibrium (for example all the C and F schemes) are those leading to the largest errors. This is probably because for them the cancelation of errors is smaller than that arising from schemes with species of identical charge at both sides of the equilibrium (schemes D and all the E ones, for example). | ||
| Fig. 1 Mean unsigned errors (MUE) obtained for pKa values calculated with the RSD strategy: (A) RSD1 and (B) RSD2. | ||
| B3LYP | BLYP | BH&HLYP | BMK | M05-2X | PBE | PBE0 | PW91 | TPSS | |
|---|---|---|---|---|---|---|---|---|---|
| RSD1 | |||||||||
| A | 1.32 | 2.40 | 2.44 | 1.24 | 1.03 | 1.83 | 1.64 | 2.14 | 1.26 |
| B | 3.25 | 4.37 | 3.67 | 3.08 | 4.67 | 1.45 | 2.87 | 1.78 | 1.85 |
| D | 1.65 | 1.48 | 1.53 | 1.28 | 1.36 | 1.41 | 1.40 | 1.64 | 1.58 |
| E1 | 2.81 | 2.84 | 3.71 | 4.45 | 4.60 | 1.95 | 2.81 | 2.63 | 2.46 |
| E2 | 1.61 | 2.44 | 2.26 | 2.43 | 1.39 | 2.81 | 1.62 | 3.04 | 2.07 |
| CN1 | 4.34 | 5.02 | 4.66 | 4.35 | 5.11 | 1.94 | 4.13 | 2.09 | 2.56 |
![[thin space (1/6-em)]](https://www.rsc.org/images/entities/char_2009.gif) |
|||||||||
| RSD2 | |||||||||
| A | 1.47 | 1.27 | 2.35 | 0.98 | 0.98 | 1.15 | 1.858 | 1.17 | 2.04 |
| D | 1.34 | 1.39 | 1.22 | 1.18 | 1.54 | 1.90 | 0.92 | 1.39 | 1.29 |
| E1 | 4.14 | 3.27 | 5.42 | 6.75 | 4.75 | 1.06 | 3.65 | 1.05 | 2.38 |
| E2 | 1.44 | 1.17 | 3.02 | 3.83 | 4.44 | 1.35 | 1.67 | 1.21 | 0.88 |
| E3 | 1.80 | 2.74 | 1.12 | 0.84 | 1.07 | 3.02 | 0.85 | 2.81 | 2.51 |
| EN1 | 5.96 | 5.37 | 7.24 | 8.87 | 5.93 | 1.71 | 4.88 | 1.08 | 3.78 |
| EN2 | 3.25 | 2.43 | 4.84 | 5.94 | 4.28 | 0.84 | 2.89 | 0.92 | 1.65 |
| EN3 | 0.93 | 0.99 | 2.53 | 2.58 | 2.75 | 2.05 | 0.87 | 2.22 | 1.06 |
When using the RSD1 approach, the reaction schemes that – in general – lead to the best agreement with the experimental data are A, D and E2, albeit none of the obtained MUE values are lower than 1 pKa unit. For reaction scheme A, six DFT approaches produce MUE < 2, with the lowest values corresponding to the functionals M05-2X (1.03), BMK (1.24) and TPSS (1.26). For reaction scheme E2 only three DFT approaches lead to MUE < 2, i.e., M05-2X (MUE = 1.39), B3LYP (MUE = 1.61) and PBE0 (MUE = 1.62). On the other hand, when using the reaction scheme D, all the obtained MUE values are below the 2 pKa units threshold. The best results in this case were obtained with BMK (1.28), PBE0 (1.40) and PBE (1.41).
The agreement with the experimental data improves for the RSD2 approach, compared to RSD1. This is reflected in both the MUE values and the number of combinations (reaction scheme/DFT approximation) with MUE < 2. Contrary to what was already discussed for RSD1, several MUE values lower than 1 pKa unit were obtained with the RSD2 approach. In this case the best agreement with the experimental data arises from using the reaction schemes A, D, E3 and EN3. Six DFT approaches lead to MUE < 2, when using scheme A, with the lowest values corresponding to BMK and M05-2X (0.98 in both cases), which are also the only two MUE values lower than 1 pKa unit for this scheme. For the reaction scheme E3, five of the tested DFT approaches led to MUE < 2, while only two produce MUE < 1. They are BMK (MUE = 0.84) and PBE0 (MUE = 0.85). For the reaction scheme EN3, MUE values lower than 2 and 1 pKa units were found for 4 and 3 DFT approaches, respectively. The best agreement with the experimental data was obtained for PBE0 (MUE = 0.87) and B3LYP (MUE = 0.93). Similarly to what was found for the RSD1 approach, when using the RSD2 approach all the MUE values obtained with the reaction scheme D are below the 2 pKa units threshold. However, the MUE obtained with RSD2 and PBE0 is lower than 1 pKa unit (0.92).
In addition, since large particular errors in pKa estimations are highly undesirable, the root mean square errors (RMSEs) were also estimated to give more weight to large deviations from the experimental data (Table 3). Only the best performing schemes (RSD1 with A, D and E2 schemes; and RSD2 with A, D, E3 and EN3) were included in this analysis, since the others are already ruled out as reliable for calculating pKa of carboxylic acids based on MUE values. The trends logically remains the same than those corresponding to MUE, but the number of reaction scheme/DFT approximation with values lower than 2 pKa units decreases. Based on RMSE, for RSD1 they are A (M05-2X, TPSS, BMK, B3LYP), E2 (M05-2X), and D (BMK, BHandHLYP), with the latter showing the largest reduction on successful approaches. For RSD2, albeit all the RMSE values are higher than 1 pKa unit, there are several combinations with RMSE < 1.3. They are A (BMK), D (PBE0), E3 (TPSS) and EN3 (PBE0, B3LYP, TPSS and BLYP). In addition the asymmetric 95% confidence limits46 were estimated (Tables S1 and S2, ESI†). It was found that the lower limit differ from the best guess by more than the upper limit for all the tested reaction scheme/DFT approximation pairs.
| B3LYP | BLYP | BH&HLYP | BMK | M05-2X | PBE | PBE0 | PW91 | TPSS | |
|---|---|---|---|---|---|---|---|---|---|
| RSD1 | |||||||||
| A | 1.79 | 2.70 | 3.03 | 1.73 | 1.54 | 2.15 | 2.17 | 2.57 | 1.68 |
| D | 2.85 | 2.00 | 1.93 | 1.61 | 2.69 | 2.47 | 2.01 | 2.67 | 2.68 |
| E2 | 2.32 | 3.27 | 2.50 | 2.64 | 1.83 | 3.49 | 2.24 | 3.68 | 2.92 |
|
|||||||||
| RSD2 | |||||||||
| A | 1.70 | 1.49 | 2.69 | 1.20 | 1.31 | 1.37 | 2.05 | 1.39 | 2.25 |
| D | 1.79 | 1.77 | 1.59 | 1.52 | 1.86 | 2.10 | 1.20 | 1.82 | 1.69 |
| E3 | 3.30 | 3.03 | 1.35 | 1.03 | 1.32 | 3.13 | 1.16 | 2.95 | 2.67 |
| EN3 | 1.12 | 1.27 | 2.67 | 2.69 | 4.18 | 2.17 | 1.06 | 2.35 | 1.24 |
The results obtained with the FP method are presented in Table 4. For all the tested DFT approaches the standard linear regression fit correlation coefficients (R2) were found to be around 0.8. The error bars for both the slope (m) and the intercept (C0) are provided in Table S3 (ESI†). The agreement of the calculated pKa values with the experimental data is very good, with MUE < 0.45, and RMSE < 0.47, in all the cases. Moreover, six DFT approaches produce MUE < 0.3 and RMSE < 0.35. They are PBE (MUE = 0.23, RMSE = 0.27), PBE0 (MUE = 0.26, RMSE = 0.29), BLYP (MUE = 0.26, RMSE = 0.30), PW91 (MUE = 0.28, RMSE = 0.32), TPSS (MUE = 0.29, RMSE = 0.31), and BMK (MUE = 0.29, RMSE = 0.34). It is also interesting to note that the values of the m parameter are very similar with all the tested DFT approaches, ranging from 0.223 to 0.273. On the contrary, there is a significant variation in the values of C0 (from −57.488 to −71.478).
| m | C0 | R2 | MUE | RMSE | |
|---|---|---|---|---|---|
| B3LYP | 0.231 | −59.8 | 0.840 | 0.32 | 0.40 |
| BLYP | 0.223 | −57.5 | 0.864 | 0.26 | 0.30 |
| BHandHLYP | 0.260 | −68.3 | 0.870 | 0.41 | 0.46 |
| BMK | 0.273 | −71.5 | 0.841 | 0.29 | 0.34 |
| M05-2X | 0.257 | −66.7 | 0.762 | 0.31 | 0.39 |
| PBE | 0.227 | −58.7 | 0.792 | 0.23 | 0.27 |
| PBE0 | 0.240 | −62.8 | 0.788 | 0.26 | 0.29 |
| PW91 | 0.223 | −57.5 | 0.768 | 0.28 | 0.32 |
| TPSS | 0.224 | −58.3 | 0.792 | 0.29 | 0.31 |
To better understand the dissimilar dependence of pKa values, calculated using the FP method, a more detailed analysis is provided next. For the conventional deprotonation reaction (HA ⇌ H+ + A−), the expression to directly calculate pKa values from ΔGs is:
 | (4) |
| ΔGs = ΔGs(BA) + ΔGs(H+) | (5) |
In addition, the linear regression fit used to obtain the m and C0 parameters is equivalent to including a scaling factor (sf) that corrects for the systematic error of any computational method (for similar deprotonation reactions, i.e., for each particular family of chemical compounds). Therefore, eqn (1) can be rewritten as:
 | (6) |
This means that:
 | (7) |
 | (8) |
Using eqn (7) and (8) is now possible to estimate the scaling factor and the value of ΔGs(H+) for each DFT approach used in this work, according to:
|
sf = mRTln(10)
| (9) |
 | (10) |
Their values are reported in Table 5. The sf values are similar and about 0.3, which supports the idea that sf is mainly ruled by the chemical nature of the family of compounds for which the acid–base equilibria is investigated. On the other hand, ΔGs(H+) not only depend on the chemical family but also on the electronic structure method of choice and, in principle can be used to identify which of them leads to a better agreement with the experiment. It should be noted, however, that this is in addition to the known influence of the solvent model in the ΔGs(H+) value.47
| sf | ΔGs(H+) | |
|---|---|---|
| B3LYP | 0.315 | −259.0 |
| BLYP | 0.304 | −257.9 |
| BHandHLYP | 0.355 | −262.8 |
| BMK | 0.372 | −261.8 |
| M05-2X | 0.351 | −259.5 |
| PBE | 0.310 | −258.6 |
| PBE0 | 0.327 | −261.5 |
| PW91 | 0.304 | −257.8 |
| TPSS | 0.306 | −260.1 |
However, the measured values of ΔGsolv(H+) significantly vary, depending on the conditions of the particular experiment carried out. The variations are rather significant, with the reported ΔGsolv(H+) values ranging from −254 to −265.89 kcal mol−1.22,31 Consequently, the ΔGs(H+) values derived from experiments range from −258.4 to −270.3 kcal mol−1. The values obtained here range from −257.8 to −262.8 kcal mol−1. All the DFT approaches, except BLYP, produce ΔGs(H+) values within the experimental range, with BHandHLYP, PBE0 and BMK leading to the best agreement with the value recommended by Camaioni and Schwerdtfeger.43 Among these three functionals PBE0 is the one leading to the lowest MUE and RMSE, thus it is recommended for being used in combination with the FP method to obtain accurate pKa values for carboxylic acids.
Analyzing the gathered data altogether it can be stated that the MUE and RMSE values found when using the FP method are significantly lower than any of those obtained with the RSD strategies. They are also lower than 0.5 pKa units. This indicates that the FP method is a better choice than RSD to estimate pKa values of carboxylic acid for which this information is not available. However, it has two main drawbacks: (i) it strongly depend on experimental data, and (ii) it requires to perform extra calculations for a training set of molecules, using the same calculation methods (DFT approach, basis set, and solvent model) that are used for the molecules of interest. An alternative to overcome these two disadvantages, for carboxylic acids, is using the RSD2 strategy in conjunction with the E3 or EN3 reaction schemes and the PBE0 functional. Albeit it was found that this strategy leads to higher MUE and RMSE values than the FP method, the discrepancies with the experiments are still below, or very close to, 1 pKa unit.
Conclusions
The reliability of pKa values of carboxylic acids, calculated with different approaches, was assessed by comparisons with the experimental data. It was found that within the reaction schemes design strategy, it is better to calculate solvation energies directly with SMD than using thermodynamic cycles and PCM. In particular, we recommend using this way of calculating solvation energies in conjunction with the E3 or EN3 reaction schemes and the PBE0 functional. This combination leads to mean unsigned error (MUE) and root mean square error (RMSE) values equal to 0.87 and 1.02 pKa units, respectively.The performance of the fitting parameters method was better than that of the reaction schemes design strategy. The agreement of the calculated pKa values with the experimental data in this case is very good, with MUE < 0.45, and RMSE < 0.47, in all the cases. Moreover, six DFT approaches produce MUE < 0.3 and RMSE < 0.35. Among these functionals PBE (MUE = 0.23, RMSE = 0.27) and PBE0 (MUE = 0.26, RMSE = 0.29) are the ones leading to the smallest deviations from the experimental values. According to the gathered data, we recommend using the fitting parameters method for estimating pKa values of carboxylic acids for which this information is still unknown, especially in combination with PBE or PBE0 and the SMD solvent model.
Acknowledgements
The authors thank Laboratorio de Visualización y Cómputo Paralelo at UAM – Iztapalapa for the access to its computer facilities. A. M. R.-Z. acknowledges CONACyT for Doctoral fellowship.References
- J. R. Pliego Jr and J. M. Riveros, J. Phys. Chem. A, 2002, 106, 7434–7439 CrossRef.
- G. Schüürmann, M. Cossi, V. Barone and J. Tomasi, J. Phys. Chem. A, 1998, 102, 6706–6712 CrossRef.
- C. O. da Silva, E. C. da Silva and M. A. C. Nascimento, J. Phys. Chem. A, 1999, 103, 11194–11199 CrossRef CAS.
- A. M. Toth, M. D. Liptak, D. L. Phillips and G. C. Shields, J. Chem. Phys., 2001, 114, 4595–4606 CrossRef CAS.
- M. D. Liptak and G. C. Shields, J. Am. Chem. Soc., 2001, 123, 7314–7319 CrossRef CAS PubMed.
- M. D. Liptak, K. C. Gross, P. G. Seybold, S. Feldgus and G. C. Shields, J. Am. Chem. Soc., 2002, 124, 6421–6427 CrossRef CAS PubMed.
- D. M. Chipman, J. Phys. Chem. A, 2002, 106, 7413–7422 CrossRef CAS.
- K. R. Adam, J. Phys. Chem. A, 2002, 106, 11963–11972 CrossRef CAS.
- G. A. A. Saracino, R. Improta and V. Barone, Chem. Phys. Lett., 2003, 373, 411–415 CrossRef CAS.
- A. Klamt, F. Eckert, M. Diedenhofen and M. E. Beck, J. Phys. Chem. A, 2003, 107, 9380–9386 CrossRef CAS PubMed.
- G. I. Almerindo, D. W. Tondo and J. R. Pliego, J. Phys. Chem. A, 2004, 108, 166–171 CrossRef CAS.
- A. M. Magill, K. J. Cavell and B. F. Yates, J. Am. Chem. Soc., 2004, 126, 8717–8724 CrossRef CAS PubMed.
- R. Vianello and Z. B. Maksić, Eur. J. Org. Chem., 2005, 3571–3580, DOI:10.1002/ejoc.200500153.
- M. Namazian, M. Zakery, M. R. Noorbala and M. L. Coote, Chem. Phys. Lett., 2008, 451, 163–168 CrossRef CAS.
- J. Ho and M. L. Coote, J. Chem. Theory Comput., 2009, 5, 295–306 CrossRef CAS PubMed.
- Y. Song, J. Mao and M. R. Gunner, J. Comput. Chem., 2009, 30, 2231–2247 CAS.
- E. J. Delgado, Chem. Phys. Lett., 2009, 471, 133–135 CrossRef CAS.
- R. Casasnovas, J. Frau, J. Ortega-Castro, A. Salvà, J. Donoso and F. Muñoz, J. Mol. Struct.: THEOCHEM, 2009, 912, 5–12 CrossRef CAS.
- D. P. Dissanayake and R. Senthilnithy, J. Mol. Struct.: THEOCHEM, 2009, 910, 93–98 CrossRef CAS.
- M. Uudsemaa, T. Kanger, M. Lopp and T. Tamm, Chem. Phys. Lett., 2010, 485, 83–86 CrossRef CAS.
- S. Rayne and K. Forest, J. Mol. Struct.: THEOCHEM, 2010, 949, 60–69 CrossRef CAS.
- J. Ho and M. L. Coote, Theor. Chem. Acc., 2009, 125, 3–21 CrossRef.
- A. M. Rebollar-Zepeda and A. Galano, Int. J. Quantum Chem., 2012, 112, 3449–3460 CrossRef CAS.
- A. M. Rebollar-Zepeda, T. Campos-Hernández, M. T. Ramírez-Silva, A. Rojas-Hernández and A. Galano, J. Chem. Theory Comput., 2011, 7, 2528–2538 CrossRef CAS PubMed.
- J. J. Klicić, R. A. Friesner, S.-Y. Liu and W. C. Guida, J. Phys. Chem. A, 2002, 106, 1327–1335 CrossRef.
- F. Eckert and A. Klamt, J. Comput. Chem., 2006, 27, 11–19 CrossRef CAS PubMed.
- S. Zhang, J. Baker and P. Pulay, J. Phys. Chem. A, 2010, 114, 425–431 CrossRef CAS PubMed.
- S. Zhang, J. Baker and P. Pulay, J. Phys. Chem. A, 2010, 114, 432–442 CrossRef CAS PubMed.
- S. Zhang, J. Comput. Chem., 2012, 33, 517–526 CrossRef CAS PubMed.
- S. Zhang, J. Comput. Chem., 2012, 33, 2469–2482 CrossRef CAS PubMed.
- T. Matsui, A. Oshiyama and Y. Shigeta, Chem. Phys. Lett., 2011, 502, 248–252 CrossRef CAS.
- T. Matsui, T. Baba, K. Kamiya and Y. Shigeta, Phys. Chem. Chem. Phys., 2012, 14, 4181–4187 RSC.
- R. Álvarez-Diduk, M. T. Ramírez-Silva, A. Galano and A. Merkoçi, J. Phys. Chem. B, 2013, 117, 12347–12359 CrossRef PubMed.
- T. Baba, T. Matsui, K. Kamiya, M. Nakano and Y. Shigeta, Int. J. Quantum Chem., 2014, 114, 1128–1134 CrossRef CAS.
- A. Galano, A. Pérez-González, R. Castañeda-Arriaga, L. Muñoz-Rugeles, G. Mendoza-Sarmiento, A. Romero-Silva, A. Ibarra-Escutia, A. M. Rebollar-Zepeda, J. R. León-Carmona, M. A. Hernández-Olivares and J. R. Alvarez-Idaboy, J. Chem. Inf. Model., 2016, 56, 1714–1724 CrossRef CAS PubMed.
- M. J. Frisch, G. W. Trucks, H. B. Schlegel, G. E. Scuseria, M. A. Robb, J. R. Cheeseman, G. Scalmani, V. Barone, B. Mennucci, G. A. Petersson, H. Nakatsuji, M. Caricato, X. Li, H. P. Hratchian, A. F. Izmaylov, J. Bloino, G. Zheng, J. L. Sonnenberg, M. Hada, M. Ehara, K. Toyota, R. Fukuda, J. Hasegawa, M. Ishida, T. Nakajima, Y. Honda, O. Kitao, H. Nakai, T. Vreven, J. A. J. Montgomery, J. E. Peralta, F. Ogliaro, M. Bearpark, J. J. Heyd, E. Brothers, K. N. Kudin, V. N. Staroverov, R. Kobayashi, J. Normand, K. Raghavachari, A. Rendell, J. C. Burant, S. S. Iyengar, J. Tomasi, M. Cossi, N. Rega, J. M. Millam, M. Klene, J. E. Knox, J. B. Cross, V. Bakken, C. Adamo, J. Jaramillo, R. Gomperts, R. E. Stratmann, O. Yazyev, A. J. Austin, R. Cammi, C. Pomelli, J. W. Ochterski, R. L. Martin, K. Morokuma, V. G. Zakrzewski, G. A. Voth, P. Salvador, J. J. Dannenberg, S. Dapprich, A. D. Daniels, Ö. Farkas, J. B. Foresman, J. V. Ortiz, J. Cioslowski and D. J. Fox, Gaussian 03, 2003 Search PubMed.
- M. J. Frisch, G. W. Trucks, H. B. Schlegel, G. E. Scuseria, M. A. Robb, J. R. Cheeseman, G. Scalmani, V. Barone, B. Mennucci, G. A. Petersson, H. Nakatsuji, M. Caricato, X. Li, H. P. Hratchian, A. F. Izmaylov, J. Bloino, G. Zheng, J. L. Sonnenberg, M. Hada, M. Ehara, K. Toyota, R. Fukuda, J. Hasegawa, M. Ishida, T. Nakajima, Y. Honda, O. Kitao, H. Nakai, T. Vreven, J. A. Montgomery Jr, J. E. Peralta, F. Ogliaro, M. J. Bearpark, J. Heyd, E. N. Brothers, K. N. Kudin, V. N. Staroverov, R. Kobayashi, J. Normand, K. Raghavachari, A. P. Rendell, J. C. Burant, S. S. Iyengar, J. Tomasi, M. Cossi, N. Rega, N. J. Millam, M. Klene, J. E. Knox, J. B. Cross, V. Bakken, C. Adamo, J. Jaramillo, R. Gomperts, R. E. Stratmann, O. Yazyev, A. J. Austin, R. Cammi, C. Pomelli, J. W. Ochterski, R. L. Martin, K. Morokuma, V. G. Zakrzewski, G. A. Voth, P. Salvador, J. J. Dannenberg, S. Dapprich, A. D. Daniels, Ö. Farkas, J. B. Foresman, J. V. Ortiz, J. Cioslowski and D. J. Fox, Gaussian 09, 2009 Search PubMed.
- E. Cancès, B. Mennucci and J. Tomasi, J. Chem. Phys., 1997, 107, 3032–3041 CrossRef.
- B. Mennucci and J. Tomasi, J. Chem. Phys., 1997, 106, 5151–5158 CrossRef CAS.
- B. Mennucci, E. Cancès and J. Tomasi, J. Phys. Chem. B, 1997, 101, 10506–10517 CrossRef CAS.
- J. Tomasi, B. Mennucci and E. Cancès, J. Mol. Struct.: THEOCHEM, 1999, 464, 211–226 CrossRef CAS.
- A. V. Marenich, C. J. Cramer and D. G. Truhlar, J. Phys. Chem. B, 2009, 113, 6378–6396 CrossRef CAS PubMed.
- D. M. Camaioni and C. A. Schwerdtfeger, J. Phys. Chem. A, 2005, 109, 10795–10797 CrossRef CAS PubMed.
- V. S. Bryantsev, M. S. Diallo and W. A. Goddard Iii, J. Phys. Chem. B, 2008, 112, 9709–9719 CrossRef CAS PubMed.
- J. H. Jensen, Phys. Chem. Chem. Phys., 2015, 17, 12441–12451 RSC.
- A. Nicholls, J. Comput.–Aided Mol. Des., 2014, 28, 887–918 CrossRef CAS PubMed.
- J. Ho, Aust. J. Chem., 2014, 67, 1441–1460 CrossRef CAS.
Footnote |
| † Electronic supplementary information (ESI) available: Error bars for pKa estimations with the different approaches, and uncertainties for the slope and the intercept of the linear fits used in the FP method. See DOI: 10.1039/c6ra16221e |
| This journal is © The Royal Society of Chemistry 2016 |