M. Weiss,
S. Waitz‡
,
R. Ellinghaus,
T. Weller and
R. Marschall*
Justus-Liebig-University Giessen, Heinrich-Buff-Ring 17, 35392 Giessen, Germany. E-mail: roland.marschall@phys.chemie.uni-giessen.de
First published on 16th August 2016
The quaternary photocatalyst CsTaWO6 was for the first time prepared with a high surface area of 115 m2 g−1 via a hard-templating approach. The highly crystalline and phase-pure material was applied in photocatalytic hydrogen production experiments to demonstrate the influence of porosity, surface area and crystallinity on charge carrier transfer.
Since these reactions occur on the surface of the semiconductor, preparation of mesoporous photocatalysts has been investigated to increase their surface areas, the most prominent examples being binary oxides like TiO2 and WO3.2,3 However, there is still debate whether a high surface area is really the most important factor for photocatalytic activity, or whether the crystallinity plays a more important role. Ismail et al. indicated for palladium-modified mesoporous TiO2 that the surface area is at least as important for a high photonic efficiency as good charge carrier transport due to high crystallinity.4 Maschmeyer et al. showed for graphitic carbon nitride prepared via hard-templating in mesoporous silica that the surface area of the material is negligible for high photocatalytic activity.5 In contrast, Durrant et al. concluded from transient absorption spectroscopy that indeed a high surface area of the photocatalyst (TiO2) is crucial to achieve a high hole scavenging efficiency, e.g. with methanol.6
To prepare mesoporous oxides with high pore ordering and narrow pore size distribution, several templating techniques have been developed in the last decades. Soft-templating utilises molecular aggregates of surfactants/block-copolymers (micelles) as templates in sol–gel syntheses, while in hard-templating, ordered mesoporous SiO2 or carbon host materials are infiltrated with dissolved precursors and removed after condensation and calcination, respectively.7 The hard-templating approach is often used to prepare more complex materials, e.g. ternary oxides.8 In contrast, soft-templating is very difficult for complex oxides due to controlling hydrolysis and precursor–template interaction of all molecular precursors during preparation, often resulting in porous materials without ordering of the pores, non-porous materials, or even by-phases in the final product. For example, our recent efforts to prepare ordered mesoporous CsTaWO6 gave highly porous and photocatalytically active materials, however with non-ordered porosity.9
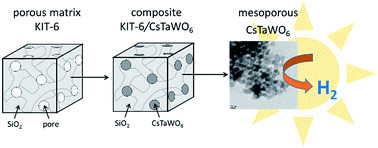
Therefore, we have chosen hard-templating for the preparation of the very promising quaternary photocatalyst CsTaWO6, aiming for ordered mesoporosity, to further investigate the most important factor influencing photocatalytic activity in complex oxide photocatalysts. The band gap of this compound can be easily engineered via doping10 or lattice variation.11 A recently reported sol–gel synthesis12 was used for the infiltration of mesoporous silica KIT-6 (ref. 13) (details of the sample preparation are given in the ESI†). In short, the clear solution containing metal precursors for CsTaWO6 and ethylenediaminetetraacetic acid (EDTA)/citric acid was used for infiltration into the pores of KIT-6 silica material via incipient wetness method.8b One impregnation cycle, including infiltration with intermediate drying at 100 °C for at least 4 hours, was performed 4–6 times, followed by intermediate calcination to remove the organic residues at varied temperatures (350 °C, 400 °C, and 450 °C). This cycle was repeated 4–5 times before a final calcination step (at 600 °C, with a subsequent treatment at 800 °C in one case) was performed, and the silica template was removed by etching with 5 M NaOH, in which CsTaWO6 is stable. The synthesis procedure is illustrated in Fig. S1 (ESI†).
Fig. S2 (ESI†) shows the typical nitrogen physisorption isotherms for one impregnation and calcination cycle. Fig. S2a† displays the adsorption behaviour after 5 subsequent impregnation steps compared to the utilised bare KIT-6 template; Fig. S2b† shows the respective isotherm of the sample after the following calcination step at 600 °C. Impregnation reduces the pore volume strongly, while calcination recovers some of the pore volume due to the removal of organic residues. We chose this temperature, due to earlier results for the crystallisation of CsTaWO6 from sol–gel-synthesis, for all calcination steps.12 After four cycles of impregnation and calcination, the resulting product after silica removal showed a high surface area (95 m2 g−1) but non-ordered mesopores (pore volume: 0.38 cm3 g−1). However, the product was not phase-pure, but contained WO3 and Ta2O5 as by-phases (Fig. S3a, ESI†), shown by X-ray diffraction (XRD).
Investigating XRD patterns after each cycle (not shown), we found that such by-phases were already detectable after two cycles. Thus, we concluded that the crystallisation process of CsTaWO6 needed to be postponed until the final cycle in order to obtain phase-pure CsTaWO6. Organic complexing agents are necessary for the precursor solution to be stable for the infiltration procedure. However, further impregnation cycles to fill the pores of KIT-6 completely require their removal. Finding the optimum calcination temperatures for the removal of organic residuals and avoiding crystallisation was done via thermogravimetry coupled with mass spectrometry (TG-MS) and XRD.
In order to investigate a better calcination temperature after each impregnation cycle, we dried and calcined the precursor solution at different temperatures. Surprisingly, first reflections of crystalline CsTaWO6 were already detected after calcination of the dried precursor solution at 425 °C (Fig. 1a), which is in contrast to earlier reports.12 Interestingly, as can be seen from Fig. 1b indicated by three vertical dotted lines, the precursor decomposition after infiltration into KIT-6 is still continuing between 350 and 450 °C, shown by the detection of water (m/z = 18, H2O+) and CO2 (m/z = 44, CO2+) in the MS. Interestingly, the MS signals are much broader coming from this composite than from the pure dried precursor (Fig. S4, ESI†), indicating a slower decomposition process inside the pores and pore blocking for efficient release. Unfortunately, the preparation at 500 °C where the decomposition process is complete (Fig. 2b), also leads to an impure material (not shown). Thus, we investigated the temperatures 350 °C, 400 °C and 450 °C for intermediate calcination to find the optimum compromise procedure to get highly porous and phase-pure CsTaWO6 materials with high surface areas via hard-templating.
![]() | ||
Fig. 1 (a) XRD patterns of the dried CsTaWO6 sol–gel precursor solution, calcined at different temperatures; (b) TG-MS of infiltrated KIT-6 containing dried CsTaWO6-precursors before calcination. |
Fig. 2 exemplarily shows the characterisation data for sequential pore filling of KIT-6 by 5 cycles of impregnation and calcination, where the intermediate calcination was performed at 400 °C, and the final calcination at 600 °C. The adsorbed gas volume decreases with additional cycles, due to pore filling (Fig. 2a). Moreover, the pore size distribution shifts to smaller diameters, indicating smaller pores due to filling. The respective structural data are given in Table S1 (ESI†). After 5 cycles of impregnation and calcination the surface area decreases from 490 m2 g−1 of pure KIT-6 down to 105 m2 g−1, the pore volume decreases from 1.38 cm3 g−1 to 0.23 cm3 g−1. The respective XRD patterns are given in Fig. 2b, indicating that the calcined composite shows no reflections for crystalline CsTaWO6 before a final calcination at 600 °C (purple pattern), as intended. The broad signal between 20 and 35 degrees 2θ can be attributed to amorphous silica and amorphous precursors. Although Fig. 1a showed already faint reflections of CsTaWO6 when the pure precursor solution was calcined at 425 °C, the crystallisation seems to be delayed inside the pores of KIT-6, possibly due to a bad heat transfer via silica and pores.
The structural data for the samples prepared similar but with 350 °C or 450 °C as temperatures for the intermediate calcination are also given in Table S1,† together with physisorption isotherms and XRD pattern after each cycle showing the same trends (Fig. S5 & S6, ESI†). To investigate the influence of the calcination temperature on the photocatalytic activity, the KIT-6/CsTaWO6 composite intermediately calcined at 400 °C was, additionally to the final calcination at 600 °C, further calcined at 800 °C before silica removal. After removal of the silica by etching with 5 M NaOH, phase-pure crystalline mesoporous CsTaWO6 was obtained in all four cases of temperature treatment. The phase purity was evidenced by XRD patterns recorded after silica removal (Fig. 3a). Although one sample was additionally calcined at 800 °C, no distinct difference can be seen comparing the patterns. This implies that our strategy of delaying the crystallisation inside the pore system until the final calcination step by keeping the intermediate calcination below 500 °C was actually successful. Fig. 3b shows the respective N2 physisorption isotherms of the same samples. The derived structural data are given in Table 1.
Calcination temperatures | BET surface area/m2 g−1 | Total pore volume/cm3 g−1 |
---|---|---|
350 °C/600 °C | 95 | 0.32 |
400 °C/600 °C | 105 | 0.35 |
450 °C/600 °C | 115 | 0.32 |
400 °C/600 °C/800 °C | 85 | 0.33 |
All samples finally calcined at 600 °C show comparable surface areas of around 100 m2 g−1, peaking at 115 m2 g−1 for the sample with intermediate heat treatment at 450 °C. Only the additionally calcined material has slightly decreased surface area of 85 m2 g−1. Residual silica content was roughly estimated to ∼2 at% by energy-dispersive X-ray analysis. It is interesting to note that all mesoporous CsTaWO6-samples prepared via hard-templating in this study show larger surface areas than soft-templated CsTaWO6 from evaporation-induced self-assembly (called EISA),9 and larger pore volume of around 0.3 cm3 g−1. However, the pore size distributions shown in Fig. 3b are for all samples very broad, indicating that also hard-templating for CsTaWO6 does not result in ordered mesopores. TEM images in Fig. 4 confirm the physisorption data. Although all samples are highly porous, no pore ordering can be observed. The main reason is still the amount of complexing agents necessary to infiltrate the metal precursors into the pores of KIT-6, leaving too many voids in the pore system after the final calcination step. This results in a structural breakdown inside the silica pore system, leading to a non-perfect negative replica of the KIT-6 pore system. In some areas a slight pore ordering can be observed (Fig. S7, ESI†), but not throughout the samples. Reducing the amounts of complexing agents citric acid and EDTA however results in unstable solutions for the infiltration procedure. HRTEM images and selected area electron diffraction confirm the high crystallinity of the mesoporous samples (Fig. S8, ESI†).
![]() | ||
Fig. 4 TEM images of mesoporous crystalline CsTaWO6 prepared via hard-templating, intermediate calcination and final calcination for crystallisation are given. |
The four different samples of mesoporous CsTaWO6 prepared by hard-templating were finally investigated in photocatalytic H2 evolution test reactions in aqueous methanol solutions (Experimental details given in the ESI†), the results are shown in Fig. 5. In situ photodeposition was performed to provide our samples with 0.025 wt% rhodium as co-catalyst.14 All our four mesoporous samples generate H2. Interestingly, the sample with the broadest pore size distribution but the smallest surface area gives the highest photocatalytic activity. It is also the sample that underwent additional calcination at 800 °C. In contrast, the mesoporous CsTaWO6 with the largest surface area and narrowest pore size distribution shows the lowest activity, especially in the first two hours. Some samples are showing typical decays towards steady-state rates. This behaviour is typical for initial co-catalyst oxide formation, a problem known from oxygen evolution reaction on platinum nanoparticles.15 We tried to investigate this behaviour on our samples, however the amounts of co-catalyst are below the detection limit of XPS, and we were not able to detect rhodium or rhodium oxide.
As mentioned before, from XRD pattern analyses all samples exhibit similar crystallinity, indicated by similar intensities and peak width and similar crystallite sizes (Table S2 ESI†). However, they have distinct differences in pore size distribution. Comparing the H2 evolution results with the pore size distributions shown in Fig. 3b, a trend can be determined showing decreasing photocatalytic activity with narrowing pore size distribution. Since all surface areas of the mesoporous CsTaWO6 samples are nearly comparable, the wider and broader pores of the additionally calcined sample seem to facilitate H2 evolution.
These results are in accordance with earlier reports shown that narrow pore sizes inhibit electrolyte transport to the active sites inside the pores of mesoporous soft-templated CsTaWO6, leading to reduced H2 evolution activities.9 Also in the present study, the broader pore size distribution in the 400 °C/600 °C/800 °C sample facilitates a better mass transport of methanol into the pore system to react with photogenerated holes, leading to less electron–hole recombination and comparably higher H2 evolution.
Moreover, comparable activities can already be achieved by intermediate calcination at 350 °C and final calcination at 600 °C. Intermediate calcination higher than 350 °C or additional calcination at 800 °C are not necessary, saving time and energy to achieve the same H2 evolution steady state rates.
Two non-porous CsTaWO6 samples, prepared via sol–gel route,12 were also tested as references. The non-porous sample calcined at 600 °C for 10 hours showed no activity, while all the mesoporous samples calcined at this temperature are able to generate hydrogen. Non-porous CsTaWO6 calcined at 850 °C, the best sol–gel-derived sample according to literature,12 does generate hydrogen, but less compared to the best mesoporous samples, which have been treated at comparable temperatures. The results show that enabling porosity does increase photocatalytic activity, but only when the pores are well accessible. It is also evident that optimizing porosity can compensate for long calcination times or high calcination temperature, and that surface area is not the major factor controlling photocatalytic activity.
It should be mentioned that the mesoporous samples exhibited slightly enhanced photoabsorption compared to the non-porous references (Fig. S9, ESI†), which can be attributed to the porous nanostructure, in accordance with literature.16 This can additionally explain the higher activity compared to the non-porous references, but not the different activities of the mesoporous samples.
Moreover, using a different KIT-6 template with smaller pores of 6 nm did not lead to a phase-pure mesoporous CsTaWO6 material (Fig. S10, ESI†). Future studies will investigate alternative precursors for infiltration and smaller particle sizes of the template in order to achieve highly ordered mesopores in the resulting powders, and to find the optimum pore size for mesoporous photocatalysts without mass transport limitations.17
In conclusion, we have successfully prepared highly crystalline phase-pure mesoporous CsTaWO6 via hard-templating for the first time, with surface areas larger than reported by any other synthesis method before. Applying them in photocatalytic H2 evolution experiments, we determined that the pore size distribution rather than the surface area or crystallinity is crucial for achieving the maximum activity of mesoporous samples. This study reveals that the major factors influencing photocatalytic activity of mesoporous photocatalysts is the pore size and pore size distribution.
Footnotes |
† Electronic supplementary information (ESI) available: Experimental details, additional physisorption data, XRD, TG-MS, TEM. See DOI: 10.1039/c6ra16016f |
‡ Present address: Georg-August University Göttingen, Tammannstr. 4, 37077 Göttingen, Germany. |
This journal is © The Royal Society of Chemistry 2016 |