Nanonization of andrographolide by a wet milling method: the effects of vitamin E TPGS and oral bioavailability enhancement

Ping Dua, Qikun Jianga, Rujie Yanga, Cuiru Liua, Yingchao Lia, Liyuan Wanga, Peng Xueb, Qiang Fu*b and Tianhong Zhang*a
aDepartment of Pharmaceutical Analysis, School of Pharmacy, Shenyang Pharmaceutical University, No. 103, Wenhua Road, Shenyang 110016, Liaoning Province, PR China. E-mail: graham_pharm@aliyun.com; zhangth_student@aliyun.com; Fax: +86-24-23986321; Tel: +86-24-23984159
bDepartment of Pharmaceutics, School of Pharmacy, Shenyang Pharmaceutical University, No. 103, Wenhua Road, Shenyang 110016, Liaoning Province, PR China

Received 20th June 2016 , Accepted 5th October 2016

First published on 11th October 2016


Abstract

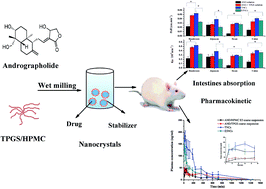
Andrographolide (AND) has wide prospects in clinical use, but suffers from the restriction of poor oral bioavailability, due to its low solubility, rapid and extensive metabolism and efflux by P-glycoprotein (P-gp). In this study, for the first time, nanocrystals of AND, a model of BCS class II, were obtained via the wet milling method, with TPGS as a stabilizer to enhance the bioavailability of AND; HPMC E5 nanocrystals (E5NCs) were fabricated as the negative control. Using the optimized formulation, AND/TPGS nanocrystals (TNCs) and E5NCs were prepared. Physical characterizations demonstrated that the two nanocrystals shared similar particle size, the same crystallinity and identical morphology. Both nanocrystals were physically stable at 4 °C and 25 °C, respectively, for at least 1 month. Significant increases in cumulative dissolution (90% and 70%) were obtained after the TNCs and E5NCs dissolved at 60 min, which were higher than for coarse AND (no more than 40%), indicating that TNCs were superior to E5NCs in dissolution. As elucidated in the single-pass intestinal perfusion studies of AND, the nanocrystals could facilitate intestinal uptake, and TPGS possessed improved intestine absorption properties. Oral administration of AND nanocrystals produced a substantial improvement in oral absorption, compared to the AND coarse suspension. Compared to E5NCs, there was a significant difference in AUC0–24h after the oral administration of TNCs. Compared to the model group, the TNCs and E5NCs inhibited xylene induced ear swelling by 59.98 and 48.06%, respectively. These results corroborated that TNCs were a promising formulation choice for the oral delivery of AND.
1. Introduction

Andrographolide (AND) (Fig. 1) is a diterpenoid lactone separated from the Chinese herb A. paniculata. It is famous as the “king of bitters” and a “natural antibiotic”, and has been proven to be one of the main physiologically active chemical components.1 The clinical dosage forms of AND include dispersion tablets, soft capsules, dripping pills and so on. AND has been commonly used to remedy fever, cold, inflammation,2,3 herpes, sore throat and a variety of other chronic infectious diseases.4 Interestingly, AND has also been proved to have many pharmacological activities, including anticancer,5 antihyperglycemia,6,7 anti-angiogenesis,8 immunostimulation, hepatoprotection9 and anti-HIV effects.8 As such, AND has wide prospects in clinical use and has drawn extensive attention in recent years. However, the application of AND in the clinical setting has been restricted by its unstable physicochemical properties, including temperature-sensitive degradation, and instability in extreme acidic and alkaline conditions.10,11 It should be highlighted that AND has poor oral absorption and low bioavailability (2.64%), due to its very low aqueous solubility (74 μg mL−1),12 poor dissolution rate, rapid and extensive metabolism, mainly in the duodenum and jejunum, and efflux by P-gp, mainly in the ileum and colon.13,14 In short, it is urgently necessary to improve the solubility and dissolution rate of AND, and to avoid the first-pass effect and efflux by P-gp, in order to overcome the poor oral bioavailability.
image file: c6ra16002f-f1.tif
Fig. 1 Chemical structure of AND.

In order to ameliorate the bioavailability of AND, several efforts, such as solid dispersion technology15 and particle size reduction,16 have been made to improve its solubility and dissolution. Although the dissolution rate has been improved, the reasons that restrict the application of AND, such as the short half-time, rapid and extensive metabolism and efflux by P-gp have been ignored.14 Many drug delivery systems for AND have also been tried for potential clinical use, including the utilisation of liposomes,8 nanoparticles,17 microspheres,18 self-microemulsification19 and so on. While the above mentioned formulations contain several materials that make the optimization of their preparation process complicated and time-consuming, from a toxicological point of view, abundant surfactants and cosurfactants are used in their preparation, which is of great significance; more importantly, all of these formulations are limited by low drug loading (<20%). Therefore, further explorations are required to improve the bioavailability of AND, and to overcome the above deficiencies.

Nanocrystals are a carrier-free nanoparticle system with pure-drug crystals that are stabilized by minimal amounts of polymer and/or surfactant with high drug loading capacity.20,21 In general, techniques to prepare nanocrystals could be summarized into top-down methods (e.g., wet milling or high pressure homogenization)22,23 and bottom-up approaches (e.g., precipitation by liquid solvent–antisolvent addition).21 Among the techniques, wet milling is a well tried technique that is cost-effective and quick, and the process is free of organic solvents and easy to scale up.24,25 In consideration of the temperature sensitive properties of AND, the heat energy generated by wet milling is lower than that produced during dry milling, as the drugs are suspended in an aqueous medium.26 According to the Noyes–Whitney equation, by reducing the particle size, the total surface area of the nanocrystals is sharply increased, and the dissolution rate is then greatly enhanced.21 Moreover, nanocrystals could prevent the entrapped drugs from experiencing degradation, hydrolysis, and oxidation, and they could also adhere to the intestinal tract mucosa and prolong the retention and take-up time of the drug, and finally enhance the absorption.27,28 It has also been demonstrated that nanocrystals could be absorbed by enterocytes through macropinocytosis and caveolin-mediated endocytosis pathways; thus, the nanocrystals could escape the first-pass metabolism and oral absorption would be increased.29

D-a-Tocopheryl polyethylene glycol 1000 succinate (TPGS), a water-soluble derivative of the natural vitamin E (a-tocopherol), is an effective P-gp inhibitor and has been approved as a safe excipient by the US FDA.30 This non-ionic surfactant consists of a hydrophilic polar head and portion of polyethylene glycol 1000, and it widely serves as a stabilizer for nanocrystals.31 Moreover, TPGS could increase drug solubility, promote cell take-up, and prolong drug half-time in vivo.32 Due to the coexistence of surface-energy reduction and other features of TPGS, we hypothesized that TPGS could be used as a stabilizer in AND nanocrystal systems.

On the basis of the above-mentioned considerations, it was thought plausible to produce nanocrystals using TPGS as a stabilizer to improve the bioavailability of AND. Meanwhile, from conventional stabilizers, E5NCs were screened as a negative control. This study was performed to prepare the two nanocrystals to obtain the greatest extent of size reduction and investigate their impact on the solid state characteristics, in vitro dissolution, in situ single pass intestinal perfusion, in vivo pharmacokinetics performance and the therapeutic efficacy performance of AND.

2. Materials and methods

2.1. Materials

AND was purchased from Xian Haoxuan Biotechnology Co. Ltd, Shanxi, China. Commercial dripping pills of andrographolide (150 mg) were purchased from TASLY Holding Group Co. Ltd (Tianjin, China). Hydroxypropylmethyl cellulose E5 (HPMC E5), sodium dodecyl sulfate (SDS) and polyvinylpyrrolidone K30 (PVP K30) were obtained from Anhui Shanhe Pharmaceutical Excipients Co. Ltd (Huainan, China). Sodium deoxycholate (DOC) was purchased from Beijing Aoboxing Biotech Co. Ltd (Beijing, China). Lutrol® poloxamer 188 (F68), poloxamer 127 (F127) and TPGS were provided by BASF Co. Ltd (Shanghai, China). Ethyl acetate (analytical grade) was purchased from Tianjin Kermel Chemical Reagent Co. Ltd (Tianjin, China), while acetonitrile and methanol were purchased from Concord Technology Co. Ltd (Tianjin, China).

2.2. Preparation of AND nanocrystals

AND nanocrystals were prepared via the wet media milling method, using a planetary mill, model PM (Nanjing, Chishun, Technology Co. Ltd, Tianjin, China), equipped with several zirconia milling chambers with chamber volumes of 100 mL. Firstly, an aqueous suspension containing AND and surface stabilizers was prepared by continuous magnetic stirring at 1000 rpm at 25 °C; the suspension was stirred until a uniform aqueous suspension was obtained. Then, 0.5 mm zirconium dioxide beads were used to break up the bulk drugs into nanoscale particles. The milling procedure was performed in a standard milling chamber. Each chamber was loaded with 30 mL beads and 30 mL of uniform aqueous suspension consisting of AND (4%, w/v) and stabilizers. Then the bulk was milled for 119 min at room temperature to obtain AND nanocrystals.

2.3. Freeze-drying

In order to improve the physical stability of the nanocrystals, 3% (w/v) of mannitol was added as a cryoprotectant, followed by freeze-drying using a refrigerator (LAM-0.5F, Shinva Medical Instrument Co. Ltd, Shandong, China). The samples were pre-frozen at −80 °C for 8 h, the refrigerator was vacuumized, then the shelf inlet temperature was maintained at −40 °C for 6 h and then the temperature was raised to 2 °C and kept for 6 h as the primary drying step. A final drying step at 25 °C was carried out for 3 h.

2.4. Characterization of AND nanocrystals

2.4.1. Particle size and zeta potential determination. The mean particle size (z-ave), polydispersity index (PDI), and zeta potential of the nanocrystals were measured using a Zetasizer Nano ZS90 instrument (Malvern Co., UK) at 25 °C and at a fixed angle of 90°. A drop of the nanocrystals specimen (about 5 μL) was diluted with 5 mL of deionized water and then analyzed for 3 runs with 10 cycles.
2.4.2. TEM. The morphology of nanocrystals was investigated using TEM (H-7650, Hitachi High-technologies (Shanghai) International Trading Co. Ltd, Shanghai, China). In brief, about 10 μL of diluted nanocrystals were dropped onto copper grids for 3 min and dried with cold air. Phosphotungstic acid solution (2%) was used as a stain. After staining for 30 s and drying in air, the grids were scanned by TEM, at an acceleration voltage of 80 kV.
2.4.3. SEM. The SEM observation was conducted using an FEI Inspect F50 SEM. In brief, specimens were fixed on an aluminum stub with conductive double-sided-adhesive tape and further sputtered with a thin layer of gold/palladium. The surface morphology of the samples was then viewed.
2.4.4. DSC. DSC curves were obtained using a DSC 1 instrument (Mettler-Toledo International Inc., Switzerland). The samples (course AND, blank excipients, physical mixtures and AND nanocrystals) were weighed accurately and packed into an aluminum pan; aluminum oxide was used as a reference standard. The process was then carried out over the range 30–250 °C at a rate of 10 °C min−1.
2.4.5. PXRD. The PXRD of coarse AND, blank excipients, physical mixtures and dried nanocrystals were analyzed by a D/max-r A instrument (Rigaku Denki, Japan) equipped with a Cu Kɑ radiation source at 45 kV and 30 mA current over the range of 3° ≤ 2θ ≤ 45° at a scan rate of 1° per min.
2.4.6. FT-IR. The FT-IR of crude AND and test samples were performed on an FT-IR spectrometer (Bruker IFS 55, Switzerland). The samples were co-ground with potassium bromide and scanned over the range of 4000–400 cm−1.

2.5. Short-term physical stability

Short-term stability of AND nanocrystals was determined under refrigerated conditions (4 °C) and 25 °C for 1 month. The two AND nanocrystals were kept under each storage condition, and at predetermined time intervals, the samples were withdrawn and subjected to particle size and PDI analysis.

2.6. Dissolution experiments

Dissolution profiles of AND powder were determined on a dissolution apparatus (Tianjin Tianda Tianfa Technology Co. Ltd, Tianjin, China) according to the paddle method described in the China pharmacopoeia (2015 edition). Pure drug, physical mixtures, and dried nanocrystals equivalent to 50 mg of AND were filled into hard gelatin capsules (size # 0) and were then dropped into 900 mL of dissolution medium incubated at 37 °C ± 0.5 °C at 75 rpm rotation rate, to perform the dissolution test. Pure water, 0.1 mol L−1 HCL solution, pH 4.5 acetate buffer and pH 6.8 PBS were used as the dissolution media. 5 mL aliquots were collected at 5, 10, 20, 30, 45 and 60 min, and equal amounts of fresh medium were added to keep the volume constant. After passing through a 0.22 μm cellulose acetate membrane, 20 μL of filtrate were immediately quantitatively determined by HPLC at 225 nm. Tests were carried out in triplicate and the results were noted as an average. AND dripping pills (equivalent to 50 mg AND) were also used for comparative evaluation.

2.7. In situ single-pass intestinal perfusion (SPIP) study

The animals had free access to water, but were fasted overnight prior to the experiment. In order to anesthetize the rats, they were injected with urethane at a dose of 1.5 g kg−1 intraperitoneally. Then, rats were bound to an operation table under a heating lamp, which was used for warming the body at around 37 °C. Through the midline abdominal incision, about 10 cm of a segment of intestine was exposed. Afterwards, the intestines were cleaned up with 37 °C saline and the remaining buffer solution was removed with air. Four segments of intestine (duodenum, jejunum, ileum and colon, 5–10 cm each) were cannulated at both ends using a glass cannula; one end was linked to a peristaltic pump (BT100, Changzhou Purui Precision Pump Co., Ltd, China) and the other end was linked to a collecting vial.

Krebs-Ringer buffer solution acted as the perfusion solution with a pH value of 7.4, containing 7.8 g NaCl, 0.35 g KCl, 1.37 g NaHCO3, 0.02 g MgCl2, 0.22 g NaH2PO4 and 1.48 g glucose, in 1000 mL purified water. The solution group of coarse powder was prepared by dissolving 20 mg AND in 3 mL dimethylsulfoxide, which was diluted with the perfusion solution to obtain a final drug concentration of 200 μg mL−1 in a 100 mL volumetric flask. The above-mentioned solution group of perfusates were added to 15 mg TPGS to prepare a TPGS solution group of coarse powder. The AND nanocrystal groups were directly diluted with the perfusion solution to ultimately yield a concentration of 200 μg mL−1. The isolated intestine segments were first perfused with tested buffer solution at 0.2 mL min−1 for 30 min to ensure steady-state conditions.

After achieving the balance, the outlet solution was immediately collected in preweighed vials at 15 min intervals and the study lasted 120 min. Perfusate samples were promptly triply-diluted with methanol to inhibit enzymatic reactions. At the end of the perfusion, the length and inner diameter of each segment of intestine were accurately measured and each pipe containing sample was weighed. The obtained specimens were assayed by HPLC at 225 nm after they were filtered (0.22 μm).

In order to correct the results distorted by absorbing water from the intestines, the volume adjustment was carried out by gravimetry, with density correction, according to the following equations:33

image file: c6ra16002f-t1.tif

image file: c6ra16002f-t2.tif
where min, ρin, vin are the mass, density, volume of the inlet drug, and mout, ρout, vout are the mass, density, volume of the outlet samples after adjustment. The assessment index of the SPIP include the rate constant of drug absorption (Ka) and effective permeability (Peff), which are calculated using the following formulas:34
image file: c6ra16002f-t3.tif

image file: c6ra16002f-t4.tif
where Qin is the perfusion rate (0.2 mL min−1); Cin and Cout are the concentrations of AND in the inlet and outlet, respectively; r and l are the inner diameter and length of the intestine, respectively.

2.8. HPLC analysis

All samples were determined by a Waters e2695 HPLC system, which consisted of a 2489 UV/Visible detector and a 515 pump (Waters Technology Co., Ltd, Shanghai, China). A reverse phase Phenomenex-C18 column (4.6 × 150 mm, 5 μm) was used for chromatographic separation and the mobile phase was made up of methanol and distilled water (60[thin space (1/6-em)]:[thin space (1/6-em)]40, v/v) and the flow rate was 1.0 mL min−1. The detector was set at 225 nm.

2.9. Bioavailability study for AND formulations

Male SD rats (180–220 g) were obtained from the Laboratory of the Animal Center of Shenyang Pharmaceutical University and the animal experiments were approved by Shenyang Pharmaceutical University Animal Care and Use Committee. The experimental protocol was in accordance with the welfare ethical principles of experimental animals for the use of experimental animals. All animal studies were carried out according to the Guide for Care and Use of Laboratory Animals. The SD rats were randomly assigned to four groups, and a single dose study was conducted with a dose of 120 mg kg−1, given by intragastric administration. Before the experiments, they were fasted for 12 h, but were allowed free access to water. Each group was administered the AND/HPMC E5 coarse suspension, AND/TPGS coarse suspension, E5NCs and TNCs, respectively. Serial blood samples were collected after dosing at the pre-determined points: 5 min, 10 min, 15 min, 30 min, 45 min, 1 h, 1.5 h, 2 h, 3 h, 4 h, 6 h, 8 h, 10 h, 12 h and 24 h. The obtained blood samples were centrifuged instantly at 13[thin space (1/6-em)]000 rpm for 10 min to achieve plasma samples. Then, the plasma samples were stored at −20 °C until analysis.

2.10. Therapeutic efficacy study

In clinical studies, AND was especially used for treating inflammation. The mouse ear-swelling test (MEST) was established in the early 1980s to provide a lower cost, shorter and more objectively graded test for the assessment of the anti-inflammatory activity of the drug.35 Kunming mice were purchased from the Laboratory of the Animal Center of Shenyang Pharmaceutical University and the animal experiments were approved by Shenyang Pharmaceutical University Animal Care and Use Committee. The experimental protocol was in accordance with the welfare ethical principles of experimental animals for the use of experimental animals. Forty Kunming mice were randomly divided into four groups (10 mice per group): model control group (saline 0.1 mL/10 g), AND coarse suspension group (120 mg kg−1, CMC–Na suspension), TNCs group (120 mg kg−1), E5NCs group (120 mg kg−1). All the groups were administered drugs intragastrically once daily for 4 days. On the fourth day, after the mice were pre-treated with the drugs, one hour later, 50 μL of xylene was smeared onto the anterior and posterior surfaces of the right ear of each mouse and the left ear served as a control.36 Approximately 40 min after xylene application, the mice were killed and circular segments of both right and left ears were taken and weighed. The weight difference between the right and left ears is the measured mouse ear swelling. The ear swelling inhibition rate was determined by the following formula:37
Ear swelling inhibition rate (%) = (AB)/A × 100%
where A and B denote ear swelling of the model negative group and ear swelling of the drug groups, respectively.

2.11. Plasma sample preparation

Plasma samples (100 μL) were spiked with 50 μL methanol–water (50[thin space (1/6-em)]:[thin space (1/6-em)]50, v/v) and 50 μL internal standard solution (400 ng mL−1, resveratrol), and vortexed for 60 s. Then, 3.0 mL of ethyl acetate were added to the above-mentioned mixture, followed by vortexing for 3 min and centrifugation at 3500 rpm for 10 min. The supernatant was then transferred to a plastic tube and evaporated to dryness under a gentle stream of nitrogen at 37 °C. Finally, the dried residue was redissolved in 100 μL methanol–water (50[thin space (1/6-em)]:[thin space (1/6-em)]50, v/v) and 10 μL samples were injected into the Acquity UPLCTM system (Waters Co. Ltd, Milford, MA, USA).

2.12. LC-MS analysis

The separation was carried out on a C18 column (50 mm × 2.1 mm, 1.7 μm Phenomenon Corp.) with mobile phase composed of acetonitrile and water (29[thin space (1/6-em)]:[thin space (1/6-em)]71, v/v) at a flow rate of 0.2 mL min−1, while the column temperature was maintained at 25 °C. Quantitation of the analytes was performed by selective ion reaction (SIR) of the transition of m/z 331.3 for AND and m/z 227.0 for IS. AND and IS were determined in negative mode. The pharmacokinetic parameters were calculated using DAS 2.1.1 software.

2.13. Statistical analysis

All values were expressed as their mean ± S.E. The statistical analysis was made using the t-test. Analyses were performed in the SPIP tests and pharmacokinetic studies. The differences were considered statistically significant if p < 0.05.

3. Results and discussion

3.1. Preparation, hydrodynamic diameter and zeta-potential analysis of TNCs

The concentration of TPGS needed to be optimized because insufficient amounts of stabilizer fail to provide complete surface coverage of drug molecules, which is required to maintain repulsion between the particles in the nanocrystals, and consequently leads to stability problems like flocculation or crystal growth.38 The addition of ionic stabilizers causes electric repulsion and the addition of non-ionic stabilizers generates a steric barrier between suspended particles. Such barriers are responsible for the prevention of particle aggregation and the maintenance of PDI of the nanoformulations.39 TPGS with and without sodium dodecyl sulfate (SDS) have also been widely used.40 The results shown in Table 1 signifies that when TPGS was 0.5% and 1%, nanocrystals with smaller particle size were obtained; however, after TPGS reached 2%, the particle size of the nanocrystals reached 650 nm. It was also noted that the particle size of the nanocrystals decreased with the addition of SDS in the multiple stabilizer system; however, the concentration of SDS had little effect on the nanocrystals size reduction. TPGS (0.5%) and SDS (0.1%) were considered as the optimized formulation, which yielded a mean particle size of 350.9 ± 8.84 nm with a PDI of 0.139 ± 0.0123 and zeta potential of −28.11 ± 0.62 mV.
Table 1 The influence of TPGS and SDS on the particle size and polydispersity index of andrographolide nanocrystals (4%, w/v) prepared by the wet milling method (mean ± SD, n = 3)
Formulation (4% w/v drug) TPGS (% w/v) SDS (% w/v) Z-Average (nm) PDI
F1 0.25   563.1 ± 42.61 0.117 ± 0.10
F2 0.5   481.8 ± 22.46 0.081 ± 0.02
F3 1   481.6 ± 22.61 0.111 ± 0.09
F4 2   650.0 ± 33.67 0.383 ± 0.22
F5 0.5 0.05 351.7 ± 2.57 0.142 ± 0.03
F6 0.5 0.1 350.9 ± 8.85 0.139 ± 0.12
F7 0.5 0.2 351.3 ± 9.41 0.147 ± 0.03


3.2. Preparation, hydrodynamic diameter and zeta-potential analysis of E5NCs

In order to screen the negative control group, we prepared AND nanocrystals with different stabilizers (1%, w/v). The particle size distribution of different AND nanocrystals is shown in Fig. 2. The results indicate that non-ionic surfactants were less effective (z-ave > 560 nm, PDI > 0.18) than ionic surfactants (z-ave < 520 nm, PDI < 0.089) in terms of particle size reduction. However, when it came to the stability of the ionic surfactant nanocrystals, it was found that the ionic surfactants precipitated in 3 days. When compared with different polymers, HPMC E5 was shown to produce the most efficient particle size reduction. Therefore, HPMC E5 was chosen for further study.
image file: c6ra16002f-f2.tif
Fig. 2 The influence of single stabilizer systems (1%, w/v) on the particle size and polydispersity index of andrographolide nanocrystals (4%, w/v) prepared by the wet milling method.

E5NCs were prepared as follows: HPMC E5 (0.5%), SDS (0.1%) and AND (4%). Interestingly, the nanocrystals prepared with this formulation yielded a mean particle size of 363.0 ± 6.6 2 nm with a PDI of 0.096 ± 0.05 (n = 3) and zeta potential of −13.20 ± 0.30 mV. The particle size was similar to the TNCs (350.9 ± 8.84); however, the zeta potential was higher than that of TNCs (−28.11 ± 0.62 mV). In a combination of electrostatic and steric stabilization, a minimum zeta potential of ±20 mV is desirable.41 Compared to the E5NCs (zeta potential of −13.2 ± 0.3 mV), the high electrostatic repulsion resulting from the high surface charge density of the TNCs was beneficial for the excellent dispersibility and stability the of nanocrystals. The nanocrystals with the optimized formulation were prepared and used for subsequent characterization and evaluation. Table 2 presents the prescription of TNCs and E5NCs.

Table 2 The prescription of TNCs and E5NCs. (mean ± SD, n = 3)a
Formulation (4% w/v drug) HPMCE5 (% w/v) TPGS (% w/v) SDS (% w/v) Protecting agent Drug loading efficiency (% w/w)
a Drug loading efficiency (%) = (amount of the AND encapsulated in NCs/weight of the NCs).
HPMC E5–SDS 0.5   0.1 3% mannitol 46.15 ± 2.07
TPGS–SDS   0.5 0.1 45.84 ± 3.11


3.3. Shapes and morphology

The TEM and SEM micrographs of TNCs and E5NCs are shown in Fig. 3. Irregular drug crystals in the formulations have been observed in the TEM images, which are consistent with the SEM images. The sizes of the nanocrystals measured by TEM and SEM were identical to the results obtained from the laser diffraction.
image file: c6ra16002f-f3.tif
Fig. 3 TEM micrographs of E5NCs (a) and TNCs (b) and SEM micrographs of E5NCs (c) and TNCs (d).

3.4. DSC

DSC is a suitable method to demonstrate compatibility and provides a great deal of information about possible interactions between drugs and excipients. As shown in Fig. 4, an endothermic peak was found at ∼230 °C for the crude AND and the physical mixture, indicative of its anhydrous and crystalline state, while the endothermic peaks were lower for TNCs (219.00 °C) and E5NCs (216.67 °C), indicating that no crystalline state transition occurred during the process of wet milling. The endothermic peaks shifted slightly to a lower value and were broadened, possibly due to a significant particle size reduction, which increased the surface Gibbs free energy according to the Gibbs–Thomson equation.42 The endothermic peak of mannitol and freeze-dried mannitol indicated that the crystal structure of mannitol had changed.
image file: c6ra16002f-f4.tif
Fig. 4 DSC patterns for andrographolide (a), mannitol (b), freeze-dried mannitol (c), physical mixtures of AND/HPMC E5 (d), physical mixtures of AND/TPGS (e), freeze-dried nanocrystals of AND/HPMC E5 (f), freeze-dried nanocrystals of AND/TPGS (g).

3.5. PXRD

The PXRD diffractograms are shown in Fig. 5. The characteristic peaks of AND in the nanocrystals were nearly identical to that of the crude AND. The crystalline state was not altered during the wet-milled nanocrystals preparation, in agreement with the results of DSC. Meanwhile, the PXRD patterns of mannitol and freeze-dried mannitol showed that the crystal structure of mannitol changed, which is consistent with the DSC results. Moreover, the reduction in diffraction intensity was chiefly attributed to the encapsulation of TPGS and HPMC E5 on the surface of the AND particles when dried, and secondly, due to the dilution of TPGS and HPMC E5.43
image file: c6ra16002f-f5.tif
Fig. 5 PXRD patterns for andrographolide (a), mannitol (b), freeze-dried mannitol (c), physical mixtures of AND/HPMC E5 (d), physical mixtures of AND/TPGS (e), freeze-dried nanocrystals of AND/HPMC E5 (f), freeze-dried nanocrystals of AND/TPGS (g).

3.6. IR

As demonstrated in Fig. 6, the FTIR spectral patterns of crude AND and AND nanocrystals show that the chemical structure of AND was not altered, which signifies that the AND was compatible with the stabilizers employed in the study during the process of preparing the nanocrystals.
image file: c6ra16002f-f6.tif
Fig. 6 FT-IR spectra of raw AND (a), blank excipients of AND/HPMC E5 (b), blank excipients of AND/TPGS (c), physical mixtures of AND/HPMC E5 (d), physical mixtures of AND/TPGS (e), freeze-dried nanocrystals of AND/HPMC E5 (f), freeze-dried nanocrystals of AND/TPGS (g).

3.7. Short-term physical stability

The short-term stability of the AND nanocrystals at 4 °C and 25 °C were investigated to evaluate whether the nanocrystals were sufficiently stable for further study. As presented in Fig. 7, the two formulations were stable and there were no significant changes in the mean sizes and PDI at 4 °C and 25 °C, respectively, in one month. As mentioned above, the electrostatic and steric repulsive forces between the nanocrystals generated by the binary stabilizer system were able to stop the aggregation of the nanocrystals.
image file: c6ra16002f-f7.tif
Fig. 7 Changes of Z-average (nm) and PDI of TNCs and E5NCs stored at 4 °C (left) and 25 °C (right), monitored by DLS (mean ± SD, n = 3).

3.8. Dissolution

Fig. 8 presents the different dissolution behaviors of the AND nanocrystals and physical mixtures, commercial AND dripping pills and coarse AND. In contrast to crude AND, both self-made nanocrystals and dripping pills could enhance the dissolution rate. Actually, it was not difficult to find that much faster dissolution rates and higher cumulative dissolution were obtained by nanocrystals. The dissolution of raw AND within 60 min was below 45% in four different dissolution mediums. Though the dissolution for commercial AND dripping pills was enhanced, it remained below 65% and was less than for AND nanocrystals. The dissolution of TNCs in 60 min exceeded 90% in any dissolution medium and it was no less than 80% within the first 10 min, which indicated that the dissolution rate improved greatly. However, the dissolution of E5NCs was inferior to the TNCs, not only in dissolution rate, but also in cumulative dissolution in any dissolution media. It is worth noting that the dissolution of the physical mixture of AND/HPMC E5 was below that of the pure AND in about 20 min, in four different media; this might due to the swelling of HPMC E5, which hindered the release of AND.44 Interestingly, the same phenomenon happened to E5NCs. It is noteworthy that the dissolution performances of AND in four different media were alike and no significant difference was noted among them. The dissolution of AND was independent of the medium pH; pure water was chosen as an ideal dissolution medium, for convenience.
image file: c6ra16002f-f8.tif
Fig. 8 Dissolution profiles in (a) pH = 1.2 (b) pH = 4.5 (c) pH = 6.8 (d) purified water for raw AND, TNCs, E5NCs, AND/TPGS physical mixtures, AND/HPMC E5 physical mixtures and commercial dripping pills (mean ± SD, n = 3).

To find out the reasons for the different dissolution behaviors of the two nanocrystals, we studied the effects of excipients on dissolution because they were formulated with different stabilizers. TPGS has an amphiphilic structure composed of a lipophilic alkyl tail and hydrophilic polar head groups with a HLB value of 13.2 and a critical micelle concentration (CMC) of 0.02%.45 TPGS is a non-ionic surfactant that can form micelles, which can enhance the dissolution of drugs by itself in this study. However, HPMC E5, a semisynthetic polymer, has a hydrophobic alkyl chain, as well as hydrophilic hydroxyl groups in its side chain. Upon HPMC E5 contact with the dissolution media, they firstly hydrate slowly, then swell and form a thick gel layer at the nanocrystal surface, which is responsible for limiting the drug release rate.44 It is clear that TPGS has advantages over HPMC E5 as a stabilizer, for enhancing dissolution.

3.9. SPIP study

The Peff and Ka obtained in the SPIP study are demonstrated in Fig. 9. A significant increase in the absorption parameters of AND was found on perfusion of AND with TPGS in comparison to AND solution in the duodenum, which might be ascribed to the impact of TPGS; as covered in the literature, lower doses of the surfactant could enhance the absorption of a water-insoluble drug by altering the membrane.46 In the duodenum and jejunum, there were significant differences between TNCs and E5NCs, indicating that apart from the impact of nanocrystals, TPGS could promote the absorption of AND, which was in complete corroboration with the results of AND with TPGS. Furthermore, it deserves to be mentioned that AND was mainly absorbed in the duodenum and jejunum and in both sites, the absorption of TNCs was superior to E5NCs. Significant differences in the ileum and colon were observed for the permeability of AND, with and without TPGS solution; the reason might be that TPGS could act as a P-gp inhibitor in the ileum and colon.47,48 The Ka and Peff of TNCs and E5NCs were significantly higher than AND solution in the ileum and colon, indicating that nanocrystals could facilitate cellular uptake. This phenomenon might be due to nanocrystals being directly absorbed by the cells, leading to much higher Ka and Peff.49
image file: c6ra16002f-f9.tif
Fig. 9 Comparison of Peff and Ka for different forms of andrographolide in rat intestines in situ (mean ± SD, n = 3). Statistically significant differences (p < 0.05) between regions are shown by the asterisks (*).

3.10. Bioavailability study

A study was carried out involving a comparison of the pharmacokinetic profiles of AND in the form of nanocrystals and the un-milled suspension of nanocrystals. Fig. 10 shows the mean plasma concentration–time curves of AND after a single oral administration of different formulations of AND. The pharmacokinetic parameters are presented in Table 3. A pharmacokinetic investigation of the un-milled suspension was executed and the results were compared to evaluate the various impacts of TPGS and HPMC E5 on AND oral bioavailability, regardless of the roles of particle size. There were significant differences (P < 0.05) concerning AUC0–24h between AND/HPMC E5 coarse suspension (AUC0–24h: 9903.84 ng (mL min)−1) and AND/TPGS coarse suspension (AUC0–24h: 14[thin space (1/6-em)]053.78 ng (mL min)−1). Compared to the AND/HPMC E5 coarse suspension, the higher AUC0–24h and the shorter Tmax of the AND/TPGS coarse suspension indicated that the TPGS could promote the absorption of AND. Furthermore, the t1/2 of TNCs was prolonged 2.4-fold, compared to the AND/HPMC E5 coarse suspension. This may be ascribed to the fact that TPGS could form micelles, which increased solubilization of AND and also interacted with P-gp in the ileum and colon.50
image file: c6ra16002f-f10.tif
Fig. 10 Plasma concentration–time curves of AND/HPMC E5 coarse suspension, AND/TPGS coarse suspension, TNCs and E5NCs, following oral administration in a single dose of 120 mg kg−1 of AND in rats (mean ± S.E., n = 5).
Table 3 Pharmacokinetic parameters following oral administration of AND/HPMC E5 coarse suspension, AND/TPGS coarse suspension, TNCs, E5NCs and in a single dose of 120 mg kg−1 in rats (mean ± S.E., n = 5)a
Pharmacokinetic parameters AND/HPMC E5 coarse suspension AND/TPGS coarse suspension TNCs E5NCs
a p < 0.05 (*) versus AND/HPMC E5 coarse suspension as the control, and p < 0.05 (**) versus E5NCs as the control.
Cmax (ng mL−1) 46.54 ± 12.45 48.88 ± 5.48 207.68 ± 25.49 168.48 ± 33.24
tmax (min) 70.00 ± 30.62 20.00 ± 6.12 50.00 ± 24.49 26.67 ± 14.29
t1/2 (min) 119.88 ± 39.73 291.44 ± 49.25 261.73 ± 68.58 205.35 ± 61.12
K (min−1) 0.08 ± 0.04 0.04 ± 0.02 0.03 ± 0.02 0.08 ± 0.04
AUC0–24 (ng min mL−1) 9903.84 ± 204.41* 14[thin space (1/6-em)]053.78 ± 1770.90* 44[thin space (1/6-em)]418.36 ± 4234.91** 26[thin space (1/6-em)]160.083 ± 1940.49**


Significant differences were discovered between the un-milled suspension of AND and the AND nanocrystals (p < 0.05). Therefore, it is reasonable to conclude that the AND nanocrystals could significantly increase the oral absorption of AND. The Noyes–Whitney formula could be used to interpret the mechanism responsible for the higher rate and extent of drug absorption. As per this formula, the formation of nano-sized drug crystals resulted in an increase in the surface area and dissolution rate. As we know, the limiting factor in the absorption of AND is not only the lower dissolution, but also the extensive metabolism and efflux by P-gp. Increasing the dissolution rate to keep most of the drug soluble during the GI transit will help to improve the bioavailability.21 The high concentration gradient between the nanocrystals and the GI epithelium produced by rapid drug dissolution could decrease the extensive metabolism and subsequently increase the bioavailability of AND.51

Interestingly, a statistically significant difference was observed in the AUC0–24h for TNCs and E5NCs. The superiority in the bioavailability of TNCs was in accordance with the results of the effect of TPGS in the dissolution and SPIP. Since TNCs dissolve faster than E5NCs, the dissolved AND may saturate the enzymes in the gut and liver. Therefore, the extra AND molecules were not metabolized, leading to higher plasma concentrations and oral bioavailability than E5NCs.52 Another factor that must be considered is, as the SPIP results displayed, that TPGS could facilitate cellular uptake and could act as a P-gp inhibitor. This results proved convincingly that TPGS was able to improve the bioavailability of AND by using the wet milling technique.

3.11. Therapeutic efficacy study

As shown in Fig. 11, pretreatment with the nanocrystals at dosages of 120 mg kg−1 significantly reduced ear swelling, compared to that of the saline-treated control (p < 0.05). Compared to the AND coarse suspension (ear tumefaction inhibitory rate was 24.85%), the nanocrystals significantly weakened the symptoms of acute inflammation in mice induced by xylene, including ear redness, swelling, and other symptoms; the TNCs and E5NCs inhibited xylene induced ear swelling by 59.98 and 48.06%, respectively. Significant differences were discovered between the E5NCs and the TNCs (p < 0.05), which might be due to the impact of TPGS.
image file: c6ra16002f-f11.tif
Fig. 11 Effects of different forms of AND on xylene-induced ear swelling. Data are expressed as the mean ± SD (n = 10) and were analyzed using one-way ANOVA with the post hoc test. *P < 0.05 compared to the model groups; #P < 0.05 compared to the E5NCs.

4. Conclusion

In summary, in the present study, for the first time, we successfully prepared AND nanocrystals by the wet milling method, with two different potential stabilizers, HPMC E5 and TPGS, as well as provided evidence for TNCs participation in enhancing the oral administration of AND. The PXRD and DSC studies confirmed the retention of crystallinity and the SEM and TEM images indicated that the two nanocrystals shared similar morphology and size. The two nanocrystals were physically stable at 4 °C and 25 °C, respectively, for at least 1 month. The dissolution results showed that TNCs were superior to E5NCs. The consequence of the SPIP study indicated that TPGS could facilitate the intestine absorption of AND and might serve as a P-gp inhibitor. On account of the consequence of the dissolution and SPIP, we could conclude that TPGS has greater advantages in the preparation of AND nanocrystals. Significant differences in the AUC0–24h were discovered on oral administration of TNCs, in comparison to E5NCs. Compared to the model group, the TNCs and E5NCs inhibited xylene induced ear swelling by 59.98 and 48.06%. In view of the above-mentioned results, TNCs might be viewed as reasonable, brief, economical and promising formulations to enhance the in vitro and in vivo behaviors of AND.

Conflict of interest

The authors declare that they have no conflict of interest.

Acknowledgements

The authors would like to be deeply grateful to the Analytical department of Shenyang Pharmaceutical University. The authors also thank for Animal center of Shenyang Pharmaceutical University for providing healthy rats.

References

  1. K. Maiti, A. Gantait, K. Mukherjee, B. P. Saha and P. K. Mukherjee, J. Nat. Rem., 2006, 6, 1–13 CAS .
  2. W. Li, X. Nan, X. Chen, Y. Li, H. Yi, Y. J. Liu and Z. Z. Wang, Eur. J. Pharmacol., 2014, 740, 421–427 CrossRef PubMed .
  3. Z. Bao, S. Guan, C. Cheng, S. Wu, S. H. Wong, D. M. Kemeny, B. P. Leung and W. S. Wong, Am. J. Respir. Crit. Care Med., 2009, 179, 657–665 CrossRef CAS PubMed .
  4. J. Sinha, S. Mukhopadhyay, N. Das and M. K. Basu, Drug Delivery, 2000, 7, 209–213 CrossRef CAS PubMed .
  5. S. Rajagopal, R. A. Kumar, D. S. Deevi, C. Satyanarayana and R. Rajagopalan, J. Exp. Ther. Oncol., 2003, 3, 147–158 CrossRef CAS PubMed .
  6. B. C. Yu, C. R. Hung, W. C. Chen and J. T. Cheng, Planta Med., 2003, 69, 1075–1079 CrossRef CAS PubMed .
  7. J. H. Hsu, S. S. Liou, B. C. Yu, J. T. Cheng and Y. C. Wu, Planta Med., 2004, 70, 1230–1233 CrossRef CAS PubMed .
  8. X. B. Suo, H. Zhang and Y. Q. Wang, Biomed. Chromatogr., 2007, 21, 730–734 CrossRef CAS PubMed .
  9. Y. S. Tu, D. M. Sun, J. J. Zhang, Z. Q. Jiang, Y. X. Chen, X. H. Zeng, D. E. Huang and N. Yao, J. Microencapsulation, 2014, 31, 307–316 CrossRef CAS PubMed .
  10. B. Chellampillai and A. P. Pawar, Eur. J. Drug Metab. Pharmacokinet., 2011, 35, 123–129 CrossRef CAS PubMed .
  11. C. Bothiraja, A. P. Pawar, K. S. Shaikh and P. Sher, Nanosci. Nanotechnol. Lett., 2009, 1, 156–164 CrossRef CAS .
  12. H. Du, X. Yang, H. Li, L. Han, X. Li, X. Dong, Q. Zhu, M. Ye, Q. Feng and X. Niu, J. Microencapsulation, 2012, 29, 657–665 CrossRef CAS PubMed .
  13. Y. Gu, J. Ma, Y. Liu, C. Bo and S. Yao, J. Chromatogr. B: Anal. Technol. Biomed. Life Sci., 2007, 854, 328–331 CrossRef CAS PubMed .
  14. L. Ye, T. Wang, L. Tang, W. Liu, Z. Yang, J. Zhou, Z. Zheng, Z. Cai, M. Hu and Z. Liu, J. Pharm. Sci., 2011, 100, 5007–5017 CrossRef CAS PubMed .
  15. C. Bothiraja, M. B. Shinde, S. Rajalakshmi and A. P. Pawar, J. Pharm. Pharmacol., 2009, 61, 1465–1472 CrossRef CAS PubMed .
  16. R. L. Qiu, L. I. Lin, L. I. Xiang, H. X. Zhang and J. W. Chen, J. Chin. Integr. Med., 2004, 2, 456–458 CrossRef CAS PubMed .
  17. T. Yang, H. H. Sheng, N. P. Feng, H. Wei, Z. T. Wang and C. H. Wang, J. Pharm. Sci., 2013, 102, 4414–4425 CrossRef CAS PubMed .
  18. Y. Jiang, W. Fang, X. Hui, L. Hui, Q. Meng and W. Liu, Int. J. Pharm., 2014, 475, 475–484 CrossRef CAS PubMed .
  19. N. Sermkaew, W. Ketjinda, P. Boonme, N. Phadoongsombut and R. Wiwattanapatapee, Eur. J. Pharm. Sci., 2013, 50, 459–466 CrossRef CAS PubMed .
  20. C. M. Keck and R. H. Müller, Eur. J. Pharm. Biopharm., 2006, 62, 3–16 CrossRef CAS PubMed .
  21. B. Sinha, R. H. Müller and J. P. Möschwitzer, Int. J. Pharm., 2013, 453, 126–141 CrossRef CAS PubMed .
  22. E. Merisko-Liversidge, G. G. Liversidge and E. R. Cooper, Eur. J. Pharm. Sci., 2003, 18, 113–120 CrossRef CAS PubMed .
  23. Y. Wang, D. Zhang, Z. Liu, G. Liu, C. Duan, L. Jia, F. Feng, X. Zhang, Y. Shi and Q. Zhang, Nanotechnology, 2010, 21, 155104–155115 CrossRef PubMed .
  24. E. Merisko-Liversidge and G. G. Liversidge, Adv. Drug Delivery Rev., 2011, 63, 427–440 CrossRef CAS PubMed .
  25. B. V. Eerdenbrugh, G. V. D. Mooter and P. Augustijns, Int. J. Pharm., 2008, 364, 64–75 CrossRef PubMed .
  26. S. Gahoi, G. K. Jain, R. Tripathi, S. K. Pandey, M. Anwar, M. H. Warsi, M. Singhal, R. K. Khar and F. J. Ahmad, Colloids Surf., B, 2012, 95, 16–22 CrossRef CAS PubMed .
  27. S. Ganta, J. W. Paxton, B. C. Baguley and S. Garg, Int. J. Pharm., 2009, 367, 179–186 CrossRef CAS PubMed .
  28. K. Peters, J. Antimicrob. Chemother., 2000, 45, 77–83 CrossRef CAS PubMed .
  29. Q. Fu, J. Sun, X. Ai, P. Zhang, M. Li, Y. Wang, X. Liu, Y. Sun, X. Sui and L. Sun, Int. J. Pharm., 2013, 448, 290–297 CrossRef CAS PubMed .
  30. M. G. Traber, T. D. Schiano, A. C. Steephen, H. J. Kayden and M. Shike, Am. J. Clin. Nutr., 1994, 59, 1270–1274 CAS .
  31. Y. Guo, J. Luo, S. Tan, B. O. Otieno and Z. Zhang, Eur. J. Pharm. Sci., 2013, 49, 175–186 CrossRef CAS PubMed .
  32. Z. Zhang, S. Tan and S. S. Feng, Biomaterials, 2012, 33, 4889–4906 CrossRef CAS PubMed .
  33. M. Li, L. Si, H. Pan, A. K. Rabba, Y. Fang, J. Qiu and G. Li, Int. J. Pharm., 2011, 403, 37–45 CrossRef CAS PubMed .
  34. Z. Zhang, C. Yan, D. Jin, X. Jia, J. Zhou and H. Lv, Int. J. Pharm., 2014, 465, 306–316 CrossRef CAS PubMed .
  35. J. Chao, W.-H. Peng, M.-S. Lee, L.-H. Pao and H.-Y. Cheng, Int. J. Mol. Sci., 2013, 14, 2928–2945 CrossRef CAS PubMed .
  36. Y. Yang, S. J. Jin, H. L. Wang, Y. X. Li, J. Du, R. Zhou, J. Zheng, L. Ma, C. J. Zhao and Y. Niu, Scand. J. Pain, 2015, 8, 28–34 CrossRef .
  37. D. Cheng, Y. Zhang, D. Gao and H. Zhang, J. Ethnopharmacol., 2014, 155, 1300–1305 CrossRef PubMed .
  38. B. V. Eerdenbrugh, J. Vermant, J. A. Martens, L. Froyen, J. V. Humbeeck, P. Augustijns and G. V. D. Mooter, J. Pharm. Sci., 2009, 98, 2091–2103 CrossRef PubMed .
  39. A. M. Cerdeira, M. Mazzotti and B. Gander, Int. J. Pharm., 2010, 396, 210–218 CrossRef CAS PubMed .
  40. K. M. R. Srivalli and B. Mishra, Colloids Surf., B, 2015, 135, 756–764 CrossRef CAS PubMed .
  41. J. Pardeike and R. H. Müller, Int. J. Pharm., 2010, 391, 322–329 CrossRef CAS PubMed .
  42. C. L. Jackson and G. B. Mckenna, J. Chem. Phys., 1990, 93, 9002–9011 CrossRef CAS .
  43. C. X. Huang, J. B. Li, M. Y. Lei, H. B. Du and X. Z. Yang, Key Eng. Mater., 2005, 280–283, 545–548 CAS .
  44. S. Conti, L. Maggi, L. Segale, E. O. Machiste, U. Conte, P. Grenier and G. Vergnault, Int. J. Pharm., 2007, 333, 143–151 CrossRef CAS PubMed .
  45. M. R. Vijayakumar, K. Y. Vajanthri, S. K. Mahto, N. Mishra, M. S. Muthu and S. Singh, Colloids Surf., B, 2016, 145, 479–491 CrossRef CAS PubMed .
  46. B. J. Aungst, J. Pharm. Sci., 2000, 89, 429–442 CrossRef CAS PubMed .
  47. M. R. Vijayakumar, L. Kumari, K. K. Patel, P. R. Vuddanda, K. Y. Vajanthri, S. K. Mahto and S. Singh, RSC Adv., 2016, 6, 50336–50348 RSC .
  48. L. Gao, G. Liu, J. Ma, X. Wang, F. Wang, H. Wang and J. Sun, Colloids Surf., B, 2014, 117, 122–127 CrossRef CAS PubMed .
  49. P. Jani, G. W. Halbert, J. Langridge and A. T. Florence, J. Pharm. Pharmacol., 1991, 42, 821–826 CrossRef .
  50. M. V. S. Varma and R. Panchagnula, Eur. J. Pharm. Sci., 2005, 25, 445–453 CrossRef CAS PubMed .
  51. Z. Yu, H. Xi, X. Liu, D. Yu, D. Di, Y. Tian, Z. Shu and T. Xing, Int. J. Pharm., 2015, 493, 214–223 CrossRef PubMed .
  52. H. Higashino, T. Hasegawa, M. Yamamoto, R. Matsui, Y. Masaoka, M. Kataoka, S. Sakuma and S. Yamashita, Mol. Pharm., 2014, 11, 746–754 CrossRef CAS PubMed .

Footnote

Electronic supplementary information (ESI) available. See DOI: 10.1039/c6ra16002f

This journal is © The Royal Society of Chemistry 2016