A. Convertino*a,
L. Maioloa,
V. Scuderib,
A. Di Maurob,
M. Scuderic,
G. Nicotrac,
G. Impellizzerib,
G. Fortunatoc and
V. Priviterab
aCNR-IMM, Via del Fosso del Cavaliere 100, I-00133 Rome, Italy. E-mail: annalisa.convertino@cnr.it
bCNR-IMM, Via S. Sofia 64, I-95123 Catania, Italy
cCNR-IMM, Z.I. VIII Strada 5, I-95121 Catania, Italy
First published on 19th September 2016
We propose a highly disordered and randomly oriented array (forest) of SiO2 nanowires (NWs) coated by a thin film of TiO2 as a performing photocatalytic material for water treatment applications. The SiO2 NWs with a length of tens of microns were obtained via thermal oxidation of Si NWs, grown by plasma enhanced chemical vapour deposition (PECVD), and covered by a nanometric TiO2 film deposited by atomic layer deposition (ALD). The remarkable photocatalytic performance of the TiO2/SiO2 NWs was demonstrated by the degradation of methylene blue and phenols in water. The enhanced photocatalytic activity in the overlaying TiO2 film is attributed to the synergetic effect of the morphology and optical properties of the SiO2 NWs. The fabrication methods based on the well-established Si technology make the proposed materials a promising strategy for water treatment.
In order to overcome these problems, recent investigations are oriented toward the immobilization of the TiO2 in the form of thin films with a thickness of a few nanometers useful to provide surface charge carriers for photoreactions.12–15 However the limiting factor in this approach is the low amount of light absorbed in the TiO2 films.
In this work we propose a highly disordered and randomly oriented array (i.e. forest) of SiO2 nanowires (NWs) as three-dimensional (3D) support for a TiO2 thin film. The idea is to exploit the morphological and optical properties of a SiO2 NW forest to enhance the photocatalytic efficiency of the TiO2 film. The nano-structuration imparted by the NWs to the overlaying TiO2 film provides a large surface area, thus enhancing the amount of photo-generated charges responsible for water purification reactions. In addition, the SiO2 NW forest provides efficient light absorption in the semiconductor catalyst because of strong light scattering.16–19 As sketched in Fig. 1, the light passing through a NW forest undergoes multiple scattering events. The scattering events fold the light path many times in a random walk inside the NW forest increasing the effective absorption, with a consequent reduction of the reflectivity at the frequencies absorbed by the composite NWs, i.e. light trapping. The TiO2 layer benefits from the light trapping since the SiO2 NWs are transparent in the UV/Vis range. As such, the overlaying TiO2 film captures and absorbs significantly more photons than an equivalent planar thin film and all the TiO2 surface can contribute to light absorption without shadowing problems. Similar strategies have found successful applications in photovoltaic energy conversion20–22 and more recently in refractive index sensors.23,24 Here we propose to extend the potential benefits of the light trapping at the TiO2 absorption spectral range to water applications. Furthermore, this approach provides a scalable technology for water treatment. Indeed, (i) the NW forest fabrication procedure is based on well-established Si technology, fully integrated in industrial processes; (ii) there are effective techniques to remove the NWs from the substrate and transfer them onto non-conventional supports,25,26 such as polymeric films, useful to coat the walls of water containers; (iii) the material architecture prevents nanomaterial being released into the environment.
To show the potential of this approach we fabricated a disordered array of SiO2 NWs via thermal oxidation of Si NWs grown by plasma enhanced chemical vapour deposition (PECVD) on a Si wafer. The SiO2 NWs, tens of microns long, where then covered by about 10 nm of TiO2 deposited by atomic layer deposition (ALD). Since ALD is intrinsically atomic, it allows the deposition of conformal films of high aspect ratio structures and a controlled thickness.27,28 A complete structural and morphological characterization was performed with scanning electron microscopy (SEM), transmission electron microscopy (TEM) and Raman spectroscopy. The optical properties of the TiO2/SiO2 NWs were investigated by UV/Vis spectrophotometer measurements. The photocatalytic performance of the TiO2/SiO2 NWs was demonstrated by the degradation of methylene blue (MB) dye and phenols in water.
The composition analysis of the oxidized NWs was performed by Raman spectroscopy. Raman spectra were acquired with a DXR Thermo Fisher Scientific Raman Microscope, by exciting the samples at 532 nm with a 10 mW power and a 100× objective. The measured spectral range was 50–3000 cm−1, and each spectrum resulted from 2 s acquisition and 200 accumulations over an area of about 800 nm (laser spot).
The structural characterization was performed by SEM and TEM. SEM analyses were performed by using a field emission Zeiss Supra 25 microscope. TEM analyses were performed by using a JEOL JEM ARM200CF at a primary beam energy of 200 keV, operated both in conventional TEM mode (C-TEM) and in scanning mode (S-TEM) and equipped with a large angle silicon drift detector (SDD) energy dispersive X-ray (EDS) detector. TiO2/SiO2 NWs were transferred onto a copper–carbon TEM grid by mechanical rubbing.
The optical properties were studied by measuring the angle integrated total reflectivity in the spectral range between 200 and 1100 nm with a Perkin-Elmer Lambda 35 UV/Vis spectrophotometer equipped with an integrating sphere.
The photocatalytic activity was evaluated by the degradation of the MB organic compound. The samples, 1 cm × 1 cm in size, were immersed in a solution (2 ml) containing MB and de-ionized water with an initial concentration of 1.5 × 10⁻⁵ M. The mixture was irradiated by using a UV lamp (Philips F8T5BLB-8W), peaked at 365 nm with a full width at half maximum of 20 nm and irradiance of 2 mW cm−2, for a total time of 3.5 hours. Every 30 minutes of irradiation the solution was measured using a UV/VIS spectrophotometer (PerkinElmer Lambda 45) in a wavelength range between 500 and 800 nm. The temperature of the solution was tracked with a thermocouple. During the tests, the measured values are comparable with the room temperature.
The photocatalytic activity of TiO2/SiO2 NWs was also tested for the degradation of phenols (purchased by Sigma Aldrich) with an initial concentration of 1.38 mg l−1 (in de-ionized water) using the same procedure with the degradation of MB. The variation of the concentration of the phenol solution was measured spectrophotometrically using a Hatch DR 3900 spectrophotometer.
![]() | ||
| Fig. 2 (a) Photograph of SiO2 NW forest on a 3 inch Si wafer. (b) Raman spectra of the oxidized NWs (red line) and Si substrate (black line). (c) and (d) Plan-view SEM images. | ||
In Fig. 2b the Raman spectra of the oxidized NWs and Si substrate are plotted. The oxidized NWs are characterized by the typical fused silica features such as the strong and diffused band at around 440 cm−1 with a weaker band near 880 cm−1 and the two sharp peaks at around 490 cm−1 and 606 cm−1.29 The sharp and strong peak at around 520 cm−1 is related to the contribution of the underlying crystalline Si30 substrate as clear by comparing the NW and substrate spectra. The SEM images in Fig. 2c and d reveal tens of micrometers long NWs, characterized by a tapered shape with bottom diameter in the range of 150–200 nm and tip diameter around 50–80 nm as determined by combined measurements from plan and cross view SEM. The SiO2 NWs are interwoven in a dense forest with a macroporous structure easily accessible to liquids such as water.
Fig. 3 reports TEM analyses on the SiO2 NWs after the deposition of TiO2. The bright field C-TEM image reported in Fig. 3a shows the excellent conformability of the TiO2 deposition thanks to the diffusion of the precursors inside the nanostructured SiO2 template. The thickness of the TiO2 coating was estimated to be 14 nm. In the inset, the elemental qualitative S-TEM EDS maps of a NW section show Ti, O and Si signals. While O and Si signals are localized within the nanowire and are proportional to thickness, Ti is clearly localized at the NW surface. The dark field C-TEM image reported in Fig. 3b highlights the TiO2 crystalline domains. The selected area electron diffraction (SAED) pattern, reported in the inset, shows discrete rings attributed to the polycrystalline anatase phase of the TiO2, since SiO2 is amorphous and produces only the diffuse halo around the central transmitted spot.
This result is in perfect agreement with what is reported in the literature for ALD deposition.31 The polycrystalline structure of the TiO2 coating is the same for both TiO2/SiO2 NWs and flat TiO2 reference film, as expected.
The optical behaviour of TiO2/SiO2 NWs was studied by measuring the total integrated reflectivity, R, between 200–900 nm and comparing it with that of two planar reference films consisting of TiO2 deposited on Si, which is the same bare substrate of the NWs, and quartz substrate. Both the films were characterized by the same thickness of the NW coating.
In Fig. 4 the spectra obtained from the TiO2/SiO2 NWs (continuous red line), the planar TiO2 film on Si (continuous blue line) and quartz (continuous green line) are plotted.
The planar TiO2 on Si shows R values around 35% in the Vis-IR and a continuous increase of R up to 60% for λ < 400 nm, where TiO2 is absorbing and the photocatalytic processes occur. The high reflectivity of the planar TiO2 for λ < 400 nm is not reduced if a low refractive index substrate is used as shown by the spectrum obtained from the same planar TiO2 film deposited on quartz.
The experimental spectra are well reproduced by the calculated ones (dashed red and green lines for TiO2 on Si and on quartz, respectively) obtained by using a program on the http://filmetrics.com web site.32 On this site, information about layered structures such as composition, refractive index, extinction coefficient and thickness can be used in the complex-matrix form of Fresnel equations to produce the simulated reflectance spectra. The calculations were obtained by considering a film thickness of 10 nm for both the planar TiO2 samples. The weak discrepancies observed between the experimental and calculated spectra are attributed to the fact that the optical constants used in the calculations are for the rutile TiO2 (the only option of Filmetrics) whereas our TiO2 is anatase.
The spectrum of the TiO2/SiO2 NWs is characterized by a strong diffusive reflectivity over Vis/IR range and a very weak reflectivity for λ < 400 nm where R strongly decreases down to 10%, a value much smaller than that observed for the planar films. It is worth highlighting that the drastic reduction of R occurs at a wavelength of 384 nm corresponding to the bulk TiO2 energy band gap in the anatase phase (3.2 eV).9 For comparison, the inset of Fig. 4 shows the R spectrum of the bare SiO2 NWs which is characterized by a strong reflectivity over the whole investigated range with values up to 80% in the UV range. This suggests that the strong reduction of R observed for the TiO2/SiO2 NWs in the UV is due to the TiO2 absorption of the incident light.
The optical behaviour of TiO2/SiO2 NWs can be described within the model of diffuse optical reflectors.16 In that model, the NWs are regarded as a discrete medium consisting of an ensemble of diffuse optical reflectors in air placed onto a partial reflecting substrate. The NWs can absorb, transmit, or reflect the incident light, and their reflectivity, R, is calculated by taking into account light scattering by individual NWs described in the Rayleigh approximation, absorption by the NWs, and substrate reflectivity. Under these conditions, R can be written as:16,18
![]() | (1) |
![]() | (2) |
![]() | (3) |
In our case, since the SiO2 NWs are transparent in the whole investigated spectral range, the calculations were performed by considering α and d of the TiO2 component. In Fig. 4 the calculated spectrum is plotted (dashed red line) and show a very good agreement by using the values of the crystalline anatase TiO2 absorption coefficient33 and the measured Rs as fixed parameters, whereas Nd = 7 × 10⁻³ cm and σw = 6 × 10⁻¹⁷ cm3 as fitting parameters. Hence, from our optical study a key feature can be highlighted: the presence of the SiO2 NWs allows the overlaying TiO2 film to absorb significantly more photons than an equivalent planar film which is affected by a high reflectivity in the spectral range where the photocatalytic processes occurs. In particular, by comparing the R spectra below λ = 384 nm, the nanostructured TiO2 absorbs about 40% of the light, that in the planar TiO2 film is completely lost due to reflection in that range.
In order to check the photocatalytic activity of the TiO2/SiO2 NWs in the degradation of organic compounds under UV light irradiation, we performed MB degradation measurements in water.13 The results were compared with that of the reference TiO2 planar film and that of TiO2/SiO2 NWs.
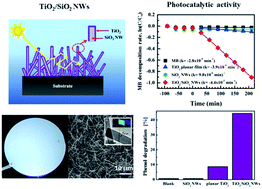
Fig. 5a reports the residual concentration of MB, C/C0, where C is the concentration of MB after the irradiation and C0 the starting concentration of MB, versus the irradiation time. We tested four samples: MB in absence of any catalyst materials (squares), with SiO2 NWs (circles), with TiO2 planar film (triangles), with TiO2/SiO2 NWs (diamonds). A preconditioning process was applied to remove possible adsorbed organic pollutants on the surfaces. In particular, samples were irradiated by the UV lamp for 50 min in order to remove the hydrocarbons localized on the sample surface. After the preconditioning process, samples were immersed in the MB solutions and kept in the dark for one hour and half. This step allowed disentangling the photocatalytic effect from the adsorption of MB on the sample surfaces and beaker walls.
After the MB adsorption step, the samples were exposed to UV light to induce the photocatalysis. The observed reaction rate, k, follows a Langmuir–Hinshelwood kinetics model, which can be expressed as follows:
![]() | (4) |
In order to demonstrate that the synthesized materials are active in the degradation of dangerous organic pollutants, the photocatalytic properties of TiO2/SiO2 NWs were tested for the degradation of phenols. The phenols are considered as priority pollutants since they are harmful for organisms at low concentrations and many of them have been classified as hazardous pollutants because of their potential to harm human health. The major sources of phenol pollution in the aquatic environment are wastewaters from paint, pesticides, coal conversion, polymeric resin, petroleum and petrochemical industries.34 Because of their toxicity, phenols have been included in the list of priority pollutants of US environmental protection agency (EPA) (Federal Register of US EPA, 1987). Also the EU has classified several phenols as priority contaminants and the 80/778/EC directive sets a maximum concentration of 0.5 mg l−1 for total phenols in drinking water.35
Fig. 6 reports the percentage of the phenol degradation after 150 min of irradiation under UV light. The photocatalytic response of the TiO2/SiO2 NWs samples were compared to the response of the phenol solution without any catalyst materials, with SiO2 NWs and with the reference TiO2 planar film. On the abscissa axis, ‘blank’ indicates a phenol solution in the absence of any catalysts. ‘Blank’ demonstrates a degraded phenol solution of 0.7%, the same percentage for the SiO2 NWs. The planar TiO2 shows a phenol degradation of 9%, whereas, the TiO2/SiO2 NWs were able to remove 45% of phenols present in the solution.
In both types of photocatalytic tests performed we observe improved performances for TiO2/SiO2 NWs.
The marked difference in the photocatalytic response between the TiO2/SiO2 NWs and the TiO2 planar film can be explained taking into account the significant enhancement of the TiO2 exposed surface and the more efficient collection of photons in the nanostructured sample. Eventually, we expect an improvement of performance by optimizing some key material features, including the NW size and density.
| This journal is © The Royal Society of Chemistry 2016 |