Promotion effects of Pd on tungsten carbide catalysts: physiochemical properties and cellulose conversion performance

Glauco F. Lealab, Silvia F. Moyaa, Debora M. Meiraac, Dean H. Barretta, Erico Teixeira-Netod, Antonio Aprígio S. Curvelobe, Victor Teixeira da Silvaf and Cristiane B. Rodella*a
aBrazilian Center for Research in Energy and Materials (CNPEM), Brazilian Synchrotron Light Laboratory (LNLS), C. P. 6192, 13083-970, Campinas, SP, Brazil. E-mail: cristiane.rodella@LNLS.br
bInstitute of Chemistry of São Carlos (IQSC)/University of São Paulo (USP), C. P. 780, CEP 13560-970, São Carlos, SP, Brazil
cEuropean Synchrotron Radiation Facility (ESRF), 71 Avenue des Martyrs, 38000 Grenoble, France
dCNPEM – Brazilian Nanotechnology National Laboratory (LNNano)-CNPEM, CP 6192, CEP 13083-970, Campinas, SP, Brazil
eCNPEM – Brazilian Bioethanol Science and Technology Laboratory (CTBE), C. P. 6192, 13083-970, Campinas, SP, Brazil
fUniversidade Federal do Rio de Janeiro/COPPE/Chemical Engineering Program/ NUCAT, P.O. Box 68502, Rio de Janeiro, RJ 21945-970, Brazil

Received 17th June 2016 , Accepted 2nd September 2016

First published on 6th September 2016


Abstract

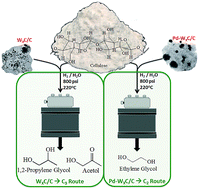
A multi-functional catalyst, which is able to perform both retro-aldol reactions followed by hydrogenation, is required to convert cellulose into value-added ethylene glycol (EG) in a one-pot reaction. Herein, we show the results of a catalyst comprising Pd-promoted tungsten carbide supported on activated carbon. Pd acts to hinder carbon deposition onto the catalyst surface during the carburization process, through the inhibition of methane decomposition species on the catalyst surface. XPS and TEM analysis show a cleaner surface which improves the W/C ratio. The enhanced interaction between Pd and W2C, results in higher cellulose conversions, and higher ethylene glycol (EG) yields when compared to non-promoted or Ni promoted tungsten carbide catalysts reported elsewhere. XAS, HR-TEM and SI-XEDS analysis showed Pd nanoparticles are well dispersed on the surface and in contact with W2C. Despite higher carburization temperatures, Pd-promoted tungsten carbide catalysts enhance the catalytic properties of the one-pot cellulose conversion reaction towards EG production when compared to Ni-promoted catalysts under the same catalytic reaction conditions.

Introduction

Heterogeneous catalysts have been at the forefront of the chemical industry for over two centuries. These catalysts are now making an impact on the new emerging economy based on biomass conversion to produce bio-fuels and chemicals.1–9 Cellulose is the most abundant form of biomass and a key substrate in catalytic reactions and chemical processes that provide bio-based products.2,5,6,8–10 In the past 15 years, significant advances have been made in developing and understanding the correlation between cellulose processing and catalyst properties towards the efficient, profitable and environmentally friendly production of chemicals.2,8–12 Tungsten carbide catalysts supported on activated carbon have been shown to be a potential catalyst for low-cost and sustainable ethylene glycol (EG) production in one-pot cellulose conversion reactions. Many papers deal with cellulose transformation pathways using complex and multi-functional Ni-promoted tungsten carbide catalysts.13–19 However, only a few give insights into the structural, electronic and surface properties of these catalysts from catalyst preparation to the reaction steps. Our previous work,20 focused on the physical and chemical effects of Ni on tungsten carbide catalysts and revealed direct correlations between the metal promoter performance and the carburization process. The work showed an improvement in the Ni/W2C/C interaction which improved selectivity towards ethylene glycol. The highly dispersed Ni improved properties such as hydrogen spillover, lower carburization temperature and improved ability to perform retro-aldol reactions. The drawback however, was enhanced methane decomposition which deposits carbon on the catalyst surface and lowers the catalysts ability to convert cellulose.

Although noble metals are more costly than base metals they provide exceptional hydrogenation and retro-aldol properties in catalytic reactions involving biomass.2,10,12,21–25 Moreover, noble metals are less thermodynamically and kinetically active towards CHx (1 ≤ x ≤ 4) decomposition when compared to Ni.26–29 This characteristic is important in controlling carbon deposition during the carburization step during the catalyst synthesis. The use of a noble metal as a tungsten carbide promoter may offer a profitable balance amongst catalyst cost, physical and chemical properties and catalytic activity to obtain high value-added platform chemicals from cellulose. Thus, we turned our attention to the much less explored promoter Pd.30 Herein, our research strategy was to perform in situ X-ray diffraction (XRD), X-ray absorption spectroscopy (XAS) and mass spectroscopy analysis during the carburization processes as well as X-ray Photoelectron Spectroscopy (XPS), N2 physisorption, High Resolution Transmission Electron Microscopy (HR-TEM) and X-ray energy dispersive spectrum imaging (SI-XEDS) to provide a comprehensive insight into the structural, electronic and surface properties of the Pd-promoted tungsten carbide supported on activated carbon catalysts. In addition, the catalytic behavior was substantially investigated in one-pot cellulose conversion reactions for ethylene glycol production.

Experimental

Catalyst preparation

Tungsten and palladium impregnation on activated carbon was performed using a method previously reported.20 The Pd precursor (PdCl2 – Sigma-Aldrich) was dissolved in hot HCl (60 °C) under magnetic stirring due to the low solubility of PdCl2. The solution was then evaporated and water was added and stirred for 5 min followed by evaporation to remove the excess HCl. The final aqueous solution was prepared at room temperature and impregnated into the W/C sample to obtain 1 and 2 wt% Pd in the final composition.

The carburization process was carried out under a total flow of 100 mL min−1 using a mixture of CH4 (10% v/v) and H2 (90% v/v) from room temperature to 850 °C at a rate of 8 °C min−1 and held isothermally for 40 min. The CH4 flow was stopped after 20 min of isothermal treatment while maintaining the H2 flow during the final 20 min followed by cooling down to room temperature. The samples were then passivated under 1% (v/v) O2/He flow (50 mL min−1) overnight before exposure to the atmosphere. The gas phase composition at the exit of the reactor was continuously monitored using a quadrupole mass spectrometer (Pfeifer GDS 320). The samples were coded as WxC/C in the case of non-promoted tungsten carbide supported on carbon, 1Pd–W2C/C and 2Pd–W2C/C, promoted with 1 and 2 wt% of Pd, respectively.

XAS

X-ray absorption near-edge structure (XANES) and Extended X-ray Absorption Fine Structure (EXAFS) at the Pd K-edge (24[thin space (1/6-em)]350 eV) were carried out at BM23 at the European Synchrotron Radiation Facility (ESRF). Data was collected in fluorescence mode using a 13 element Ge detector. The samples were placed in quartz capillaries of 1.5 mm diameter. The catalysts were carburized in situ under CH4 (2 mL min−1) and H2 (18 mL min−1) up to 850 °C (10 °C min−1) and maintained at this temperature for 15 min. CH4 was then removed from the atmosphere and the catalysts were kept at 850 °C for an additional 10 min. The sample was then cooled down under hydrogen and three consecutive EXAFS spectra were collected and averaged for data analysis.

The EXAFS oscillations of two samples were analyzed: 1Pd–W2C/C and 2Pd–W2C/C. EXAFS oscillations were extracted using Athena code and analyzed using Artemis software.31 The range used to transform the EXAFS oscillations (k2χ(k)) was Δk = (3–8.5) Å−1 and the fits were performed in the interval ΔR = (1.5–3.2) Å.

The local environment of the Pd atoms was determined using the phase shift and amplitude functions for Pd–Pd calculated for Pd0. An additional Pd–W contribution was included to improve the fit. The calculation was done via randomly substituting 6 Pd atoms in the first coordination shell of the Pd0 structure by W. A test was also performed including Pd–C, Pd–O or Pd–Cl with the Pd–Pd contribution.

The photoelectron energy origin correction (ΔE0) and the passive electron amplitude reduction factor (S02) were found for Pd0 standard and used as fixed parameters to fit the samples. For each contribution, a coordination number (Ni) and a distance (Ri) were fitted independently while the mean square relative displacement (σi2) were set to be the same for all paths.

In situ XRD

The in situ XRD analysis measured during the carburization process was performed at the I11-High Resolution PXRD beamline at Diamond Light Source (UK) using a sapphire capillary cell, hot air blower and PSD detectors. The carburization was carried out under a total flow of 20 mL min−1 of 10% CH4/H2 gas mixture. The samples were heated to 999 °C using a heating rate of the 8 °C min−1 in order to determine the carburization temperature of each sample. The experiments were performed at 15 keV with 2θ ranging from 3–150°.

Ex situ XRD analyses were obtained at the XPD beamline at the Brazilian Synchrotron Light Laboratory (LNLS). A wavelength of 1.62551 Å was used and the XRD patterns were obtained via a Mythen – 1K detector (Dectris) installed 1 m from the sample. Identification of crystalline phases was obtained by comparison to the JCPDS files. The full width at half maximum (FWHM) of the peaks was determined using a pseudo-Voigt function with the crystal size for tungsten carbide phases estimated using the Scherrer equation.

XPS

X-ray Photoelectric Spectroscopy (XPS) measurements were performed at the LNLS using an electron analyzer SPECS, model Phoibos HSA-3500[thin space (1/6-em)]150, with Al Kα radiation (1486.61 eV), pass energy of 20 eV and 14 h acquisition. The powdered samples were supported on copper double-sided tape and fixed on the XPS sample holder. The spectra were analyzed using Casa XPS software, version 2.2.99. The binding energies were referenced to the C 1s line at 284.5 eV from carbon. The curve-fittings used in the deconvolution for W 4f, Pd 3d, O 1s and C 1s levels were Gaussian line shapes using the Shirley function in the background simulation. The quantitative evaluation of each peak was calculated by dividing the integrated areas under the peak by the atomic sensitivity factors considering 1.0 the sensitivity factor of C 1s (binding energy of the 284.5 eV).

HR-TEM and SI-XEDS

The morphology of the Pd–W2C/C crystallites was investigated by HR-TEM using a JEM 2100F microscope (JEOL) operated at 200 kV at the LNNano/CNPEM, with a point-to point resolution of 0.19 nm. Samples were prepared by applying the dry Pd–W2C/C powder onto a carbon film surface of standard 400 mesh TEM cooper grids. Catalyst compositional maps were acquired by XEDS-SI with an AZtec 3.0 SP2 (Oxford Instruments) system. Electron probe size of ca. 0.7 nm was used to guarantee enough current density at each sample point, in order to obtain statistically significant X-ray counts for the elements of interest. SIs were acquired by scanning an area of interest of the sample with a pixel size of ca. 0.5 nm and a total dwell time of 0.6 s per pixel. Complete XED-spectra were acquired at each SI pixel in the 0–20 keV energy range.

N2 physisorption

Surface area and pore volume were determined by adsorption–desorption isotherms of N2 at 77 K (−196 °C) using a Quantachrome Autosorb 1C automatic analyzer. The wet samples were degassed at 120 °C for 12 h before the isotherms were measured. The apparent BET surface area was determined by BET method using a multipoint method from the data collected at the relative pressures 0.1 ≤ P/P0 ≤ 0.25 due to the presence of micropores in the samples. The total pore volume was derived from the amount of gas adsorbed at a relative pressure of P/P0 = 0.95. The pore size distribution was determined using BJH method.32,33

Cellulose conversion reactions

The cellulose catalytic reactions were conducted using a stainless steel batch reactor (300 mL, Parr Instruments) at 4.3 MPa of H2, 150 mL of an aqueous suspension contend 1 g (dry basis) of cellulose (Avicel microcrystalline Merck) and 0.300 g of catalyst. Details of the catalytic reaction are reported elsewhere.20 The reactions were performed at 190, 220 and 250 °C and the reaction time varied from 0 to 180 min.

HPLC analysis were performed using a Waters 1525 chromatograph at the CTBE/CNPEM equipped with Aminex HPX-87H – Bio-rad capillary column and Acclaim 120C18 Dionex column for analysis using refractive index (RI) and UV detectors.

A quantitative method using thermogravimetric analysis (TGA) has been developed to determine the quantity of cellulose after a catalytic reaction, which was used to calculate cellulose conversion.34

Cellulose conversion (X) and product yield (PY) were determined according to the equations:

image file: c6ra15819f-t1.tif

image file: c6ra15819f-t2.tif
where CM(i) is the dry cellulose mass measured prior to the catalytic reaction, CM(f) is the dry cellulose mass measured after catalytic reaction, njCj is the amount of moles of carbon of identified product j (acetol, ethylene glycol, 1,2-propylene glycol, etc.), ncelC(i) is the amount of moles of carbon carried in the reactor.

Results and discussion

Characterization

XAS. XAS measurements were performed to investigate the local structure and oxidation state of Pd in the catalyst after the carburization under hydrogen flow. The Fourier transform (FT) of the EXAFS spectra at the Pd k-edge of the 1Pd–W2C/C and 2Pd–W2C/C samples are shown in the ESI material, Fig. S5. The EXAFS quantitative parameters derived from the fitting are presented in Table 1.
Table 1 EXAFS fit results for the first coordination shell of the Pd in the Pd-promoted tungsten carbide catalysts after the carburization process under H2 flowa
Sample NPd–Pdb NPd–Wb RPd–Pd (Å) RPd–W (Å) σPd–Pd/Pd–W22)
a E0 = 4, amp = 0.83.b High values in the errors of the coordination numbers are due to the high correlation between N and σ2.
1Pd–W2C/C 4 ± 2 3 ± 2 2.78 ± 0.01 2.91 ± 0.02 0.011 ± 0.005
2Pd–W2C/C 4 ± 3 3 ± 3 2.77 ± 0.04 2.90 ± 0.08


Both samples exhibited smaller coordination numbers (N) (Table 1) compared to Pd bulk (N = 12), indicating the presence of nanosized Pd particles. This is also reinforced by the high value obtained for the Debye–Waller factor (σ2), which is characteristic of high degree of disorder in the Pd lattice.

Interestingly, the EXAFS simulations for both samples improved when Pd–W contributions were added. This indicates that palladium nanoparticles are interacting with W in the catalyst. Moreover, an increase in the Pd–Pd interatomic distance (RPd–Pd) was observed compared to Pd0 (2.75 Å) (Table 1). This is in agreement with the presence of very small Pd particles, which are exposed to hydrogen.35 Palladium lattice expansion during thermal treatment under hydrogen has been reported35–39 and it likely in this case due to the final step of the carburization process at 850 °C under H2 flow.

The intensity of the XANES spectra of the 1Pd–W2C/C shows enhanced damping compared to the Pd0 foil in Fig. 1b. This shows structural disorder and/or nanosize structures, as already determined by EXAFS analysis (Fig. S6 and Table 1). Furthermore, theoretical calculations of the palladium electronic structure indicate that the increase in intensity of feature B is associated with the mixing of Pd d-states with hydrogen s- and p-unoccupied states.37 This may be associated with Pd nanoparticles and H2 interaction, as also pointed out by EXAFS analysis.


image file: c6ra15819f-f1.tif
Fig. 1 (a) Experimental XANES spectra of Pd0 and 1Pd–W2C/C sample and simulated XANES spectra of Pd–W and (b) corresponding second derivatives.

Feature A, at lower energy is assigned as a d-peak, associated with 1s → 4d transitions, giving rise to pre-edge features in the XANES spectra.40 Features B and C are assigned to p-peaks, which correspond to s → p transitions.40 The main feature (B) corresponds to the absorption edge and reflects dipole-allowed Pd 1s → 5p transitions. Peak (C) is associated with shakeup processes involving Pd 1s → 5p transitions or multiple scattering41 and also 5p → 4f transitions.36

Comparing the positions of feature B, the 1Pd–W2C/C catalyst coincides with the simulated Pd–W specie, agreeing with the presence of Pd nanoparticles in contact with W in the sample. Additionally, an energy reduction in feature C could point to a slightly increased electron density in the external orbitals of the Pd,36 which is related to the interaction of Pd and hydrogen.

XRD. In situ XRD analyses were conducted to investigate the influence of Pd on the carburization temperature, carbide phase formation and crystallinity of the samples.

In general, the carburization process follows the steps: WO3 → WOx (3 > x > 2) → WO2 → W → W2C → WC.20,42–45 The in situ XRD results showed the formation of metallic W at ≈561 °C and the carbide W2C phase transition occurring at ≈805 °C (Fig. 2). The W2C phase can clearly be identified as well as the peaks related to Pd species.


image file: c6ra15819f-f2.tif
Fig. 2 In situ carburization of Pd promoted tungsten carbide catalyst supported on activated carbon (2Pd–WxC/C). XRD patterns were collected at a wavelength, λ = 0.82656 Å.

In a previous work,20 in situ XRD analysis of the non-promoted tungsten carbide catalyst showed that metallic tungsten was formed at higher temperature (≈690 °C) with carbide formation happening at similar carburization temperature (≈850 °C). Moreover, a mixture of three nanosized carbide phases W2C, WC1−x, and WC were formed. However, when Ni was used as a promoter, the carburization temperature was reduced by 100 °C and much like the Pd-promoted catalysts studied here, only the W2C phase was formed.

XRD patterns of all samples after the carburization process at 850 °C are shown in Fig. 3. The predominant carbide phase in the promoted catalysts is W2C, while in absence of palladium, a mixture of carbide phases are formed. Nano-crystalline palladium is also formed during the carburization, corroborating with XAS results.


image file: c6ra15819f-f3.tif
Fig. 3 XRD analysis of (a) WxC/C; (b) 1Pd–W2C/C; (c) 2Pd–W2C/C. XRD patterns were collected at λ = 1.6255 Å.
XPS. The W 4f core–shell spectra of the catalysts are shown in Fig. S6. XPS analysis shows only tungsten oxide species on the surface of the Pd-promoted catalysts after the carburization and passivation. Only the non-promoted sample exhibits very small doublet peaks related to tungsten carbide species, which may indicate a thinner oxide layer on the surface of the catalyst.20

The XPS spectra in Fig. S7 shows the Pd 3d core-level spectra characterized by two components, Pd 3d5/2 and Pd 3d3/2, which appear due to spin-orbital splitting. The noise and weak signal can be related to the low Pd loading (1 and 2 wt%) and/or carbon deposition. The binding energies of the Pd 3d3/2 peaks around 336 and 336.7 eV, respectively, are related to palladium oxide species,46 which is in accordance with the carburization and passivation process applied in the catalysts synthesis.

The relative surface concentration was determined considering only the presence of W and C on the surface. The Pd loadings are lower than the detection limit of the XPS. According to quantitative XPS analysis (Table 2), a significant increase in the concentration of W on the surface is observed in both of the Pd-promoted tungsten carbides, which indicates that more tungsten was exposed on the surface in the promoted-catalysts in comparison with the non-promoted.

Table 2 Relative surface concentration between W and C determined by XPS analysis (±2% error)
Catalyst W/C ratio
WxC/C 0.028
1Pd–WxC/C 0.035
2Pd–WxC/C 0.038


HR-TEM and SI-XEDS analysis. Bright-field (BF) TEM images of the 2Pd–W2C/C catalyst revealed a bimodal distribution of particle sizes. BF-STEM images (Fig. 4A, C and D) show extensive regions with a large number of small particles (<10 nm), homogeneously distributed over the support, along with a second population of larger particles varying in size from 20 to 100 nm (Fig. 4A, B, and D). These large particles have a core–shell structure, with a dark core and a gray shell. The contrast of the HAADF image (Fig. 4E) is taken from the same area as Fig. 4D and has been inverted, revealing a particle structure with a high Z atomic number core surrounded by a lower Z shell. XEDS chemical mapping (Fig. 4F and S10) and HR-TEM images (Fig. S9) of the larger particles show a crystalline core enriched with W, which is surrounded by a shell formed by small crystallites giving a mixture of W and Pd. Interestingly, Pd was dispersed widely over the sample as well as W. Importantly, filamentous and/or graphitic carbon was not detected on the catalyst surface (Fig. S9).
image file: c6ra15819f-f4.tif
Fig. 4 Bright-filed STEM (A and D), BF-HR-TEM (B and C), HAADF-STEM (E) images and SI-XEDS chemical mapping (F) of the Pd-promoted tungsten carbide catalyst. Insert of figure (D) shows a low magnification BF image of a carbon grain, with the arrow indicating the central particle shown in higher magnification in (D).
N2 physisorption. Apparent BET surface area and pore volume values decreased with increasing Pd loading in the samples (Table 3). The mean pore diameter was the same for all samples. The adsorption–desorption isotherms are characteristic of materials comprising both micro and mesoporosity (Fig. S1) as expected for an activated carbon (70 wt% of the catalyst). However, the adsorption volume at low relative pressure (P/P0 ≤ 0.1), the pore size distribuition (ESI Fig. S2) as well as total adsorption capacity (P/P0 ≈ 1) decrease when Pd loading increases. This shows that the activated carbon and consequently the catalyst microporosity and surface are were affected by the carburization process of the tungsten.
Table 3 N2 physisorption analysis
Catalyst Apparent BET surface area (m2 g−1) Total pore volume (cm3 g−1) Mean pore diameter (Å)
WxC/C 649 0.577 38
1Pd–W2C/C 502 0.490 39
2Pd–W2C/C 366 0.340 38


There are two fundamental steps in the carburization process: (i) tungsten oxide reduction and (ii) tungsten carburization.13,16,20,42,43 Due to the hydrogen spillover ability exhibited by metals, such as Ni, Co, Pt and Pd the reduction of tungsten occurs at lower temperature when compared with non-promoted catalysts.13,16,18,20,42,43 The same trend was observed here, the in situ XRD analysis revealed that crystallites of metallic tungsten were formed around 561 °C in the 2Pd–WxC/C as well as our previous work with Ni-promoted catalysts.20 In the non-promoted catalyst case tungsten was only formed above 690 °C.20 Furthermore, besides the reduction step, the activated hydrogen should play a role in the second step of the carburization where it may interact with the carbon from the support and/or the CH4 to form CHx and C* species. These species are also formed through the thermodynamic decomposition of methane. According to Giraudon et al.,47 the species are adsorbed onto the W surface and carbon is inserted into the W lattice to produce the carbide phases.

Another factor to consider is the promoter interaction with CH4 and its effect on the carburization. Density functional theory (DFT) studies by Kai Li et al.,26 showed that CHx (1 ≤ x ≤ 4) decomposition is an endothermic process. Therefore, the reaction energy as well as the energy barrier is lower with Ni than that of Pd. Thus, the methane decomposition is thermodynamically and kinetically favoured in a Ni promoted catalyst. This explains the higher carburization temperature in the Pd-promoted tungsten carbide catalysts when compared to the Ni-promoted catalysts previously studied.20 The mass spectrometry results obtained during the carburization process (Fig. S4 and S5) also show an increase in CH4 production at 850 °C for the Pd-promoted and the non-promoted catalyst. The methane level at 850 °C is higher than its inlet flow at lower temperatures up to 400 °C. This implies that atomic carbon from the catalyst support (C*) may be interacting with H2 to form CH4 in the gas phase, which flows off the catalyst bed and consequently, from the catalyst surface. This result is confirmed by TEM (Fig. 4) and XPS results (Table 2), showing that the Pd and tungsten carbide particles are not covered by carbon with W being more exposed on the surface in the Pd-promoted catalysts. The results indicate that the main carbon source in the carburization process of the Pd-promoted catalysts is the activated carbon itself. According to the N2 physisorption analysis, the microporosity was affected by the carbothermal process,13,20,43 giving lower surface area, total pore volume and lower adsorption capacity (Table 3). On the other hand, an intense CHx decomposition and carbon deposition was identified in our previous work with Ni-promoted tungsten carbide,20,29,48 resulting in a lower carburization temperature and less sintered W2C particles (Fig. S9). However, Ni is also highly active in forming polymeric, filamentous and graphitic carbon deposits on the catalyst surface, which inhibits the active sites of the catalysts.13,16,18,20,42–45

Catalytic performance

Catalytic activity of 1 and 2 wt% Pd-promoted tungsten carbide catalysts were evaluated at 190, 220 and 250 °C as a function of reaction time. Conversion and product distribution results are shown in Fig. 5–7.
image file: c6ra15819f-f5.tif
Fig. 5 Catalytic activity for the conversion of cellulose and yields of EG, 1,2-PG and acetol for reactions at 190 °C for (A) 1Pd–W2C/C and (B) 2Pd–W2C/C.

image file: c6ra15819f-f6.tif
Fig. 6 Catalytic activity for the conversion of cellulose and yields of EG, 1,2-PG and acetol for reactions at 220 °C for (A) 1Pd–W2C/C and (B) 2Pd–W2C/C.

image file: c6ra15819f-f7.tif
Fig. 7 Catalytic activity for the conversion of cellulose and yields of EG, 1,2-PG and acetol for reactions at 250 °C for (A) 1Pd–W2C/C and (B) 2Pd–W2C/C.

The identified reaction products consisted of ethylene glycol (EG), 1,2-propelyne glycol (1,2-PG) and acetol for all reaction temperatures. In addition, glucose, sorbitol, methanol, ethanol, 1-propanol, 1-butanol and levulinic acid were also analyzed. Glucose was not detected in any of the experiments performed, which indicates the catalyst high reactivity under the catalytic parameters tested.

In general, conversion increased as reaction temperature increased. Taking into account the longer reaction time, conversion improved from ∼30% to ∼94% when the reaction temperature increased from 190 °C to 220 °C and reached 100% at 250 °C. Cellulose reactions carried out at 190 °C (Fig. 5) showed similar performances for both catalysts, giving low conversion values with a slight increase after 120 min. EG was the major product, with a maximum yield of ∼10% for both catalysts. 1,2-PG, acetol, sorbitol, ethanol and levulinic acid were also detected with yields lower than 1.5%.

These results are in agreement with previous studies of catalysts based on tungsten carbide in a one-pot cellulose reaction at low temperature as 190 °C.13,49 It is notable that in the case of noble metals or bimetallic catalysts applied in cellulose hydrogenation reactions, sugar alcohols, like hexitols, are the preferred product formed.23,24

Notably, results from the catalytic reaction carried out at 220 °C showed the conversion increasing considerably with reaction time, especially when the 2% Pd–W2C/C catalyst is considered. Cellulose conversion reached 94% for 2% Pd–W2C/C in 150 min and 84% for the 1% Pd–W2C/C catalyst after 180 min of reaction.

Interestingly, both catalysts gave 20% conversion at time zero of the reaction. Time zero corresponds to the reactor heating period under a low hydrogen pressure of 50 psi. Once the reaction temperature was reached (220 °C), the hydrogen pressure was immediately increased to 800 psi and the reaction time taken as zero at this point. For both samples, during this initial heating step, acetol was obtained as the major product (∼4.5% yield) and EG production was negligible.

The conversion increased ∼2.5 times after 30 min of reaction. The product distribution changed due to hydrogen availability, as expected, but also because of the Pd content in the catalyst (Fig. 6A and B). When the 1Pd–W2C/C sample was used, EG yield increased, especially during the 60 min of reaction (∼28%), reaching its highest value ∼37% after 150 min (84% of conversion). Acetol yield followed the opposite trend, forming the major product with a yield of ∼15% in the first 30 min but decreased to ∼4% after 150 min. Over the same reaction time interval 1,2-PG increased from ∼2–7%. It is well known that acetol is an intermediate in 1,2-PG formation from sugars and cellulose.15 Thus, acetol was hydrogenated to 1,2-PG, in agreement with literature.17,30,50

In the case of the 2 wt% Pd-promoted catalyst, EG production was more favored. EG increased from ∼24 (30 min) to ∼58% in 150 min of reaction while the conversion varied from 51 to 93%. Moreover, acetol depletion was followed by the 1,2-PG formation with more pronounced formation after 90 min of reaction.

Ethanol (∼6%) and levulinic acid (∼4%) was observed as secondary products with similar yields for both catalysts. Methanol, 1-propanol and 1-butanol were also detected in trace quantities. The presence of shorter chain alcohols, organic acids and other products such as furans and CO2 can be attributed to subsequent degradation reactions of monosaccharides as well as reaction intermediates, which can undergo further hydrolysis and hydrogenolysis of C–O and C–C bonds under the reaction conditions.13,19,51,52

Reactions performed at 250 °C with both catalysts gave 100% cellulose conversion after 30 min of reaction. Acetol was the main detected product during the reactor heating step (at time 0). Since H2 partial pressure is low (50 psi) the catalyst containing 2 wt% of Pd exhibited higher EG yields compared to 1 wt% of the Pd-promoted catalyst. This tendency was emphasized once the H2 pressure was increase and at longer reaction times. It indicates a higher hydrogenation efficiency of the catalyst when 2% of Pd was used in the tungsten carbide catalyst. On the other hand, acetol hydrogenation to 1,2 PG and other degradation products also took place at 250 °C for both catalysts but was more pronounced in the case of the 1Pd–W2C/C catalyst. It was also observed that an increase in the quantity of secondary products when compared at milder temperatures. Yields of levulinic acid, 1-butanol, 1-propanol, ethanol and methanol were approximately 8%, 2%, 4%, 3% and 1% respectively, with similar results for both catalysts.

The catalytic conversion of cellulose in a one-pot reaction involves various reaction pathways as showed in Scheme 1. Firstly, cellulose is hydrolyzed to form oligomers and glucose. This step is controlled by the H+ ions generated from the hot water and also from the acidic surface properties of the catalyst.10,20 Secondly, glucose can be transformed into a variety of intermediates and products by various side reactions. These routes are strictly dependent on the catalytic properties of the catalyst as well as the reaction parameters.15,17,19–21,50,53,54


image file: c6ra15819f-s1.tif
Scheme 1 Reactions pathways in cellulose conversion, adapted from.15,19

Supported metallic catalysts such as Ru/C and Pt/C readily transform glucose into sugar alcohols by the reduction of the carbonyl groups on the glucose with H2 on the metallic active site leading to the formation of hydrogenated products such as sorbitol and mannitol.10,23,24,55 Here, sorbitol was detected in a concentration lower than 1.5%, indicating that the direct glucose hydrogenation was not favored under the reaction conditions.

Metal promoted tungsten carbides are considered multifunctional catalysts providing high EG yields from cellulose in one-pot reactions. The catalyst is selective in transforming glucose into glycolaldehyde through a retro-aldol reaction catalyzed by tungsten carbide. Secondly, the glycolaldehyde can be hydrogenated to EG over the metallic promoter and W2C active sites of the catalyst.13,15,20,21,24,53 Glucose can be also isomerized to fructose in the reaction conditions. Furthermore, acetol can be obtained by fructose transformation through a retro-aldol reaction on the tungsten carbide sites.15 This was observed at time zero of the reaction at 220 and 250 °C (Fig. 6 and 7), exhibiting acetol as the major product. Once hydrogen pressure is added in the catalytic reaction, acetol and glycoaldehyde (not identified) are hydrogenated to 1,2-PG and EG, respectively by Pd and W active sites.

The stability of the major products, EG and acetol, were tested under the catalytic conditions given in Table 4. EG degraded somewhat over time but was much more stable than acetol. Acetol underwent hydrogenation to 1,2-PG in high proportions. Our results are in agreement with previous studies with tungsten based catalysts.15,21,50

Table 4 Catalytic activity of Pd–W2C/C over different substrates. Reactions conditions: 220 °C, 150 min, 4 MPa of H2
Substrate Conversion (%) Product yield (%, mol C) MBa
EG 1,2-PG Acetol Ethanol Lev. Ac.
a MB = Mass Balance. Low quantities of methanol, 1-propanol and butanol were detected which are not reported in the table.
Cellulose 84 36.9 6.6 1.7 6.1 6.0 60.3
Acetol 71 55.4 1.7 58.4
EG 6


The contribution of tungsten and palladium species on the conversion of cellulose over activated carbon, non-promoted tungsten carbide catalyst (WxC/C) and 1% wt. Pd supported on activated carbon (1Pd/C) was also performed. The activated carbon, used as the catalytic support, was also tested in order to determine its contribution to cellulose conversion. The results are show in Table 5.

Table 5 Cellulose conversion and product yields over different catalysts. Reaction conditions: 220 °C, 150 min, 4 MPa H2
Entry Catalyst Conversion (%) Product yield (%, C mol)
EG 1,2-PG Acetol Ethanol Lev. Ac. MBb
a 60 min of reaction.b MB = Mass Balance. Low quantities of methanol, 1-propanol and butanol were detected which are not reported in the table.
1 WxC/C 89 1.7 0.3 22.5 1.1 0.6 28.6
2 1% Pd/C 73 1.7 0.1 20.5 0.0 1.2 24.7
3 1Pd–W2C/C 86 36.9 6.6 1.7 6.1 6.0 60.3
4 2Pd–W2C/C 93 58.2 4.9 0.4 0.1 3.6 67.5
5 Ca 26 0 0 8.0 0 0.3 8.3


Despite providing relatively high and comparable cellulose conversion, both Pd/C and WxC/C catalysts showed poor selectivity to EG (Table 5, entries 1 and 2). The combination of both metals to obtain a Pd-promoted tungsten carbide catalyst (1Pd–W2C/C and 2Pd–W2C/C) were able to achieve a high EG yield as shown in Table 5 (entry 3 and 4). However, both tested catalysts performed retro-aldol reactions to produce acetol from cellulose (entry 1 and 2). This was not expected from the 1% Pd/C catalyst due to its hydrogenation ability to convert glucose into sugar alcohols.10,23,24,55 However, the lower Pd concentration as well as the lower hydrogen pressure used seems to disfavor hydrogenation reactions. The activated carbon used as the support in all samples, when applied in a pure form in the cellulose conversion, gave low conversions (26%) and produced only a small quantity of acetol (8% yield).

Catalyst reusability is a key factor for industrial applications and due to the variety of recovery procedures and additional structural and catalytic investigations it should be considered as a separate study. Here, the evaluation of the potential reusability of the 2Pd–W2C/C catalyst was performed. According to the XRD data obtained after the catalytic reaction (ESI, Fig. S12), the majority of the W2C phase as well as small and broad peaks relating to Pd0 remain, which indicates structural stability for long-term usage of the catalyst. However, the catalytic results in general exhibited lower conversion and selectivity to EG after 4 recycling runs (Fig. ESI 11). The total polyol yield (EG + acetol + 1,2-PG) also decreased after 4 cycles. Due to the greasy nature of the catalyst after the catalytic reaction, even after multiple water washing procedures, evidence points towards non-reactive oligosaccharides or partially decomposed sugar and/or furans oligomers attached to the catalyst.56 These by-products were not removed during a simple water washing and probably blocked the catalysts active sites decreasing its efficiency. This result indicates that the washing process needs to be improved to remove by-products and recover the catalytic activity of the Pd-promoted tungsten carbide catalyst.

From the results presented here, it is clear that the tungsten carbide catalysts promoted with 2 wt% of Pd give the best catalytic performance under the reaction conditions tested. This system reached the highest EG yield (58%) at 220 °C and 150 min of reaction. At higher temperature (250 °C), competitive side reactions become more favored, which results in a less selective catalytic system towards EG production. However, the multifunctional catalyst still performs the retro-aldol reactions followed by hydrogenation. This catalytic property comes from the interaction between Pd and W2C, which forms during the carburization process in the preparation steps of the catalyst. Using less promoter (1 wt% Pd) in the catalytic system, the interaction between Pd and W2C decreased, resulting in a multifunctional catalyst giving lower hydrogenation potential.

In terms of cellulose conversion and EG yield, Pd-promoted tungsten carbide catalysts are much more efficient than Ni-promoted catalysts when comparing the same cellulose conversion reaction parameters.20 1Pd–W2C/C and 2Pd–W2C/C catalysts converted 72% and 75% of cellulose after 90 min of reaction time, producing ∼31% and 39% EG yield, respectively, while 2% Ni-promoted tungsten carbide catalyst showed ∼65% conversion and 26% EG yield. Moreover, Ni-promoted catalysts gave ∼22% acetol yield, while 1% Pd and 2% Pd-promoted only gave 9.7 and 0.6% respectively. These results point out a superior hydrogenation ability exhibited by Pd and W2C interaction in the cellulose conversion reactions.

Characterization using in situ XRD, XANES/EXAFS and EDS analysis (Fig. 1, 2 and Table 1), showed Pd and W interactions, as well as the formation of tungsten carbide W2C phases during the carburization process. Pd nanoparticles help reduce the tungsten oxide to W0 due to hydrogen spillover. Moreover, palladium is less thermodynamically and kinetically active towards CHx (1 ≤ x ≤ 4) decomposition.26–29 This hinders carbon deposition on the catalyst surface during the carburization, according to the XPS analysis and TEM. The carburization temperature did not decrease, as unanimously10,13,16,18,20,30,50,54,57,58 observed in the literature when Ni is applied as a promoter. Nickel favors the formation CHx decomposition species, which contribute to increasing and speeding up the process of atomic carbon (C*) formation and/or CHx deposition on W surfaces for carburization. However, the catalytic as well as XPS results obtained here and in our previous work20 show that a reduction in methane decomposition produces a cleaner catalyst surface and consequently, a higher conversion of cellulose. This gives Pd an advantage over Ni when its promotional effect on tungsten carbide is considered.

The catalytic efficiency as well as structural, surface and electronic properties of the Pd-promoted tungsten carbide catalysts have not been explored in the literature up to now. Only few catalytic tests are reported.17,30 From the studies here as well as in the well-explored Ni-promoted tungsten based catalyst studies,10,13–20,30,49,50,54,57–60 the interaction of the promoter and W2C is a key point in the efficiency of cellulose conversion of towards EG production. Palladium hindered carbon deposition on the catalyst surface. Carbon deposition is a drawback when transition metals carbide catalysts are considered.20,42,43,45 This may reveal a better and more profitable balance amongst catalyst cost, physical, chemical and catalytic properties to obtain higher EG selectivity from cellulose than Ni-promoted tungsten based catalysts.

Conclusions

The promotional effect of Pd on the tungsten carbide catalyst provided advantageous physical and chemical properties for catalytic application. A carbide catalyst with a cleaner and less inhibited surface was obtained due to less thermodynamically and kinetically active palladium reducing CHx (1 ≤ x ≤ 4) decomposition during the carburization process. Thus, higher cellulose conversion was observed when compared to Ni-promoted tungsten carbide catalysts.

The interaction of Pd and W also enhances the ability of the catalyst to perform multi-step reactions resulting in higher conversion and selectivity towards ethylene glycol production. Thus, Pd seems to offer a better balance amongst catalyst composition, structural and surface properties as well as catalytic activity to obtain high value-added platform chemicals from cellulose.

Acknowledgements

The authors are grateful to LNLS/CNPEM and CAPES-CNPEM CNPq for the financial support, CTBE/CNPEM for chromatographic analysis of reaction products, LNNano for the TEM microscope and LNLS-Brazil, ESRF (IH-CH-1003), and Diamond-UK for the synchrotron radiation facilities.

References

  1. L. Hu, G. Zhao, W. Hao, X. Tang, Y. Sun, L. Lin and S. Liu, RSC Adv., 2012, 2, 11184 RSC.
  2. M. J. Climent, A. Corma and S. Iborra, Chem. Rev., 2011, 111, 1072–1133 CrossRef CAS PubMed.
  3. H. Cai, C. Li, A. Wang and T. Zhang, Catal. Today, 2014, 234, 59–65 CrossRef CAS.
  4. J. J. Bozell and G. R. Petersen, Green Chem., 2010, 12, 539 RSC.
  5. P. Gallezot, Chem. Soc. Rev., 2012, 41, 1538–1558 RSC.
  6. H. Kobayashi, T. Komanoya, S. K. Guha, K. Hara and A. Fukuoka, Appl. Catal., A, 2011, 409–410, 13–20 CrossRef CAS.
  7. J. Ross, Heterogeneous catalysis: fundamentals and applications, Elsevier B.V., 2012 Search PubMed.
  8. R. Rinaldi and F. Schüth, Energy Environ. Sci., 2009, 2, 610 CAS.
  9. D. Alonso, J. Bond and J. Dumesic, Green Chem., 2010, 12, 1493–1513 RSC.
  10. M. Yabushita, H. Kobayashi and A. Fukuoka, Appl. Catal., B, 2014, 145, 1–9 CrossRef CAS.
  11. K. Fabičovicová, M. Lucas and P. Claus, Green Chem., 2015, 17, 3075–3083 RSC.
  12. L. Negahdar, J. U. Oltmanns, S. Palkovits and R. Palkovits, Appl. Catal., B, 2014, 147, 677–683 CrossRef CAS.
  13. N. Ji, T. Zhang, M. Zheng, A. Wang, H. Wang, X. Wang and J. G. Chen, Angew. Chem., Int. Ed., 2008, 47, 8510–8513 CrossRef CAS PubMed.
  14. G. Zhao, M. Zheng, A. Wang and T. Zhang, Chin. J. Catal., 2010, 31, 928–932 CrossRef CAS.
  15. L. Zhou, A. Wang, C. Li, M. Zheng and T. Zhang, ChemSusChem, 2012, 5, 932–938 CrossRef CAS PubMed.
  16. Y. Zhang, A. Wang and T. Zhang, Chem. Commun., 2010, 46, 862–864 RSC.
  17. A. Wang and T. Zhang, Acc. Chem. Res., 2013, 46, 1377–1386 CrossRef CAS PubMed.
  18. N. Ji, M. Zheng, A. Wang, T. Zhang and J. G. Chen, ChemSusChem, 2012, 5, 939–944 CrossRef CAS PubMed.
  19. R. Ooms, M. Dusselier, J. a. Geboers, B. Op de Beek, R. Verhaeven, E. Gobechiya, J. a. Martens, A. Redl and B. F. Sels, Green Chem., 2014, 16, 695–707 RSC.
  20. C. B. Rodella, D. H. Barrett, S. F. Moya, S. J. a. Figueroa, M. T. B. Pimenta, A. A. S. Curvelo and V. Teixeira da Silva, RSC Adv., 2015, 5, 23874–23885 RSC.
  21. J. Wang, G. Yao, Y. Wang, H. Zhang, Z. Huo and F. Jin, RSC Adv., 2015, 5, 51435–51439 RSC.
  22. A. L. Dantas Ramos, P. D. S. Alves, D. a. G. Aranda and M. Schmal, Appl. Catal., A, 2004, 277, 71–81 CrossRef CAS.
  23. H. Kobayashi, T. Komanoya, S. K. Guha, K. Hara and A. Fukuoka, Appl. Catal., A, 2011, 409–410, 13–20 CrossRef CAS.
  24. T. Deng and H. Liu, Green Chem., 2012, 116–124 Search PubMed.
  25. Y. Li, Y. Liao, X. Cao, T. Wang, L. Ma, J. Long, Q. Liu and Y. Xua, Biomass Bioenergy, 2015, 74, 148–161 CrossRef CAS.
  26. K. Li, M. Jiao, Y. Wang and Z. Wu, Surf. Sci., 2013, 617, 149–155 CrossRef CAS.
  27. J. Sarada Prasad, V. Dhand, V. Himabindu and Y. Anjaneyulu, Int. J. Hydrogen Energy, 2011, 36, 11702–11711 CrossRef CAS.
  28. S. Esconjauregui, C. M. Whelan and K. Maex, Carbon, 2009, 47, 659–669 CrossRef CAS.
  29. A. M. Amin, E. Croiset and W. Epling, Int. J. Hydrogen Energy, 2011, 36, 2904–2935 CrossRef CAS.
  30. M.-Y. Zheng, A.-Q. Wang, N. Ji, J.-F. Pang, X.-D. Wang and T. Zhang, ChemSusChem, 2010, 3, 63–66 CrossRef CAS PubMed.
  31. B. Ravel and M. Newville, J. Synchrotron Radiat., 2005, 12, 537–541 CrossRef CAS PubMed.
  32. S. Lowell, J. E. Shields, M. A. Thomas and M. Thommes, Characterization of Porous Solids and Powders: Surface Area, Pore Size and Density, Kluwer Academic Publishers, 2004 Search PubMed.
  33. M. Thommes, K. Kaneko, A. V. Neimark, J. P. Olivier, F. Rodriguez-Reinoso, J. Rouquerol and K. S. W. Sing, Pure Appl. Chem., 2015, 87, 1051–1069 CrossRef CAS.
  34. G. F. Leal, L. A. Ramos, D. H. Barrett, A. A. S. Curvelo and C. B. Rodella, Thermochim. Acta, 2015, 616, 9–13 CrossRef CAS.
  35. A. Y. Stakheev, I. C. Mashkovskii, O. P. Tkachenko, K. V. Klementiev, W. Grünert, G. N. Baeva and L. M. Kustov, Russ. Chem. Bull., 2009, 58, 280–283 CrossRef CAS.
  36. M. Bauer, R. Schoch, L. Shao, B. Zhang, A. Knop-Gericke, M. Willinger, R. Schlögl and D. Teschner, J. Phys. Chem. C, 2012, 116, 22375–22385 CAS.
  37. A. L. Bugaev, A. A. Guda, K. A. Lomachenko, V. V. Srabionyan, L. A. Bugaev, A. V. Soldatov, C. Lamberti, V. P. Dmitriev and J. A. van Bokhoven, J. Phys. Chem. C, 2014, 118, 10416–10423 CAS.
  38. J. a. McCaulley, J. Phys. Chem., 1993, 97, 10372–10379 CrossRef CAS.
  39. M. W. Tew, J. T. Miller and J. a. van Bokhoven, J. Phys. Chem. C, 2009, 113, 15140–15147 CAS.
  40. B. N. Nguyen, L. A. Adrio, T. Albrecht, A. J. P. White, M. A. Newton, M. Nachtegaal, S. J. A. Figueroa and K. K. (Mimi) Hii, Dalton Trans., 2015, 44, 16586–16591 RSC.
  41. A. Eyssler, P. Mandaliev, A. Winkler, P. Hug, O. Safonova, R. Figi, A. Weidenkaff and D. Ferri, J. Phys. Chem. C, 2010, 114, 4584–4594 CAS.
  42. A. Löfberg, A. Frennet and G. Leclercq, J. Catal., 2000, 183, 170–183 CrossRef.
  43. C. Liang, F. Tian, Z. Li, Z. Feng, Z. Wei and C. Li, Chem. Mater., 2003, 15, 4846–4853 CrossRef CAS.
  44. F. H. Ribeiro, R. a. Dalla Betta, M. Boudart, J. E. Baumgartner and E. Iglesia, J. Catal., 1991, 130, 86–105 CrossRef CAS.
  45. F. H. Ribeiro, M. Boudart, R. A. D. Betta, R. A. Dalla Betta and E. Iglesia, J. Catal., 1991, 513, 498–513 CrossRef.
  46. C. D. Wagner, W. M. Riggs, L. E. Davis and J. F. Moulder, Handbook of X-ray Photoelectron Spectroscopy, Perkin-Elmer Corporation, 1st edn, 1992 Search PubMed.
  47. J.-M. Giraudon, P. Devassine, J.-F. Lamonier, L. Delannoy, L. Leclercq and G. Leclercq, J. Solid State Chem., 2000, 154, 412–426 CrossRef CAS.
  48. S. Ahmed, A. Aitani, F. Rahman, A. Al-Dawood and F. Al-Muhaish, Appl. Catal., A, 2009, 359, 1–24 CrossRef CAS.
  49. Y. Liu, C. Luo and H. Liu, Angew. Chem., Int. Ed., 2012, 51, 3249–3253 CrossRef CAS PubMed.
  50. N. Ji, T. Zhang, M. Zheng, A. Wang, H. Wang, X. Wang, Y. Shu, A. L. Stottlemyer and J. G. Chen, Catal. Today, 2009, 147, 77–85 CrossRef CAS.
  51. Y. Cao, J. Wang, M. Kang and Y. Zhu, J. Mol. Catal. A: Chem., 2014, 381, 46–53 CrossRef CAS.
  52. K. Fabičovicová, O. Malter, M. Lucas and P. Claus, Green Chem., 2014, 16, 3580–3588 RSC.
  53. R. Sun, M. Zheng, J. Pang, X. Liu, J. Wang, X. Pan, A. Wang, X. Wang and T. Zhang, ACS Catal., 2016, 6, 191–201 CrossRef CAS.
  54. L. Zhou, J. Pang, A. Wang and T. Zhang, Chin. J. Catal., 2013, 34, 2041–2046 CrossRef CAS.
  55. N. Yan, C. Zhao, C. Luo, P. J. Dyson, H. Liu and Y. Kou, J. Am. Chem. Soc., 2006, 128, 8714–8715 CrossRef CAS PubMed.
  56. P. Gallezot, Chem. Soc. Rev., 2012, 41, 1538–1558 RSC.
  57. M. Zheng, J. Pang, A. Wang and T. Zhang, Chin. J. Catal., 2014, 35, 602–613 CrossRef CAS.
  58. C. Li, M. Zheng, A. Wang and T. Zhang, Energy Environ. Sci., 2012, 5, 6383 CAS.
  59. J. Pang, M. Zheng, A. Wang and T. Zhang, Ind. Eng. Chem. Res., 2011, 50, 6601–6608 CrossRef CAS.
  60. J. Pang, M. Zheng, R. Sun, L. Song, A. Wang, X. Wang and T. Zhang, Bioresour. Technol., 2015, 175, 424–429 CrossRef CAS PubMed.

Footnote

Electronic supplementary information (ESI) available. See DOI: 10.1039/c6ra15819f

This journal is © The Royal Society of Chemistry 2016
Click here to see how this site uses Cookies. View our privacy policy here.